Hello, thanks for this! Exciting to see more concrete estimates out of QURI!
However, how much people prefer the first double of consumption over the second is an empirical question. And empirically, people get more utility from the first doubling of consumption than the second. Doubling twice creates 1.66 units rather than 2. An isoelastic utility function can represent this difference in preferences.
Isoelastic utility functions allow you to specify how much one would prefer the first double to the second with the η parameter. When η=1, the recipient values the first double the same as the second and is what the current CEA assumes. When η>1, recipients prefer the first doubling in consumption as worth more than the second. Empirically, η≈1.5. GiveWell recognises this and uses η=1.59 in their calculation of the discount rate:
I think your claims here (and the general conclusion) is a bit stronger than warranted. The analysis you link seems reasonably strong on a quick skim, but it is used for the UK:
This paper provides novel empirical evidence on the value of the elasticity of marginal utility, , for the United Kingdom. is a crucial component of the social discount rate (SDR), which determines the inter-temporal trade-offs that are acceptable to society. Using contemporaneous and historical data, new estimates are obtained using four revealed-preference techniques: the equal-sacrifice income tax approach, the Euler-equation approach, the Frisch additive-preferences approach and risk aversion in insurance markets. A meta-analysis indicates parameter homogeneity across approaches, and a central estimate of 1.5 for . The confidence interval excludes unity, the value used in official guidance by the UK government.
The UK (GDP per capita: 40k) data seems very out-of-sample for Kenya (GDP per capita: 1.8k), Uganda (GDP per capita 0.8k), Rwanda, Liberia, Malawi, DRC, and Morocco. As is often the case with social science research, we should be skeptical of out-of-country and out-of-distribution generalizability.
So I'm not sure whether I should make a huge update in the direction of this data, and I think this uncertainty should be flagged more in your post.
___
Taking a step back, I do think it's plausible that the first doubling of money creates more utility than the second doubling, and this generalizes reasonably well across multiple doublings. Firstly because there's no strong theoretical reason to prefer unity (prefer a doubling the same degree as disprefer a halving). And anecdotally, this matches my intutions. Certainly I personally feel like the difference between my material well-being now vs my childhood (consumption ~1 OOM more?) is not as different as the consumption between my childhood and that of the median person in Kenya (consumption another ~1 OOM more or so). But of course my own intuitions are pretty out-of-distribution here too!
Sam and I have discussed this project in private and for the record will summarise a few of my comments here in case another reader had the similar thoughts. Overall, I’m supportive, and a big fan of doing analyses like this. At HLI we attempt to quantify uncertainty in our in depth analyses! We’ve also done a GiveDirectly cost-effectiveness analysis where we estimated the uncertainty for every parameter based on empirical estimates of variance. Hence, why I have views on the topic.
Here are the things I mentioned, and what Sam and I will likely continue to discuss.
Why quantify uncertainty in the first place?
We may care about uncertainty because we want to know about the relative uncertainty in the cost-effectiveness of interventions.
Or, we may have a desire to compare the likelihood of harm across two interventions. Both of which adding uncertainty would afford.
The argument we need to make isn’t just about it being better but it being worth the additional time and effort it takes.
Why Squiggle? And not Guesstimate, Causal or R / Python.
Note, you say:
It offers a large collection of advantages over other alternatives:
Ability to write detail inbetween cells
External links
Ability to quantify uncertainty
Ability to create calculators and interactive analysis
But Causal and Guesstimate / R notebooks appear to already do some / most of these? Indeed, in the appendix you go on to say:
In honesty, I could complete all of the research outcomes listed here with either of these two platforms. However, I see possibilities that Squiggle can far exceed the capabilities of these two platforms, mainly through the use of functions and its flexibility as a custom DSL for estimation. This analysis did not use these features, but Ozzie discussed them in a past post on Squiggle.
If functions is what you need, then why not R? Or write a package for R or Python? (I don't know what DSL means).
For my part, I’m a pretty big fan of using R. Many Effective Altruist organisations are very google docs dependent, HLI included. But we’ve found a pretty satisfying workflow where we go: google sheets → R → back to google sheets → link summary tables to google docs. Hopefully we will make the code for this public if / when we update our analysis in the next year.
I’m all for quantifying uncertainty, but I would like to hear more about the need for a new language that will presumably need support through its life cycle? (Or am I missing something?) Squiggle makes a lot of sense for forecasting (which appears the intended purpose?). I don’t want to open R and write a script when I just want a quick and dirty Monte Carlo simulation to help me answer a metaculus question. For that purpose Squiggle and Guesstimate work well.
What are the implications?
Currently, the meatiest takeaway is "Quantifying uncertainty eventually found that the cost effectiveness of GiveDirectly varies by about an order of magnitude and is approximately lognormally distributed. The cost effectiveness, however doesn't have particularly large tails.” and to paraphrase: “there are a lot of other possibilities!”
What does this mean practically?
Adding uncertainty allows you to easily do a sensitivity analysis where you find the inputs that explain the most variation in the results. You can then single these out for special attention and scrutiny. An investigation will look weird if 50% of the results are explained by that input that was a subjective guess.
I’d be VERY interested to see how the value of information stuff would be done because I don’t know how to do this.
For my part, I’m a pretty big fan of using R. Many Effective Altruist organisations are very google docs dependent, HLI included. But we’ve found a pretty satisfying workflow where we go: google sheets → R → back to google sheets → link summary tables to google docs. Hopefully we will make the code for this public if / when we update our analysis in the next year.
I love R and maybe there is a way to integrate this project into R? That said, I'd like to see this take on an 'output' format with some of the benefits shown in this notebook, and in dashboards like the one for Causal app.
What are the implications?
The connotation of the language "what are the implications" as a header , which I think you didn't mean, could be "what's the big deal, not impressed". If someone (not you :) ) were to say that, I'd suggest also we need to give it a little more time, and in particular, have at least two models to compare, for at least 2 interventions/charities.
Your discussion of 'sensitivity analysis' seems like this could lead to a lot of value. I've seen a bit about the VOI stuff but I'm also not versed in it; but we could get someone on board who is.
When you wrote
I don’t want to open R and write a script when I just want a quick and dirty Monte Carlo simulation to help me answer a metaculus question. For that purpose Squiggle and Guesstimate work well.
I don’t want to open R and write a script when I just want a quick and dirty Monte Carlo simulation to help me answer a metaculus question. For that purpose Squiggle and Guesstimate work well.
Wikipedia lists some main advantages and disadvantages, I mostly agree with this section and think in most cases we should go for an R, Python or Apps Script/js library or framework, but there are cases of successful DSLs (e.g. LaTeX). I'm curious what the target audience is for squiggle, maybe professional forecasters that are not programmers?
I'm very impressed with this work. I'd love to see more resources devoted to it. This ties in with something I've been encouraging and trying to bring together. I made a Gitbook HERE to organize the project and it's discussion. Please engage and comment on that if you are interested.
IMO big gains here will include:
the use of quantified uncertainty to allow us to expand the set of interventions we can consider, in a principled and transparent way
better understanding of how moral parameters and world views should affect your cause prioritization (or not)
better appreciation and understanding of the importance of the Fermi-MonteCarlo approach, leading to more general adoption and more careful comparisons among EA research and funding orgs
Would love to! I'm in communication to set up an EA Funds grant to continue building these for other GiveWell charities. I'd also like to do this with ACE! but I'll need to communicate with them about it.
Regarding Baseline consumption, GiveWell addressed it here (in their report of GD, the section discussing selection of recipients).
Endline results from this study in July 2018 found that mean consumption per capita per day in the full population of the control villages was $0.79.43 We would guess that this population is fairly similar to current beneficiaries of GiveDirectly's program in Kenya. [...]
Given our estimate that households in places where GiveDirectly previously used the targeting model had a mean per capita consumption level of approximately $0.78 per day,45 the results from the general equilibrium study suggest that the income levels of recipients under the targeting and saturation models are very similar. Prior to seeing the new data, we expected recipients under the village saturation model to be somewhat wealthier, on average, than the average recipient under the household targeting model. This result may be an indication that the targeting model was not particularly effective at identifying the poorest households in a village and/or that GiveDirectly is now working in areas that are poorer overall than where it worked previously.
Now that I've realised this, I will remove the entire baseline consumption consideration. As projecting forward I assume GiveDirectly will just get better at selecting poor households to counteract the fact that they should be richer. Thanks for pointing this out!
A good time to mention that I thought this is really great work, and nice spotting of gaps in the original analysis (even if specifically this seem to have been addressed, it wasn't at all clear from the CEA spreadsheet) :)
Do you have any thoughts regarding the advantages of Squiggle over Google Colab? The latter also allows for quantification of uncertainty (e.g. using numpy.random), named references, hypertext, and forking. Squiggle seems better in terms of change requests (although it is possible to make comments in Colab), but Google Colab is based on Python.
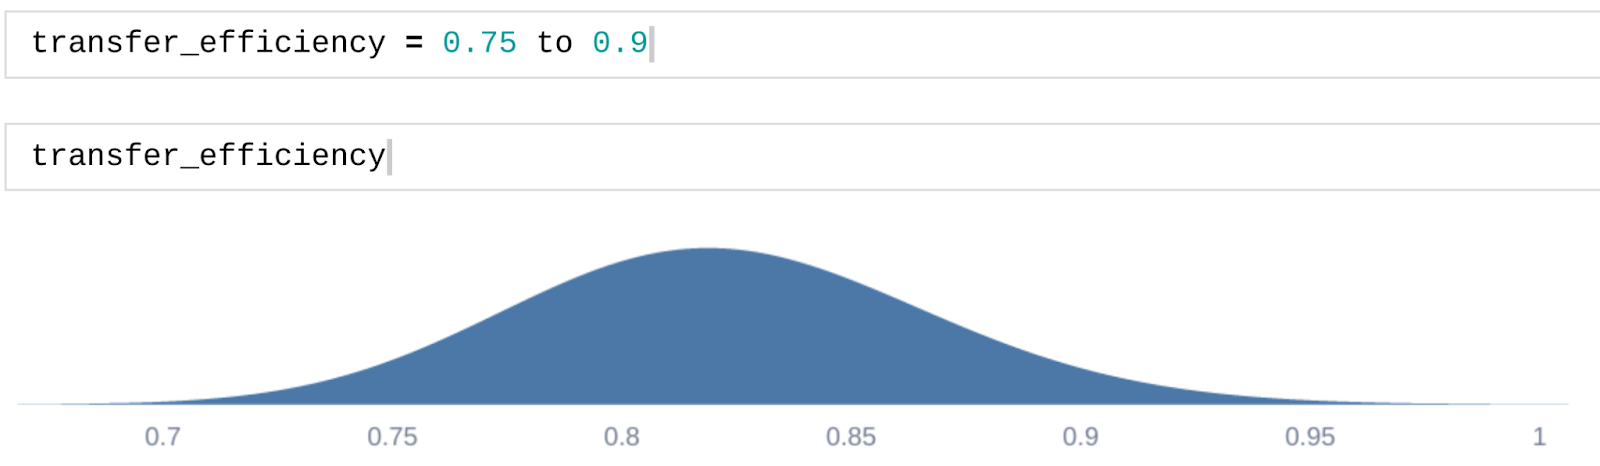
I've never used Squiggle, but I imagine its main benefit is the ease of use and transparency. Consider the line > transfer_efficiency = 0.75 to 0.9 in the Squiggle doc. In Numpy, you'd most likely have to select number samples, initiate an rng object (at least if you do as Numpy recommend), transform the quantiles (0.05,0.95)-quantiles 0.75 and 0.9 into mean and sigma, call the log-normal random generator and store them in an array, then call the appropriate plot function. Most of these steps are minor nuisances, except for the transformation of quantiles, which might be beyond the analyst's skill level to do efficiently.
Here's my replication in Python, which was kind of a chore to make... All of this can be done in one line in Squiggle.
import numpy as np import scipy.stats as st import matplotlib.pyplot as plt
rng = np.random.default_rng(313) n = 10000
# Translate quantiles a = np.log(0.75) b = np.log(0.9)
k1 = st.norm.ppf(0.05) k2 = st.norm.ppf(0.95) sigma = (b - a) / (k2 - k1) mean = b - sigma * k2
x = np.linspace(0.7, 1, 100) plt.plot(x, st.lognorm.pdf(x/np.exp(mean), sigma)) # Scipy's parameterization of the log-normal is stupid. Cost me another 5 minutes to figure out how to do this one.
### It's prudent to check if I've done the calculations correctly too.. np.quantile(transfer_efficiency, [0.05, 0.95]) # array([0.75052923, 0.90200089])
1- If one had e.g. the 10th and 90th percentiles instead of the 5th and 95th, would Guesstimate and Squiggle be able to model the distribution in one line? I think one of the major upsides of Python is its flexibility...
2- I agree that converting the quantiles to distribution parameters is the main hurdle. With that in mind, I posted this roughly 1 week ago.
3- Using this spreadsheet to determine the distribution parameters mu and sigma (as explained in the post linked just above), it is also possible to calculate the distribution with one line: transfer_efficiency = np.random.lognormal(mu, sigma, N_samples)
Quantifying Uncertainty in GiveWell's GiveDirectly Cost-Effectiveness Analysis — EA Forum
Quantifying Uncertainty in GiveWell's GiveDirectly Cost-Effectiveness Analysis
I used AI to fix transcription errors, rerrarange the ideas, and suggest tweaks to the title and some sentences.
Three of the most exciting projects to come out of EA in recent years are, in a vague sense, CEA spinouts:
* Kairos is directly a spinout of CEA and now handles most support for university AI safety groups. Basically everyone I've found who knows them is really excited about what they do
* NEST is an opinionated ideas-fi...
This post presents the executive summary from Giving What We Can’s impact evaluation for 2025. At the end of this post we share links to more information, including the full report and...
Effort: This took about 40 hours to research and write, excluding time spent developing Squiggle.
Disclaimer: Opinions do not represent the Quantified Uncertainty Research Institute nor GiveWell. I talk about GiveWell's intentions with the GiveDirectly model. However, my understanding may not be complete. All mistakes are my own.
Epistemic Status: I am uncertain about these uncertainties! Most of them are best guesses. I could also be wrong about the inconsistencies I've identified. A lot of these issues could easily be considered bike-shedding.
Target Audiences: I wrote this post for:
People who are interested in evaluating interventions.
People who are interested in the quantification of uncertainty.
EA software developers that are interested in open source projects.
TLDR: I've transposed GiveDirectly's Cost-Effectiveness Analysis into an interactive notebook. This format allows us to measure our uncertainty about GiveDirectly's cost-effectiveness. The model finds that GiveDirectly's 95% confidence interval for its effectiveness spans an order of magnitude, which I deem a relatively low level of uncertainty. Additionally, I found an internal inconsistency with the model that increased GiveDirectly's cost-effectiveness by 11%.
The notebook is quite long, detailed and technical. Therefore, I present a summary in this post.
This model uses Squiggle, an in-development language for estimation and evaluation, developed by myself and others at the Quantified Uncertainty Research Institute. We'll write more about the language itself in future posts, especially as it becomes more stable.
GiveWell's cost-effectiveness analyses (CEAs) of top charities are often considered the gold standard. However, they still have room for improvement. One such improvement is the quantification of uncertainty. I created a SquiggleNotebook that investigates this for GiveDirectly CEA. This notebook also serves as an example of Squiggle and what's possible with future CEAs.
In GiveWell's CEAs, GiveDirectly is used as a benchmark to evaluate other interventions. All other charities' effectiveness is measured relative to GiveDirectly. For example, as of 2022, the Against Malaria Foundation was calculated to be 7.1x to 15.4x as cost-effective as GiveDirectly. Evidence Action's Deworm the World is considered 5.3x to 38.2x as cost-effective. GiveDirectly makes a good benchmark because unconditional cash transfers have a strong (some might even say tautological) case behind their effectiveness. GiveDirectly being a benchmark makes it a good start for quantifying uncertainty. I also focus on GiveDirectly because it's the most simple CEA.
GiveWell CEAs do notinclude explicit considerations of uncertainty in their analysis. However, quantifying uncertainty has many benefits. It can:
Improve people's understanding of how much evidence we have behind interventions.
Help us judge the effectiveness of further research on an intervention using the Value of Information.
Allows us to forecast parameters and better determine how wrong we were about different parameters to correct them over time.
The primary decision in this work is choosing how much uncertainty each parameter has. I decided on this with two different methods:
If there was enough information about the parameter, I performed a formal bayesian update.
If there wasn't as much information, I guessed it with the help of Nuño Sempere, a respected forecaster. These estimates are simple, and future researchers could better estimate them.
Results
Methodology and calculations are in my Squiggle notebook:
I designed the notebook to read standalone if you are technically minded and like the specifics. However, it is long, and it may be beneficial to look over this blog post first as the notebook achieves a large number of aims at the same time.
GiveWell bases GiveDirectly's effectiveness on the premise that poorer people value money more. To do this, GiveWell models how much it costs GiveDirectly to double someone's consumption for a year. For instance, the baseline consumption is $285.92 a year. If we were to increase an individual's consumption from $285.92 to $571.84 for a year, this would be considered 1 unit of value. Consumption is the resources that they use measured in dollars. If someone consumes less, it's cheaper to double their consumption and, therefore, more cost-effective.
For the most part, this notebook is a faithful transcription of the GiveWell models into Squiggle Notebooks.
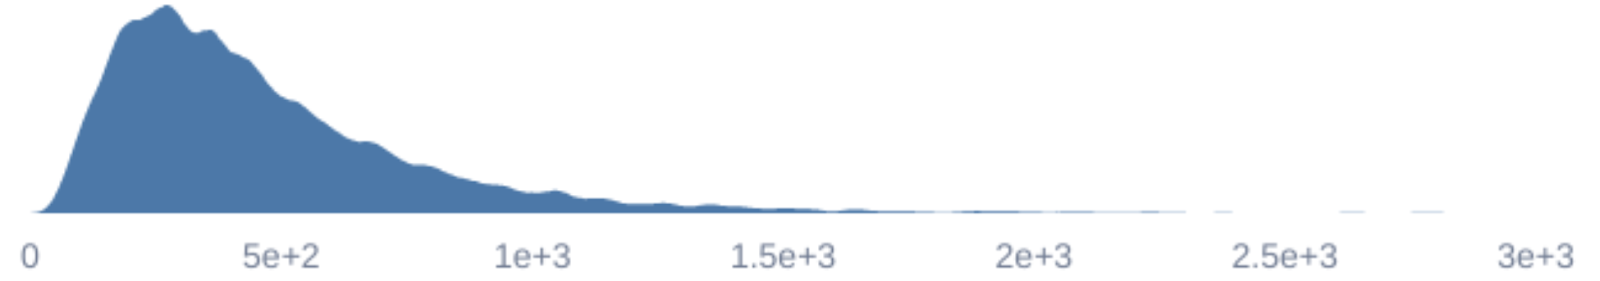
Based on our model, the mean cost to double someone's consumption for a year is $468.93, with a 95% credible interval from $130.56 to $1,185.44. Relative to other interventions, I believe this to be very low uncertainty around GiveDirectly's cost-effectiveness.
Uncertainty of cost of doubling consumption for a year
Most of this uncertainty is likely due to our estimates of parameters rather than the formal Bayesian analysis. However, I currently don't know exactly how much. I'd be interested in extending this work to answer this question in the future.
I made some changes to the model when representing it in Squiggle. These changes were either stylistic or made to remove internal inconsistencies with the model. Most of these changes were minor inconsistencies that did not change GiveDirectly's cost-effectiveness by any significant margin. I list these in the Squiggle Notebook.
However, an internal inconsistency impacted the cost-effectiveness by a more significant margin. This change was about isoelastic utility. Reading into the details requires understanding the specifics of the GiveDirectly model.
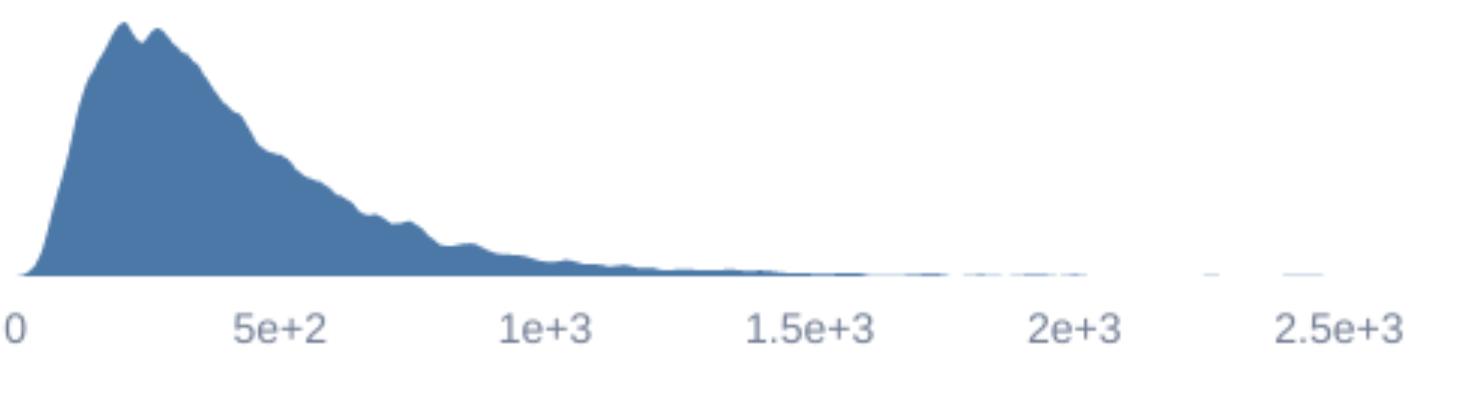
In summary, fixing the internal inconsistency increases GiveDirectly's cost-effectiveness by 11%, changing the mean cost of doubling consumption for a year from $468.61 to $415.87 with a 95% credible interval from $119.54 to $962.49.
Isoelastic vs Logarithmic increases in consumption
GiveWell measures GiveDirectly's cost-effectiveness by doublings of consumption per year. For instance, Increasing an individual's consumption from $285.92 to $571.84 for a year would be considered 1 unit of utility.
However, there is a bit of ambiguity here. What happens when you double someone's consumption twice? For instance, $285.92 to $1,143.68 a year? So, if increasing consumption by 100% has a utility of 1, how much utility does this have? A natural answer might be that doubling twice creates two units of utility. This answer is what the GiveWell CEA currently assumes. This assumption is implicit by representing utility as logarithmic increases in consumption.
However, how much people prefer the first double of consumption over the second is an empirical question. And empirically, people get more utility from the first doubling of consumption than the second. Doubling twice creates 1.66 units rather than 2. An isoelastic utility function can represent this difference in preferences.
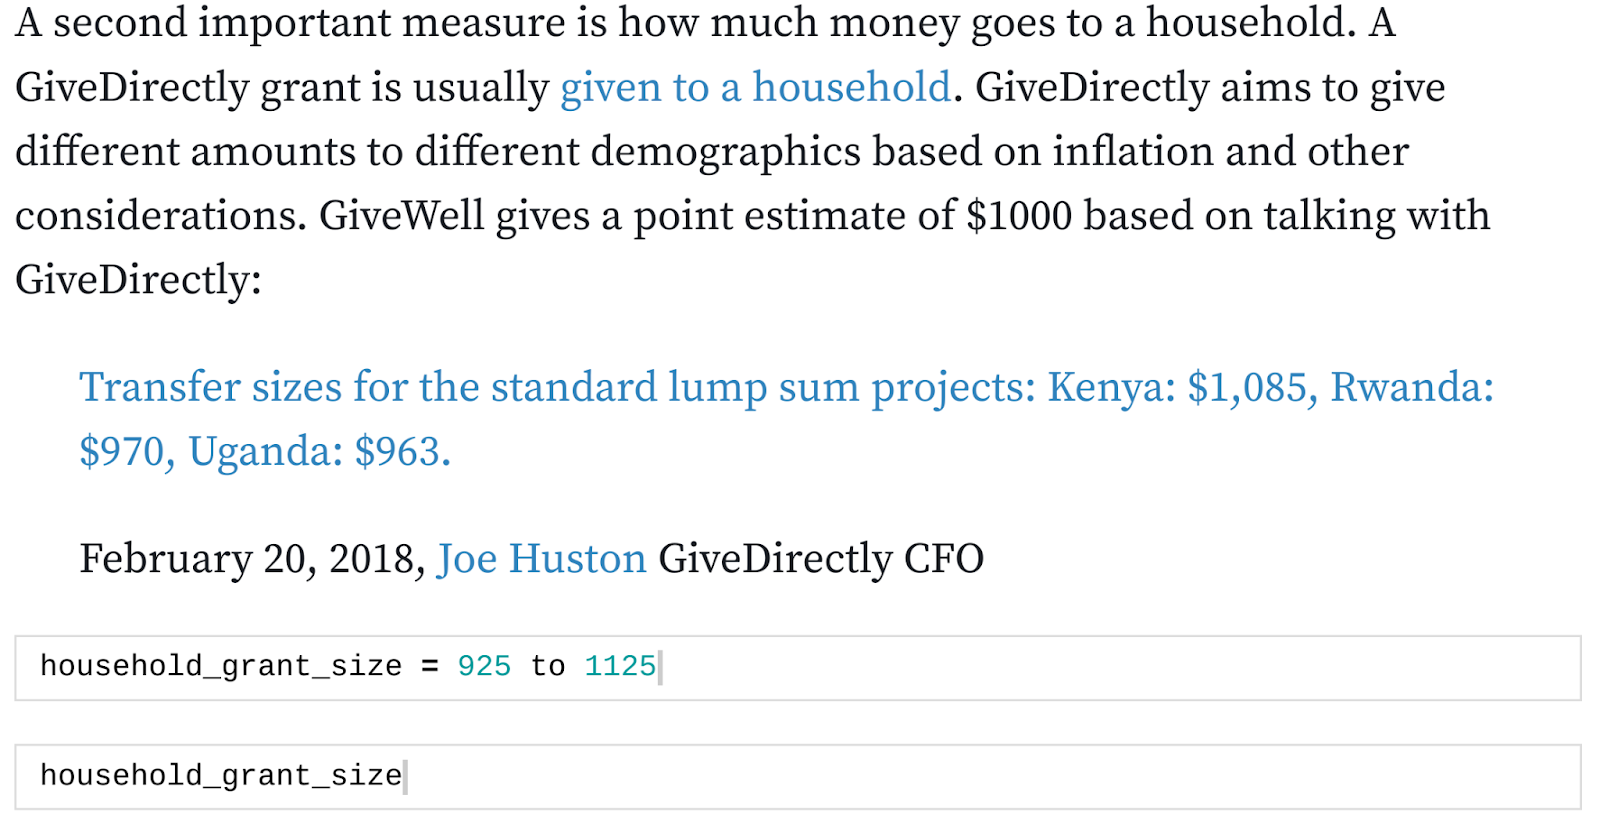
Isoelastic utility functions allow you to specify how much one would prefer the first double to the second with the η parameter. When η=1, the recipient values the first double the same as the second and is what the current CEA assumes. When η>1, recipients prefer the first doubling in consumption as worth more than the second. Empirically, η≈1.5. GiveWell recognises this and uses η=1.59 in their calculation of the discount rate:
Increases in consumption over time meaning marginal increases in consumption in the future are less valuable. We chose a rate of 1.7% based on an expectation that economic consumption would grow at 3% each year, and the function through which consumption translates to welfare is isoelastic with eta=1.59. (Note that this discount rate should be applied to increases in ln(consumption), rather than increases in absolute consumption; see calculations here)
I've created a desmos calculator to explore this concept. From the calculator, you can change the value of η and see how isoelastic utility compares to logarithmic utility.
GiveDirectly transfers don't usually double someone's consumption for a year but increase it by a lower factor. So an isoelastic utility would find that recipients would gain more utility than logarithmic utility implies.
Changing η from 1 to 1.59 increases GiveDirectly's cost-effectiveness by 11%. Reducing the cost of doubling someone's consumption for a year from $466.34 to $415.87.
Cost of Doubling consumption for a year with isoelastic utility
Acknowledgements
I completed this work with help and funding from the Quantified Uncertainty Research Institute. Thanks to Nuño Sempere, Ozzie Gooen, David Reinstein, Quinn Dougherty, Misha Yagudin, and Edo Arad for their feedback.
Appendix A - Squiggle
Here we look into the technology that made this possible, Squiggle!
Squiggle is a language developed by the Quantified Uncertainty Research Institute for forecasting and estimating. It is in a pre-alpha stage and has many known and unknown bugs. I will detail some of the benefits of using Squiggle for this evaluation. I hope that this might encourage people to be interested in seeing more Squiggle evaluations.
This part of the analysis is simply a comparison between the two formats.
The first and most obvious change is that Squiggle allows you to represent uncertainty with distributions.
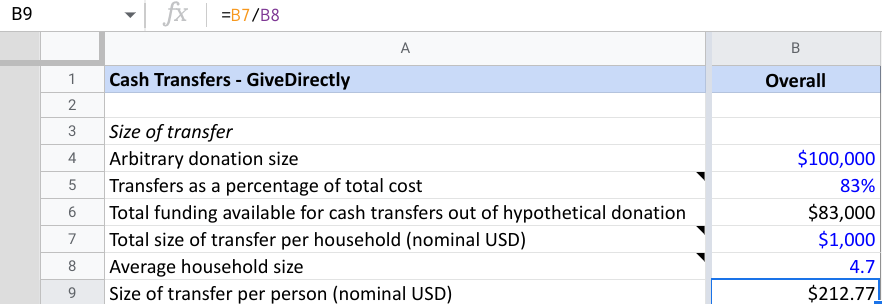
Google Sheets:
Google Sheets represent paramaters as scalars
Squiggle Notebooks:
Squiggle represents paramameters as distributions
Named References
Squiggle references other variables by their names rather than by their cell references, making it easier to read different parts of an analysis individually:
Google Sheets:
Google Sheets reference through cell numbers
Squiggle Notebooks:
Squiggle references using variable names
Hypertext
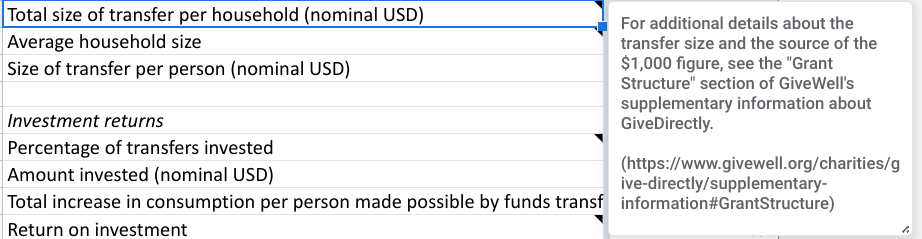
Squiggle notebooks allow for text and explanations that can be linked and are easier to read than notes in Google Sheets.
Google Sheets:
Google sheets has plaintext notes crammed in dialogs
Squiggle Notebooks:
Squiggle Notebooks allow hypertext. With linking images, and updating text
Forking and change requests
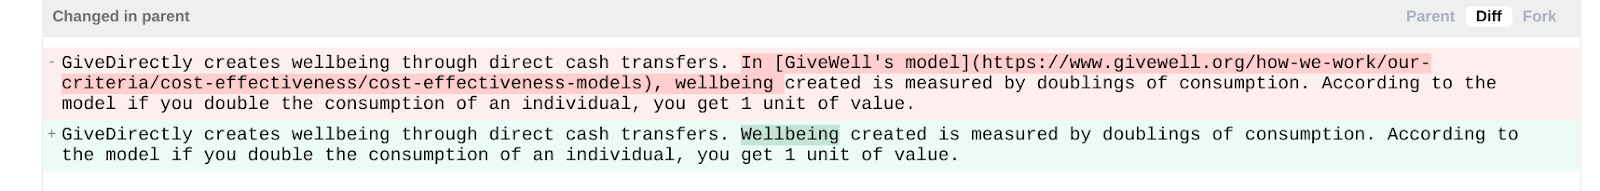
Both Google Sheets and Squiggle Notebooks allow you to make copies of documents and make edits to them yourselves. However, Squiggle Notebooks supports merge requests, requesting the original document be changed, with a detailed diff of the changes made.
A diff for a suggested change to the notebook. Can be contributed by anyone.
Interactivity
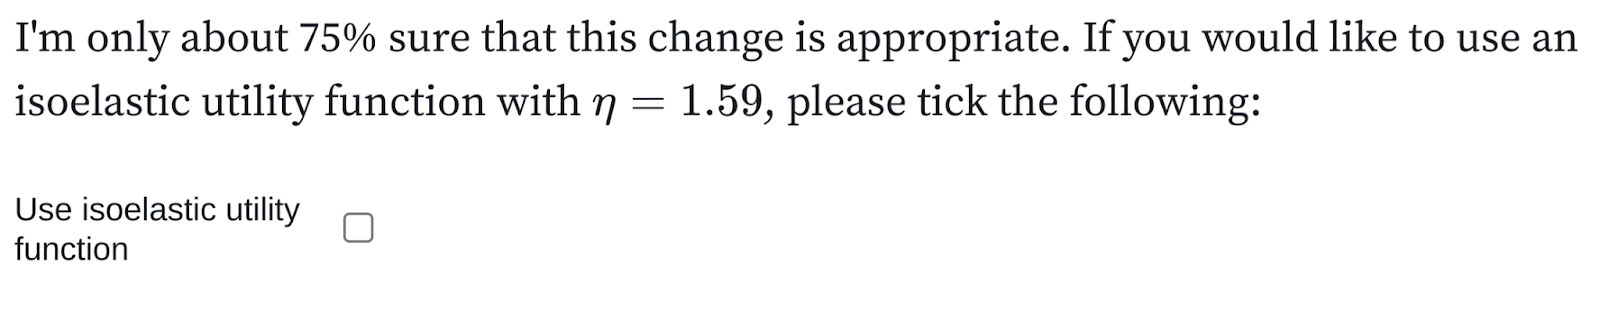
You can edit and interact with squiggle notebooks to change different parts of the analysis. For example, I use this to create variants of the notebook that can be enabled and disabled with checkboxes.
Interactive Squiggle notebooks. A checkbox that edits the model to use isoelastic utility.
Reasons not to use Squiggle
Do we need another platform?
Software is not always the solution to every problem! For example, Squiggle doesn't help with a lot of the main difficulties of modelling (constructing paths to impact or estimating parameters). I do agree with this to an extent. I was able to do this work because GiveWell has already done the heavy lifting for me in constructing their model's path to impact and estimating appropriate values of parameters. However, I think that pieces of information are much more accessible now that we have Squiggle Notebooks. The most obvious is measuring uncertainty.
One may also reply that if you wanted uncertainty, why not Causal or Guesstimate? In honesty, I could complete all of the research outcomes listed here with either of these two platforms. However, I see possibilities that Squiggle can far exceed the capabilities of these two platforms, mainly through the use of functions and its flexibility as a custom DSL for estimation. This analysis did not use these features, but Ozzie discussed them in a past post on Squiggle.
Limited target audience
One of the arguments against Squiggle is that it has a limited target audience. We built the tool for people interested in calculating with uncertainty but do not want to use tools such as probabilistic programming languages (PPLs).
PPLs are tools that can do a lot more than Squiggle currently can, particularly inference. I haven't worked with many PPLs, but I have worked with Stan.
I believe Squiggle and PPLs have different use cases. I have worked to try and do the above work in Stan rather than Squiggle. The result is very far from glamorous. However, I am not proficient enough in PPLs to make that comparison.


Hello, thanks for this! Exciting to see more concrete estimates out of QURI!
I think your claims here (and the general conclusion) is a bit stronger than warranted. The analysis you link seems reasonably strong on a quick skim, but it is used for the UK:
The UK (GDP per capita: 40k) data seems very out-of-sample for Kenya (GDP per capita: 1.8k), Uganda (GDP per capita 0.8k), Rwanda, Liberia, Malawi, DRC, and Morocco. As is often the case with social science research, we should be skeptical of out-of-country and out-of-distribution generalizability.
So I'm not sure whether I should make a huge update in the direction of this data, and I think this uncertainty should be flagged more in your post.
___
Taking a step back, I do think it's plausible that the first doubling of money creates more utility than the second doubling, and this generalizes reasonably well across multiple doublings. Firstly because there's no strong theoretical reason to prefer unity (prefer a doubling the same degree as disprefer a halving). And anecdotally, this matches my intutions. Certainly I personally feel like the difference between my material well-being now vs my childhood (consumption ~1 OOM more?) is not as different as the consumption between my childhood and that of the median person in Kenya (consumption another ~1 OOM more or so). But of course my own intuitions are pretty out-of-distribution here too!
That's true! η could easily be something other than 1.5. In London, it was found to be 1.5, in 20 OECD countries, it was found to be about 1.4. James Snowden assumes 1.59.
I could but don't represent eta with actual uncertainty! This could be an improvement.