Comments

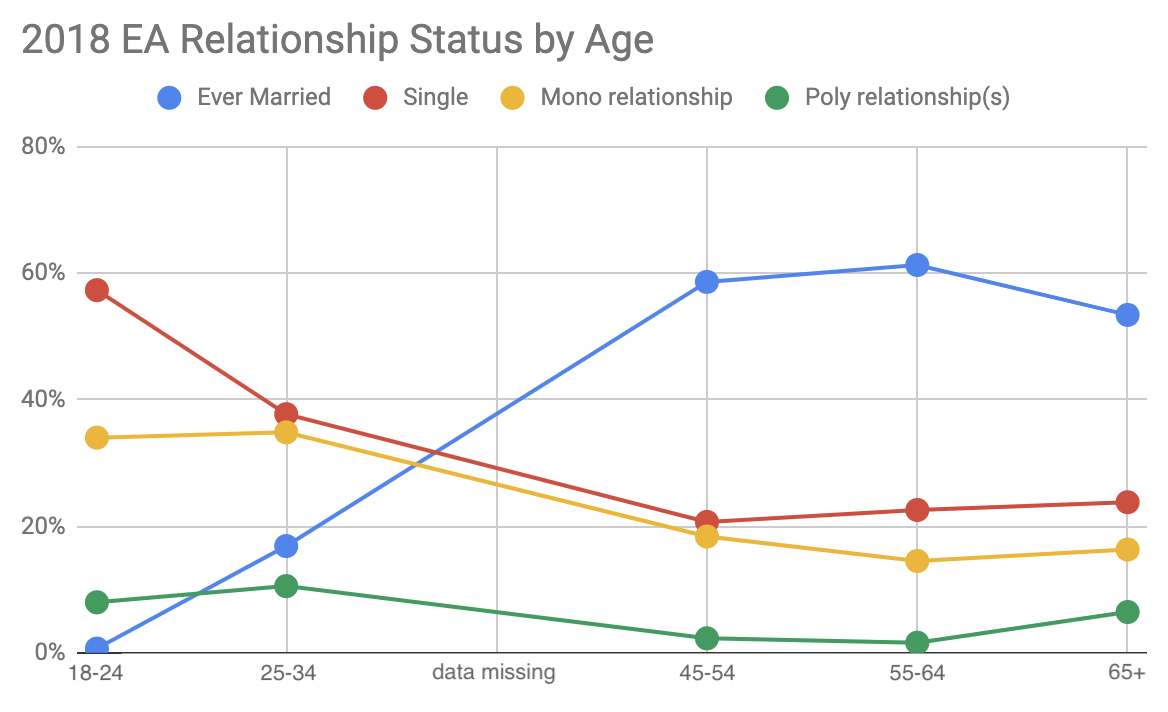
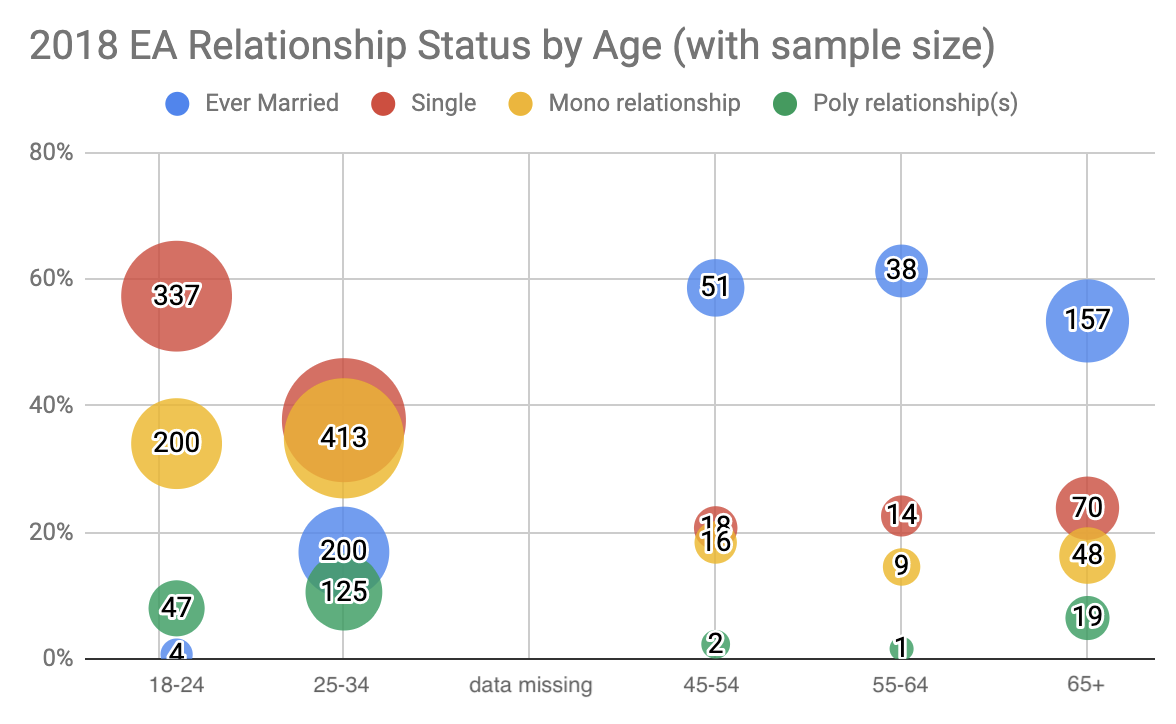
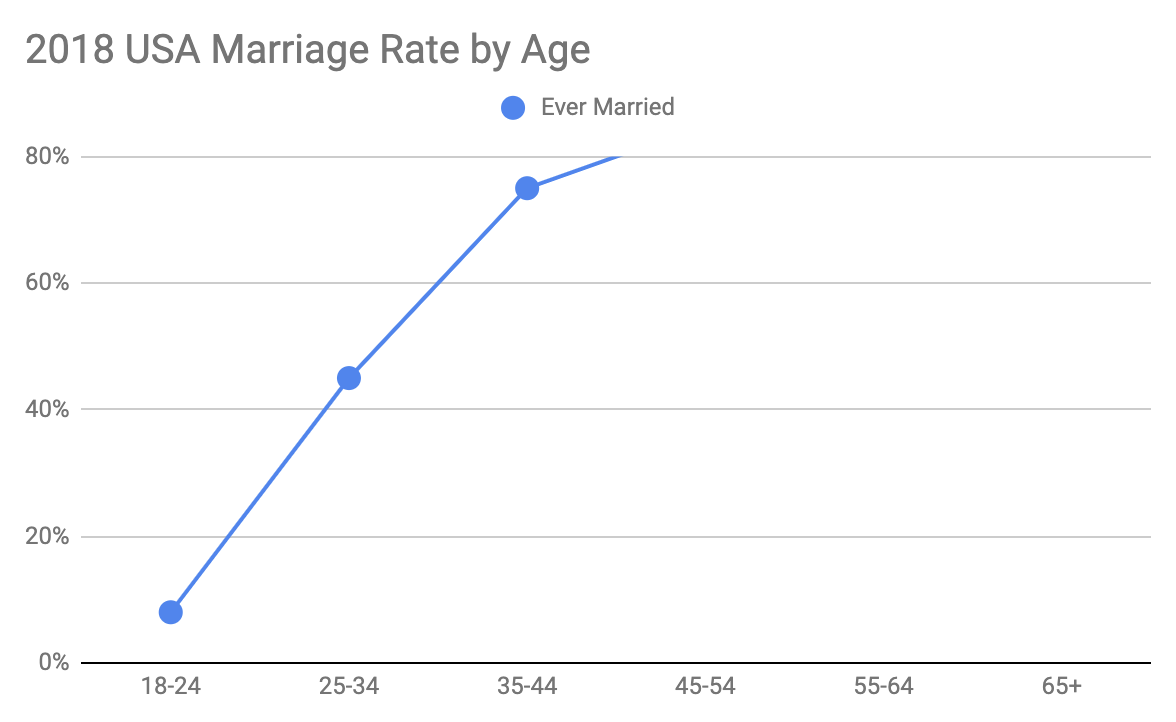
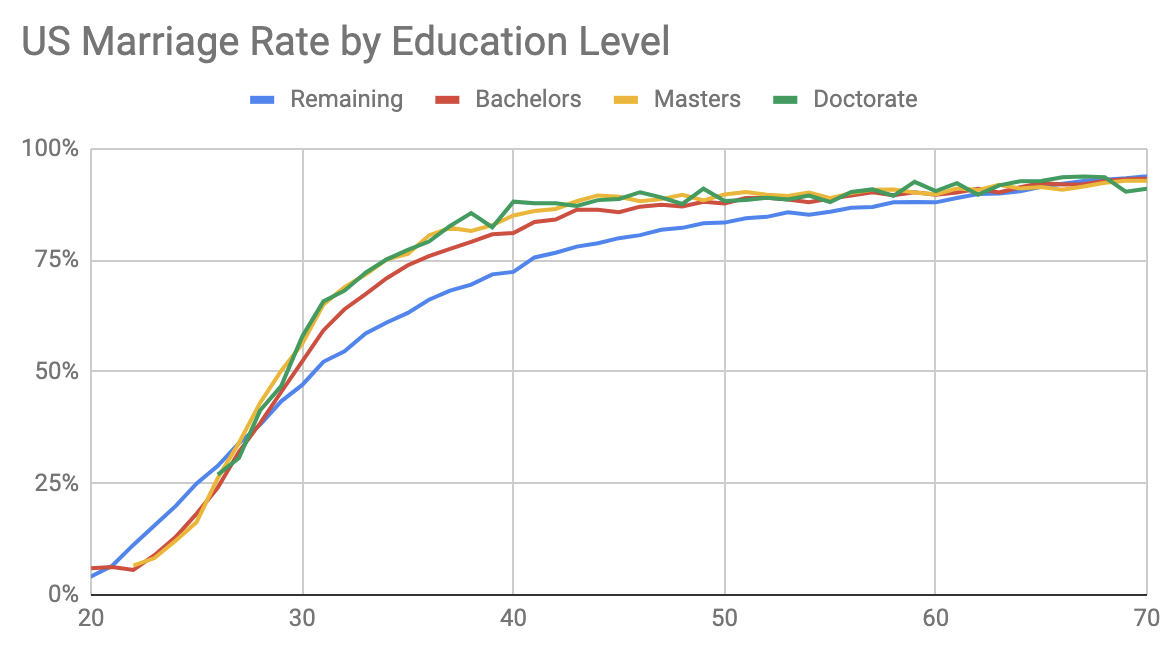
I think a big chunk of the discrepancy here comes from comparing against US expectations rather than a weighted average over countries.
Case in point, the 'ever married 25-34' stat (which is the one with biggest sample size) is
EA: 18%
US: 45%
UK: 22%
I can't find directly comparable stats for Australia, Canada or Germany - which make up the other major countries of the 2018 survey. What is available is age-at-first-marriage:
US: 29, UK: 33, DE: 33, AU: 32, CA: 31
Doing linear interpolation on the UK/US values, estimated ever-married 25-34 stats are
US: 45%, UK: 22%, DE: 22%, AU: 28%, CA: 34%
which, weighted by the survey fractions of .36/.16/.07/.06/.04 gives an expected ever-married 25-34 rate of 35%.
Some other things worth noting:
- EA is overwhelmingly male, and men marry a year or three later.
- Those fractions add up to .7; another .2 come from a scattering of countries that are largely European. Much of Europe has ages-of-first-marriage of 33 or more.
- The EA pop distribution inside the 25-34 bucket is going to lean towards the 25 end, while the national pop distributions are going to be even across it.
All in all I'd expect a properly-calibrated expected rate to be 25-30%-ish.
I'm also curious if the higher-education-higher-marriage-rate thing holds in the UK/Europe, but damned if I can find solid stats. Anecdotally it doesn't, but anecdotes are awful for this kind of thing. Sample bias'll kill you dead.
[This comment is no longer endorsed by its author]


It's a reasonable question. I take the observation to be that 60% of EAs over 45 have married, where we'd expect 85%.
I think a good hypothesis is religion. In general, 60% of atheists have married, versus 80% of the religiously-affiliated have, and ~55% of that effect persists after controlling for age (see the bottom two tables). 86% of EAs are non-religious. So almost half of the reason that EAs marry less is probably just that they're atheist/agnostic, so they don't think that cohabiting is living in sin!
The other half, well, I agree with your top two points - that EAs favour work over having kids. Apart from that, two guesses would be:
Given all the available explanations, I don't feel that surprised about the observation anymore.
FWIW, and without speaking for Jeff, for Denise and I the original observation was something like 'percentage of people in nesting relationships around our age range (25-30) anecdotally seems sharply different in our EA versus similar-demographic non-EA circles'.
I consider religion a weak explanation for that, since we're definitely counting cohabiting couples, but the observation is also less well-founded and I'm far from confident that it generalises across the community well.
I moderately think this is the wrong approach on the meta-level.
1. We observe a phenomenon where X demographic is less likely to exhibit Y characteristic.
2. You're coming up with a list of explanations (E1, E2, E3) to explain why X is less likely to have Y, and then stopping when the variance is sufficiently explained.
3. However this ignores that there might be reasons for why your prior should be does X is more likely to have Y.
And on the object level, I agree with the other commentators that EAs often draw from groups that are less, rather than more, likely to be single.
I agree that you should look at the things in order of the size of their prediction about the observation. But I think that a lot of the biggest effects would be in that direction.