A friend observed that fewer people in the effective altruism movement are married than you might expect. I was curious: what are marriage rates like within the EA community? The 2018 EA Survey asked about relationship status, and we can look at how that varies by age:
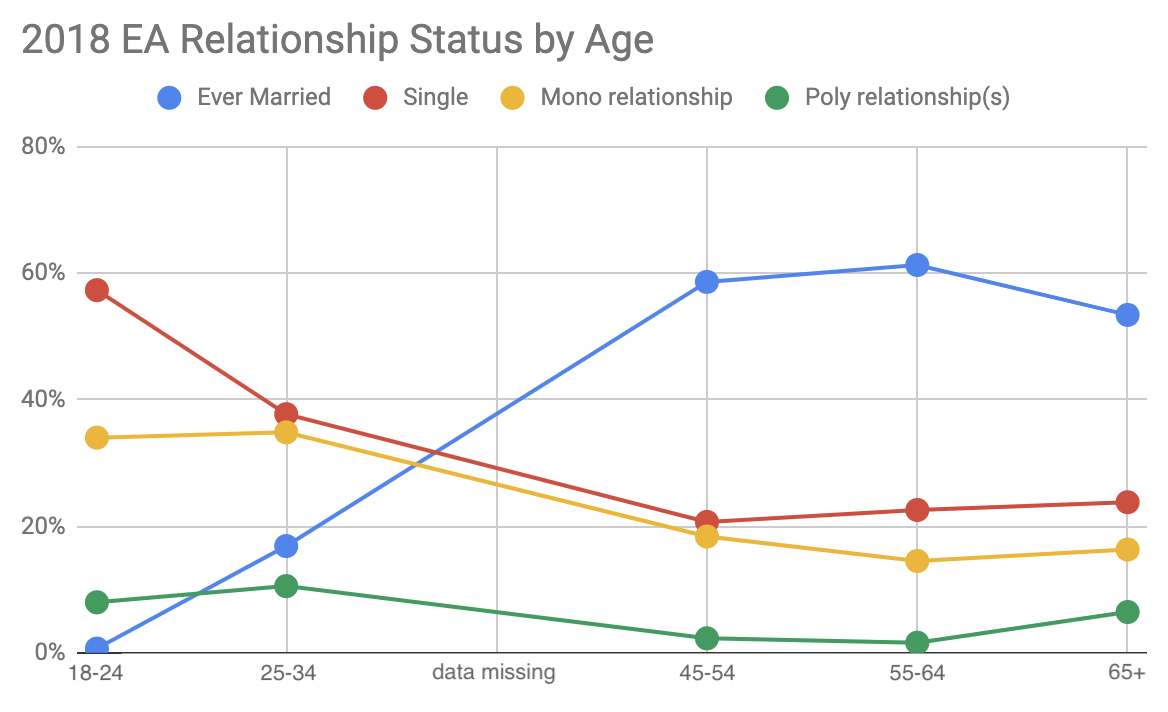
I'm using "ever married" for people who are currently married or have ever been married, including people who are now divorced, widowed, or separated. Since some of these buckets might be pretty small, let's add sample size information:
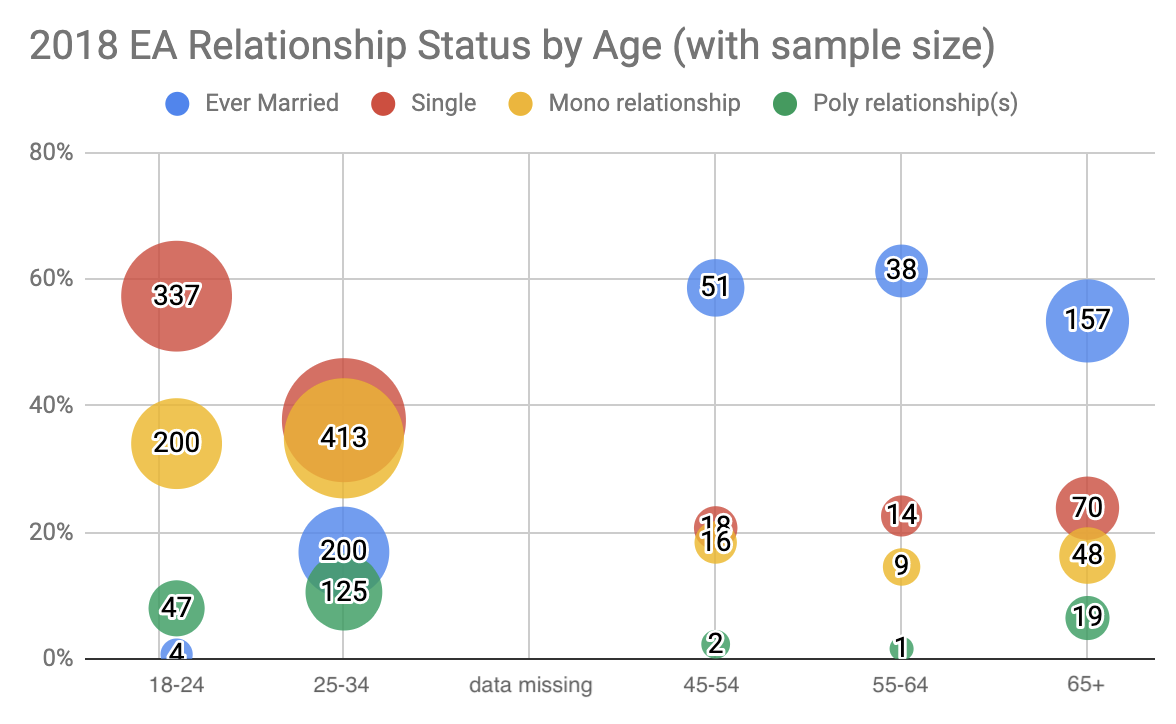
The anonymized survey data doesn't have 35-44 data, and the 65+ group looks suspiciously like it has the 35-44 group lumped in with it. I've filed a bug and if they fix it I'll update the post. For now, probably ignore the 65+ group.
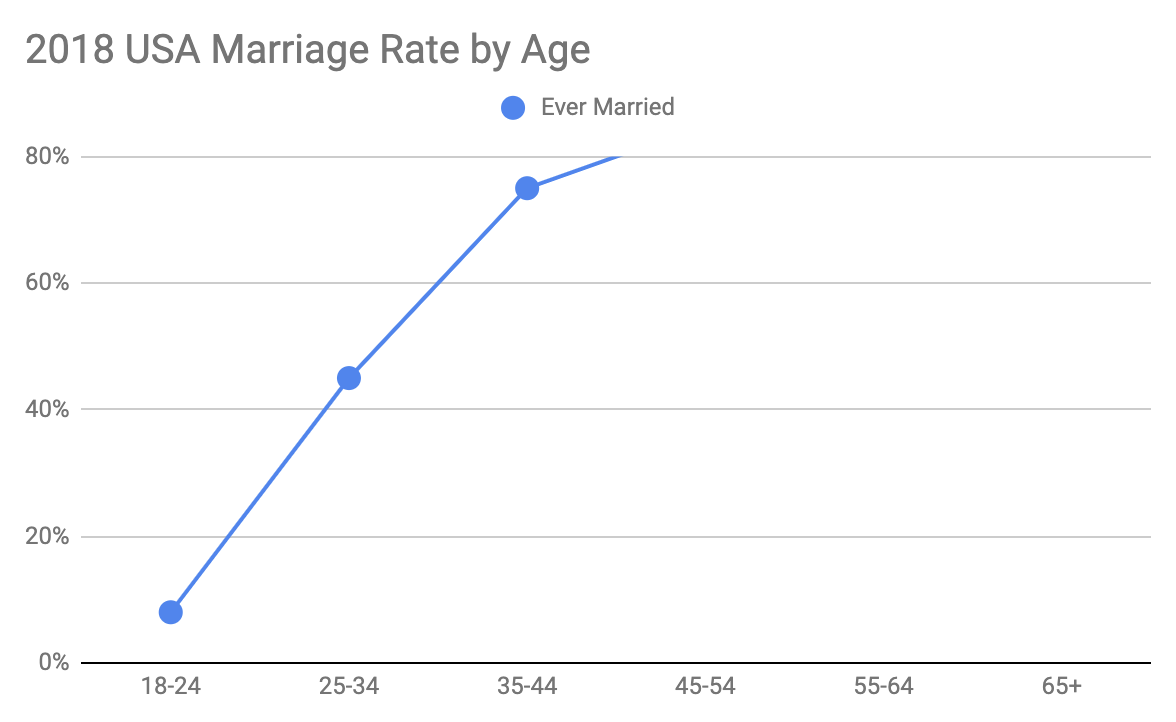
For comparison, here's 2018 ACS data (via) for US marriage rates, on the same scale:
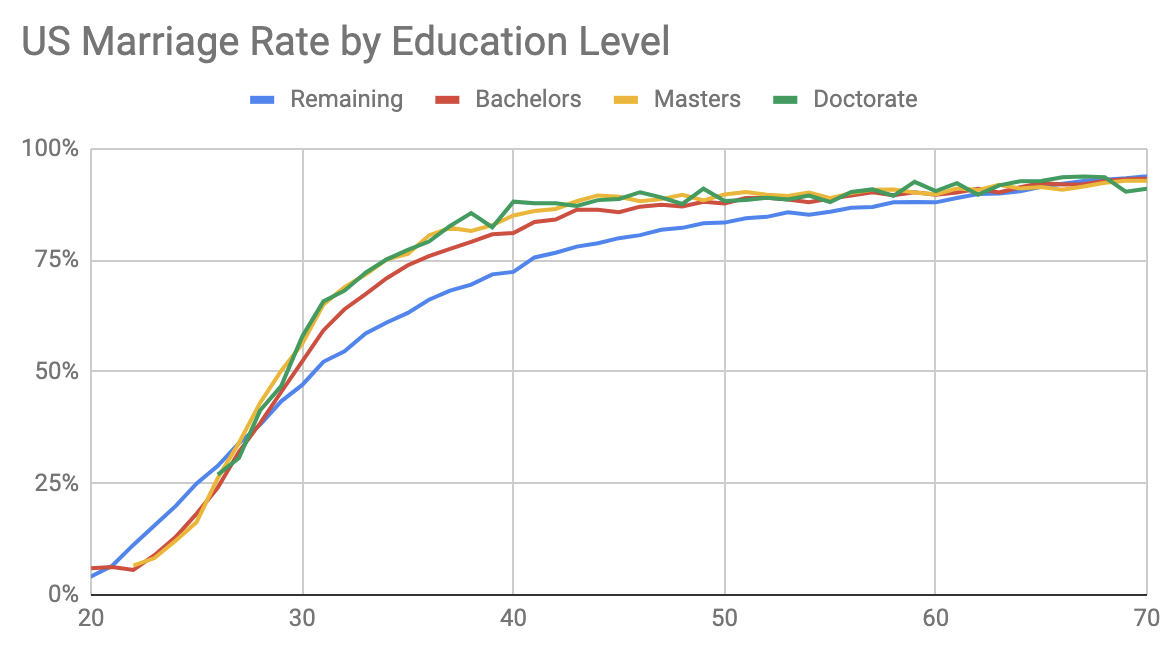
And, at least in the US, people with more education are more likely to be married, after age 28:
Now, EAs are not all American, and even then they're different from Americans as a whole in many ways other than being interested in effective altruism. On the other hand, when I look at what fraction of my (Swarthmore) college friends are married, a group similar to EAs in many ways, it's not far from the graph for the US at large. (And it's off in the positive direction). I see similar numbers by school for people who were 30-34 in 2014.
There does seem to be something real here. Some guesses as to why:
- EAs often highly prioritize their careers.
- EAs are generally less interested in having children.
- EAs are often poly.
- EAs often live in group houses.
- EAs are more willing to be weird; less likely to do something because it is the standard thing to do.
I had trouble finding the ever-married stat, so I went to the 2017 marriages dataset. Table 12 is 'Proportions of men and women who had ever married by certain ages', and for the 1984 men's cohort - the last one with complete data - the rates are 6% for 25yos through 39% for 34yos. The average over that age range is 22%.
So upfront, I didn't notice it was the mens' cohort. My bad, and I'll fix my post once I've figured out the other problem: these figures are decidedly inconsistent with the figures you've found. It's not obvious to me what the difference is.
First, momentary thought was I'd been totally daft and averaged married-this-year data. Second thought was that I'd averaged over birth-cohort rather than reporting year. But that gives 20%, an even lower figure. Third thought was that 'married by 34' is different from 'married at 34', but shifting the age range up a notch only gets the figure up to 26%.
Any ideas?