Comments
This is great! To my uncareful read, it does seem like this post underemphasizes that metaculus can do a better job of aggregating than the community prediction.
This is great! To my uncareful read, it does seem like this post underemphasizes that metaculus can do a better job of aggregating than the community prediction.
Thanks, JP Addison!
Note that, among all questions, Metaculus' predictions have a Brier score evaluated at all times of 0.122, which is only slightly lower than the 0.127 of Metaculus' community predictions. So overall there is not much difference, although there can be significant differences for certain categories (like for that of "artificial intelligence").
- Total belief movement (0.262; 0), i.e. predictions are less accurate for questions with a greater amount of updating. This is surprising, as one would expect predictions to converge to the truth as they are updated.
This is fascinating, at face value it would imply that the whole process of "updating", as practiced by the average metacalculus user, is useless and actually makes predictions worse. Another theory would be that people update more on topics they are interested in, but are more likely to have biases on those topics and therefore be more wrong overall. Any other explanations people can think of?
Is this just showing that the predictions were inaccurate before updating?
I think it's saying that predictions over the lifetime of the market are less accurate for questions where early forecasters disagreed a lot with later forecasters, compared to questions where early forecasters mostly agreed with later forecasters. Which sounds unsurprising.
Hi Dan,
I think that can be part of it. Just a note, I calculated the belief movement only for the 2nd half of the question lifetime to minimise the effect of inaccurate earlier predictions.
Another plausible explanation to me is that questions with greater updating are harder.
I expect the population of users will have similar propensity to update on most questions. The biggest reason for updating some questions more often is new facts emerging which cause changes of mind. This is a massive confounder here, since questions with ex ante surprising updates seem harder to predict almost by definition.
Yes, it seems like more uncertain and speculative questions with fewer available evidence would have larger swings in beliefs. So it's possible that updating does help, but not enough to overcome the difficulty of the problems. If this is what happened, the takeaway is that we should more be more skeptical of predictions that are more speculative and more uncertain, which makes sense.
I could see a way for updating to make predictions worse, if there was systematic bias in whether pro or anti proposition evidence is seen, or a bias in how pro or anti evidence is updated on. To pick an extreme example, if someone was trying to evaluate whether the earth was flat, but only considered evidence from flat earth websites, then higher amounts of updating would simply drag them further and further away from the truth. This could also explain why metacalculus is doing worse on AI prediction than other predictions, if there was a bias specifically in this field.
Great post. Really useful to know. Thank you for putting it together. May I ask, how many hours approximately did this piece of work take?
Hi David,
Thanks! So far I have spent 35 h on it, including post-publication time (like addressing comments), but excluding some related background research I did (like reading Augenblick 2021).
Thank you so much for doing this! And especially for the recommendations such as looking at scores for similar questions (I am using your excellent sheet as a base for calculating these).
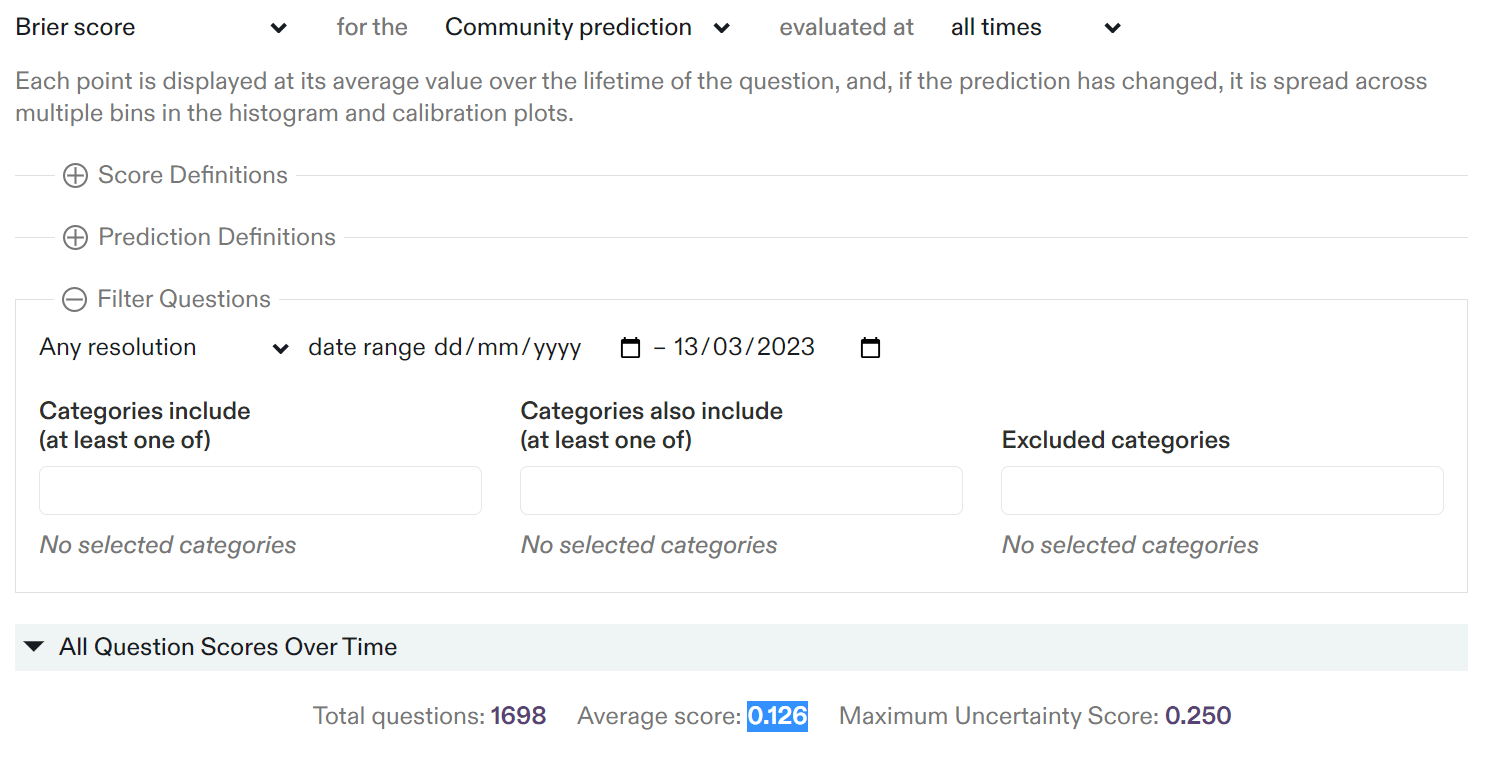
Has something changed radically since you did your work? I am asking because you wrote that Metaculus' track record page showed overall Brier of 0.126 (community) but when I look now, filtering for questions resolved up until mid March (my guess for when you looked at the numbers), I get the Metaculus track record web page to report a much lower 0.092. I have to set the date of resolution to ~mid March 2021 to get a score of 0.124, which is closer to what you reported.
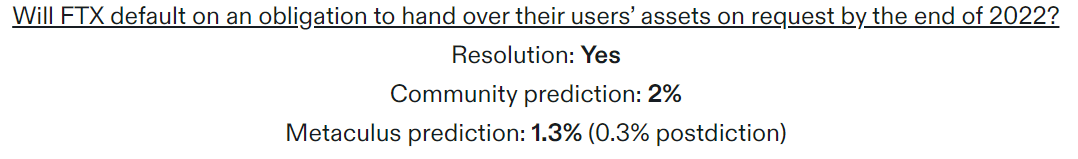
(A completely irrelevant fact I realized is that the worst performing question on Metaculus seems to be whether FTX would default - I am not sure it means something but it stood out sorely on that diagram and is a bit weird)
Thanks, Ulrik, I am glad you found it useful!
I am asking because you wrote that Metaculus' track record page showed overall Brier of 0.126 (community) but when I look now, filtering for questions resolved up until mid March (my guess for when you looked at the numbers), I get the Metaculus track record web page to report a much lower 0.092.
I think you forgot to select "all times" in the field "evaluated at". By default (when one opens the page), the questions are evaluated at resolution, which results in a lower Brier score. I get a Brier score of 0.126 when I set the latest resolution date to 13 March 2023 (on which I retrieved the data), and select "all times":
(A completely irrelevant fact I realized is that the worst performing question on Metaculus seems to be whether FTX would default - I am not sure it means something but it stood out sorely on that diagram and is a bit weird)
Interesting! That was indeed Metaculus' community worst prediction when assessed at resolution. For reference:
It probably means it is fair to say the FTX collapse was not entirely predictable! Incidently, the worst prediction assessed at all times also involves crypto:

Hi Vasco, I hope you do not mind two follow-up questions: Why does Metaculus default to "resolve time" when in your analysis you think it is better to present "all times"? And given my goal of using Metaculus, which "evaluated at" setting should I pick?
The first vibe I get from this is that Metaculus is cherry picking a method of evaluation that make their predictions look better than they are. But then I think that it cannot be that bad, the crew behind Metaculus seem really scientifically minded and high integrity. So I guess the reason for different methods is that they serve different purposes.
I then spent 10 minutes thinking about what the difference was, got a headache and thought I would ask you in case it takes you 2 minutes to respond or refer me to some online explanation.
My goal is to give "regular" (university educated and well read, but not spent time thinking about risks or forecasting) people confidence in Metaculus' ability to predict future catastrophes (>10% pop decline in <5 years) as well as the source of these (these types of questions). I want to demonstrate to people these are probably the best estimates available of what threats society and individuals are most likely to face in the coming decades and therefore a good way to think about how to build resilience against these threats.
Thanks again for your excellent work and for you patience with my questions.
Thanks for the follow-up questions!
Why does Metaculus default to "resolve time" when in your analysis you think it is better to present "all times"? And given my goal of using Metaculus, which "evaluated at" setting should I pick?
The Brier score evaluated at "all times" applies to the whole period during which the question was open. It is the mean Brier score, i.e. the one I would see if I selected a random time during which the question was open. I used it because it contains more information.
I think the setting one should pick depends on the context. If you are looking into:
I want to demonstrate to people these are probably the best estimates available of what threats society and individuals are most likely to face in the coming decades and therefore a good way to think about how to build resilience against these threats.
I think it is hard to know how reliable Metaculus' predictions will be with respect to these questions, as Metaculus' track record does not yet contain data about long-range questions. There are only 8 questions whose Brier can be evaluated 5 years prior to resolve time. For communicating risk to your audience, one could try to make a case for the possibility of the next few decades being wild (if Metaculus' nearterm predictions about AI are to be trusted), and the possibility of this being the most important century.
Thanks again for your excellent work and for you patience with my questions.
No worries; you are welcome!


Disclaimer: this is not a project from Arb Research.
Thanks to Charles Dillon, Misha Yagudin from Arb Research, Peter Mühlbacher, and Ryan Beck.

I really like Metaculus!
I believe it would be important to better understand how much to trust Metaculus’ predictions. To that end, I have determined in this Sheet (see tab “TOC”) metrics about all Metaculus’ questions outside of question groups with an ID from 1 to 15000 on 13 March 2023[4], and their Metaculus’ community predictions. The metrics for each question are:
Augenblick 2021 shows the total belief movement should match the total uncertainty reduction in expectation for Bayesian updating (see “Proposition 1”), in which case the total excess movement and normalised excess belief movement should be 0 and 1. I suppose Metaculus’ community predictions are less reliable early on. So, in the context of the metrics regarding belief movement and uncertainty reduction, I only analysed predictions concerning the 2nd half of the period during which each question was or has been open.
The Colab to extract the data and calculate the metrics is here[5].
The tables below have results for:
The results in the 2nd and 3rd tables for the other categories are in the Sheet.
Metric | Category | ||
|---|---|---|---|
Mean | 5th percentile | 95th percentile | |
| Number of questions | 64.8 | 3.00 | 179 |
| Number of resolved questions | 27.4 | 0 | 68.0 |
| Mean publish time (year) | 2020 | 2017 | 2022 |
| Mean close time (year) | 2039 | 2019 | 2077 |
| Mean resolve time (year) | 2062 | 2020 | 2161 |
| Mean time from publish to close (year) | 18.8 | 0.0530 | 56.2 |
| Mean time from close to resolve (year) | 23.0 | 2.04*10^-7 | 72.9 |
| Mean time from publish to resolve (year) | 41.8 | 0.159 | 141 |
| Mean number of forecasters | 82.1 | 23.5 | 166 |
| Mean number of predictions | 172 | 50.0 | 357 |
| Mean number of analysed dates | 86.5 | 56.4 | 104 |
| Mean total belief movement | 0.0191 | 2.15*10^-3 | 0.0461 |
| Mean total uncertainty reduction | 0.0130 | -0.0108 | 0.0491 |
| Mean total excess belief movement | 6.10*10^-3 | -0.0253 | 0.0394 |
| Mean normalised excess belief movement | -43.6 | -7.09 | 7.77 |
| Mean absolute value of normalised excess belief movement | 49.0 | 0.213 | 18.5 |
| Mean z-score for the null hypothesis that the beliefs are Bayesian | 0.103 | -0.711 | 0.811 |
| Mean p-value for the null hypothesis that the beliefs are Bayesian | 0.456 | 0.306 | 0.638 |
| Mean normalised outcome | 0.328 | 0 | 0.669 |
| Mean Brier score | 0.162 | 0.0367 | 0.300 |
Metric | Category | |
|---|---|---|
Any | Artificial intelligence | |
| Number of questions | 5,335 | 199 |
| Number of resolved questions | 2,337 | 50 |
| Mean publish time (year) | 2,021 | 2,020 |
| Mean close time (year) | 2,036 | 2,043 |
| Mean resolve time (year) | 2,048 | 2,050 |
| Mean time from publish to close (year) | 15.3 | 22.9 |
| Mean time from close to resolve (year) | 12.2 | 7.07 |
| Mean time from publish to resolve (year) | 27.6 | 30.0 |
| Mean number of forecasters | 88.2 | 104.5 |
| Mean number of predictions | 206 | 200 |
| Mean number of analysed dates | 90.4 | 91.0 |
| Mean total belief movement | 0.0238 | 0.0219 |
| Mean total uncertainty reduction | 0.0191 | 0.0144 |
| Mean total excess belief movement | 4.70*10^-3 | 7.53*10^-3 |
| Mean normalised excess belief movement | -43.1 | -3.92 |
| Mean absolute value of normalised excess belief movement | 47.2 | 5.52 |
| Mean z-score for the null hypothesis that the beliefs are Bayesian | -6.78*10^-3 | 0.105 |
| Mean p-value for the null hypothesis that the beliefs are Bayesian | 0.425 | 0.413 |
| Mean normalised outcome | 0.365 | 0.381 |
| Mean Brier score | 0.151 | 0.230 |
| Correlation between Brier score and... | Category | |||
|---|---|---|---|---|
Any (N = 1,374) | Artificial intelligence (N = 33) | |||
P-value for the null hypothesis that there is no correlation[3] | Correlation coefficient | P-value for the null hypothesis that there is no correlation | ||
| Publish time (year) | -0.143 | 9.82*10^-8 | 0.179 | 0.319 |
| Close time (year) | -0.117 | 1.40*10^-5 | 0.172 | 0.339 |
| Resolve time (year) | -0.146 | 5.68*10^-8 | 0.184 | 0.305 |
| Time from publish to close (year) | 0.0319 | 0.238 | 7.82*10^-3 | 0.966 |
| Time from close to resolve (year) | -0.0193 | 0.476 | 0.0341 | 0.850 |
| Time from publish to resolve (year) | 0.0102 | 0.705 | 0.0318 | 0.861 |
| Number of forecasters | -0.0776 | 4.02*10^-3 | 0.0680 | 0.707 |
| Number of predictions | -0.0366 | 0.175 | 0.316 | 0.0729 |
| Number of analysed dates | -0.107 | 6.57*10^-5 | 0.198 | 0.270 |
| Total belief movement | 0.262 | 0 | 0.282 | 0.111 |
| Total uncertainty reduction | -0.136 | 4.61*10^-7 | -0.150 | 0.405 |
| Total excess belief movement | 0.256 | 0 | 0.361 | 0.0387 |
| Normalised excess belief movement | -4.63*10^-3 | 0.864 | 0.0708 | 0.695 |
| Absolute value of normalised excess belief movement | 0.0893 | 9.17*10^-4 | 0.110 | 0.542 |
| Z-score for the null hypothesis that the beliefs are Bayesian | 0.346 | 0 | 0.241 | 0.176 |
| P-value for the null hypothesis that the beliefs are Bayesian | 0.0296 | 0.273 | -0.0269 | 0.882 |
| Normalised outcome | 0.102 | 1.60*10^-4 | 0.112 | 0.535 |
The mean metrics vary a lot across categories. For example, the 5th and 95th percentiles of the mean normalised outcome are 0 and 0.669, and of the mean Brier score are 0.0367 and 0.300.
I computed mean normalised excess belief movements of -43.1 and -3.92 for all questions and those of the category of artificial intelligence, but these are not statistically significant, as the mean p-values are 0.425 and 0.413. So it is not possible to reject Bayesian updating for Metaculus’ community predictions during the 2nd half of the period during which each question was or has been open. To contextualise, Table III of Augenblick 2021 presents normalised excess belief movements pretty close to 1 (and the p-values for the null hypothesis of Bayesian updating are all lower than 0.001):
I estimated mean normalised outcomes of 0.365 and 0.381 for all questions and those of the category of artificial intelligence. If we assume these values apply to questions about both probabilities and expectations:
I got mean Brier scores of 0.151 and 0.230 for all questions and those of the category of artificial intelligence, which are 19.5 % higher and 2.86 % lower than the mean Brier scores of 0.126 and 0.237 shown in Metaculus’ track record page[6]. I believe the differences are explained by my results:
I think the 1st of these considerations is much more important than the 2nd. The category of artificial intelligence does not include probabilistic group questions, so it is only affected by the 2nd consideration, and the discrepancy is much smaller than for all questions (2.86 % < 19.5 %).
In any case, according to Metaculus’ track record page, Metaculus’ community predictions for questions of the category of artificial intelligence perform close to randomly, as 0.237 is pretty close to 0.25. However, Metaculus’ predictions and postdictions[9] for the same category perform considerably better, with mean Brier scores of 0.168 and 0.146. These are also lower than the mean Brier score of 0.232 achieved for predictions matching the mean outcome of 0.365[10] for probabilistic questions of the category of artificial intelligence[11]. In addition, I should note Metaculus’ predictions for the category of AI and machine learning have a mean Brier score of 0.149 (< 0.168).
In contrast, among all questions, the mean Brier score of Metaculus’ community predictions of 0.126 is similar to that of 0.120 for Metaculus’ predictions. So, overall, Metaculus’ community predictions perform roughly as well as Metaculus’ predictions, although there can be important differences between them within categories, as illustrated above for the category of artificial intelligence.
It would also be nice to see the mean accuracy of the predictions of questions about expectations, but I have not done that here.
The 3 metrics which correlate more strongly with the Brier score are, listed by descending strength of the correlation (correlation coefficient; p-value):
The correlations with the normalised excess belief movement are weak (correlation coefficients of -4.63*10^-3 and 0.0708), and not statistically significant (p-values of 0.864 and 0.695). So it is not possible to reject (the null hypothesis) that there is no correlation between accuracy and Bayesian updating, but the correlation I obtained is quite weak anyways.
Comparing the correlations for all questions and those of the category of artificial intelligence shows one should not extrapolate the results from all questions to each of the categories. The signs of the correlations are different for 52.9 % (= 9/17) of the metrics, although some of those of the category of artificial intelligence are not statistically significant. I guess the same applies to other categories. Feel free to check the correlations among metrics for each of the categories in tab “Correlations among metrics within categories”, selecting the category in the drop-down at the top.
Finally, correlations with accuracy for questions about expectations may differ from the ones I have discussed above for ones about probabilities.
If you want to know how much to trust a given prediction from Metaculus, I think it is sensible to check Metaculus’ track record for similar past questions:
I am glad Metaculus has made available all these options, and I really appreciate the transparency!
I define the normalised outcome such that it ranges from 0 to 1 for questions about expectations, such that its lower and upper bound match the possible outcomes for probabilities.
The Brier score does not apply to expectations.
All p-values of 0 I present here are actually positive, but are so small they were rounded to 0 in Sheets.
The pages of Metaculus’ questions have the format “https://www.metaculus.com/questions/ID/”.
The running time is about 20 min.
To see the 1st of these Brier scores, you have to select “Brier score”, for the “community prediction”, evaluated at “all times”. To see the 2nd, you have to additionally click on “Show filter”, and select “Artificial intelligence” below “Categories include”.
Metaculus considers all predictions, which are not uniformly distributed in time (unlike the ones I retrieved), and therefore have different weights in the mean Brier score.
The mean number of analysed dates is 43.9 % (= 90.4/206) of the mean number of predictions.
From here, Metaculus’ postdictions refer to “what our [Metaculus’] current algorithm would have predicted if it and its calibration data were available at the question's close”.
Mean of column T of tab “Metrics by question” for the questions of the category of artificial intelligence with normalised outcome of 0 or 1.
0.232 = 0.365*(1 - 0.365)^2 + (1 - 0.365)*(0.365)^2.
Some p-values are so small that they were rounded to 0 in Sheets.
What would the brier score be if it involved forecasts significantly far removed from the event (6 months, 1 year, 2 years let's say?)
Hi Gideon,
The mean Brier scores of Metaculus' predictions (and Metaculus' community predictions) are (from here):
Note:
Thanks for this. What does this data further out from resolution look like for community predictions?
You are welcome, and thanks for the follow-up question! I have added the community predictions inside parentheses above. I have also added a new bullet commenting on the community predictions for AI.