In 2019, Open Philanthropy commissioned a set of forecasts on AI progress from Metaculus. The forecasting questions had time horizons between 6 months and >6 years. As of June 2023, 69 of the 111 questions had been resolved unambiguously. In this post, I analyze the accuracy of these forecasts as a function of question (sub)category, crowd size, and forecasting horizon. Unless otherwise indicated, my analyses are about Metaculus’ proprietary aggregate forecast (“the Metaculus prediction”) evaluated at the time the question closed.
Feel free to skip to the next section if you’re already familiar with these analyses.
- This analysis published 2 years ago (July 2021) looked at 64 resolved AI questions and concluded there was weak but ultimately inconclusive evidence of bias towards faster progress.
- A more recent analysis from March 2023 found that Metaculus had a worse Brier score on (some) AI questions than on average across all questions and presented a few behavioral correlates of accuracy within AI questions, e.g. accuracy was poorer on questions with more updates and when those updates were less informative in a certain technical sense (see post for details).
- Metaculus responded to the previous post with a more comprehensive analysis that included all resolved AI questions (152 in total, 64 of which were binary and 88 continuous). They show that performance is significantly better than chance for both question types and marginally better than was claimed in the previous analysis (which relied on a smaller sample of questions), though still worse than the average for all questions on the site.
The analysis I present below has some overlaps with those three but it fills an important gap by studying whether there’s systematic over- or under-optimism in Metaculus’s AI progress predictions using data from a fairly recent tournament that had monetary incentives and thus (presumably) should’ve resulted in more careful forecasts.
Key takeaways
NB: These results haven’t been thoroughly vetted by anyone else. The conclusions I draw represent my views, not Open Phil’s.
- Progress on benchmarks was underestimated, while progress on other proxies (compute, bibliometric indicators, and, to a lesser extent, economic indicators) was overestimated. [more]
- This is consistent with a picture where AI progresses surprisingly rapidly on well-defined benchmarks but the attention it receives and its “real world” impact fail to keep up with performance on said benchmarks.
- However, I see a few problems with this picture:
- It’s unclear to me how some of the non-benchmark proxies are relevant to AI progress, e.g.
- The TOP500 compute benchmark is mostly about supercomputers that (AFAICT) are mostly used to run numerical simulations, not to accelerate AI training and inference. In fact, some of the top performers don’t even have GPUs.
- The number of new preprints in certain ML subfields over short (~6-month) time horizons may be more dependent on conference publication cycles than underlying growth.
- Most of these forecasts came due before or very soon after the release of ChatGPT and GPT-4 / Bing, a time that felt qualitatively different from where we are today.
- Metaculus narrowly beats chance and performs worse in this tournament than on average across all continuous questions on the site despite the prize money. This could indicate that these questions are inherently harder, or that they drove less or lower-quality engagement. [more]
- There’s no strong evidence that performance was significantly worse on questions with longer horizons (<1 year vs ~2 years). [more]
- I see no clear pattern behind the biggest misses, but I provide plausible post-mortems for some of them. [more]
Results
All calculations are in this spreadsheet and this notebook. If you find something is wrong or missing, please let me know.
On bias
Does Metaculus over- or underestimate AI progress?
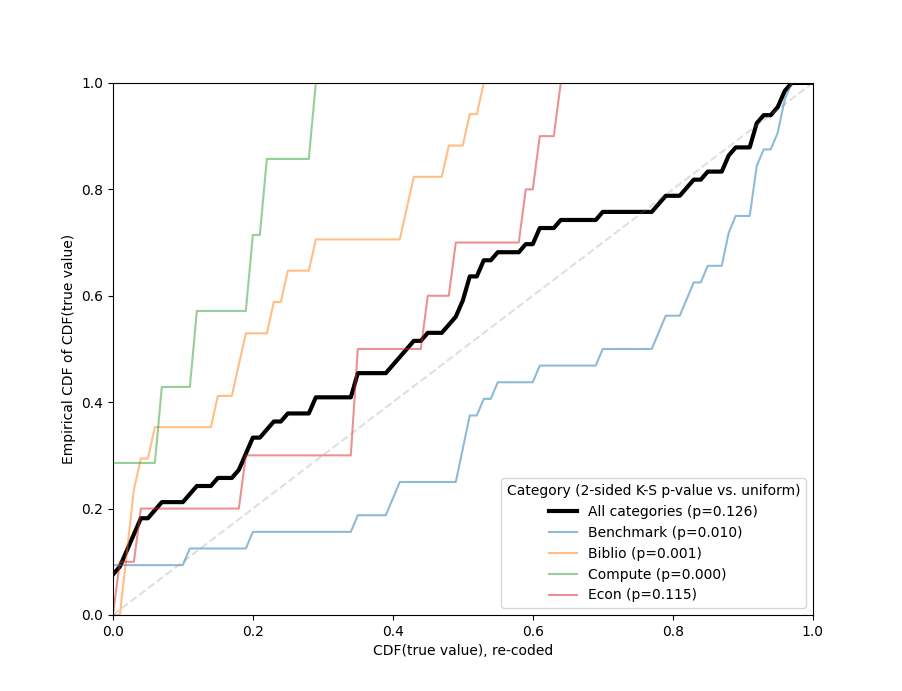
- Pooling all tournament questions together, there’s no evidence of bias: the CDF of the Metaculus prediction at close time evaluated at the true value is uniformly distributed, as expected for an unbiased predictor.
- However, this picture changes if we break down the data by question category:
- Progress on benchmarks was underestimated.
- Progress on compute and number of relevant publications was overestimated.
- Predictions about economic indicators were also slightly overestimated, although consistent with no bias at any conventional significance threshold.
- The difference in “optimism” between benchmarks and the other three categories was significant [EDIT: perhaps with the exception of economics, see footnote].
On accuracy
- Did Metaculus outperform chance?
- The average log score at question close was 0.701 (Median: 0.868, IQR: [-0.165, 1.502]) compared to an average of 2.17 for all resolved continuous questions on Metaculus.
- About 70% of the predictions at question close had a positive log score, i.e. they were better than predicting a maximally uncertain uniform distribution over the relevant range (chance level).
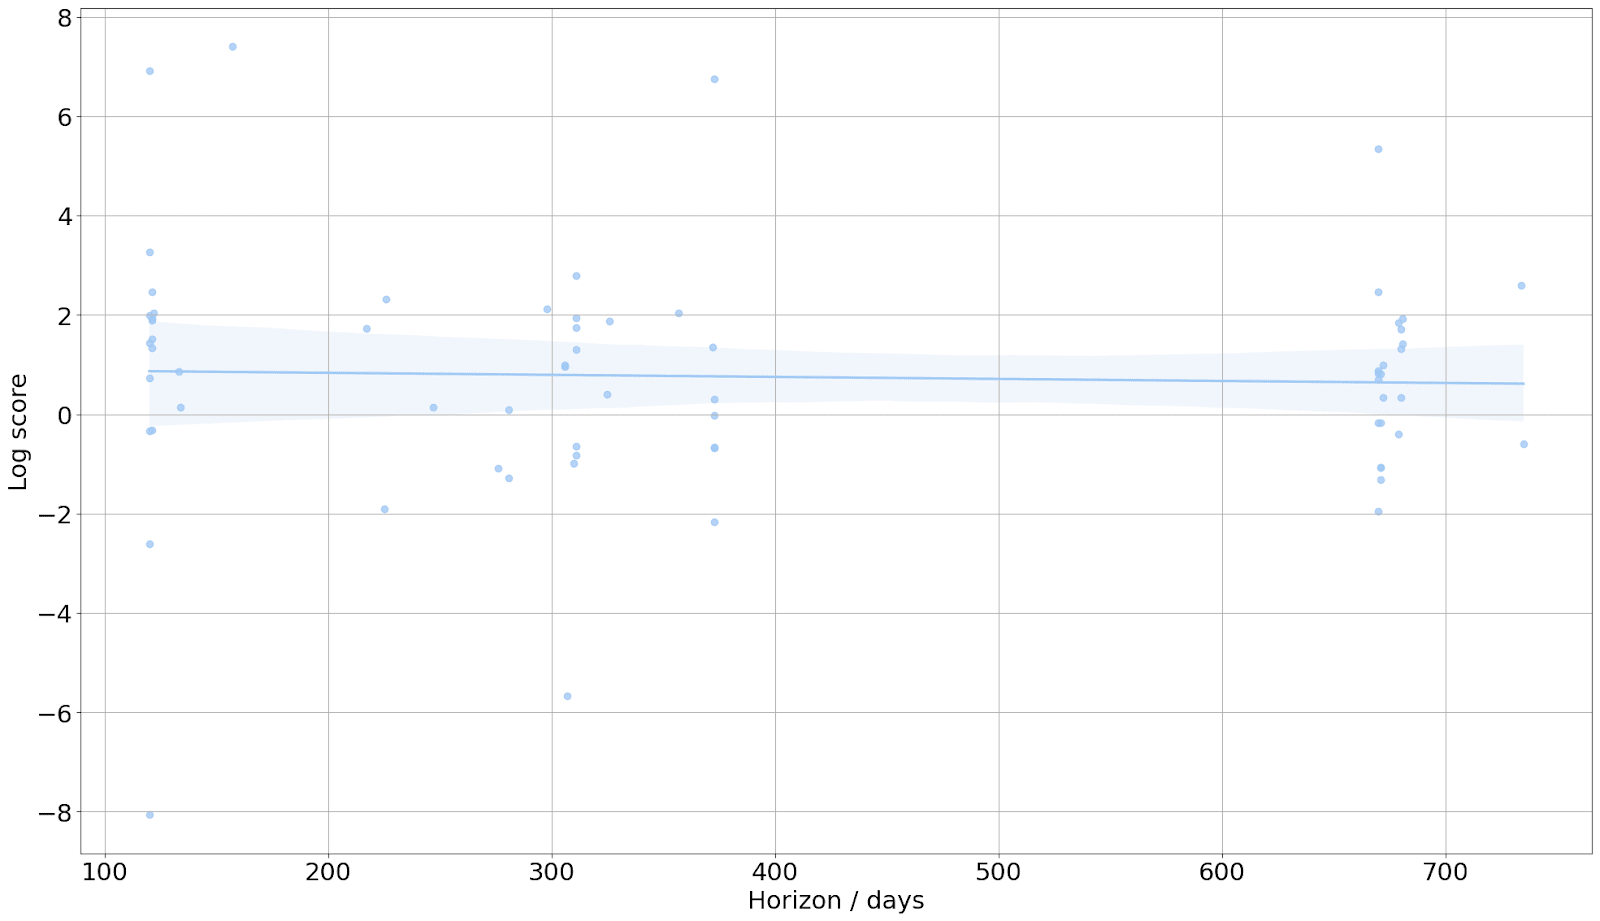
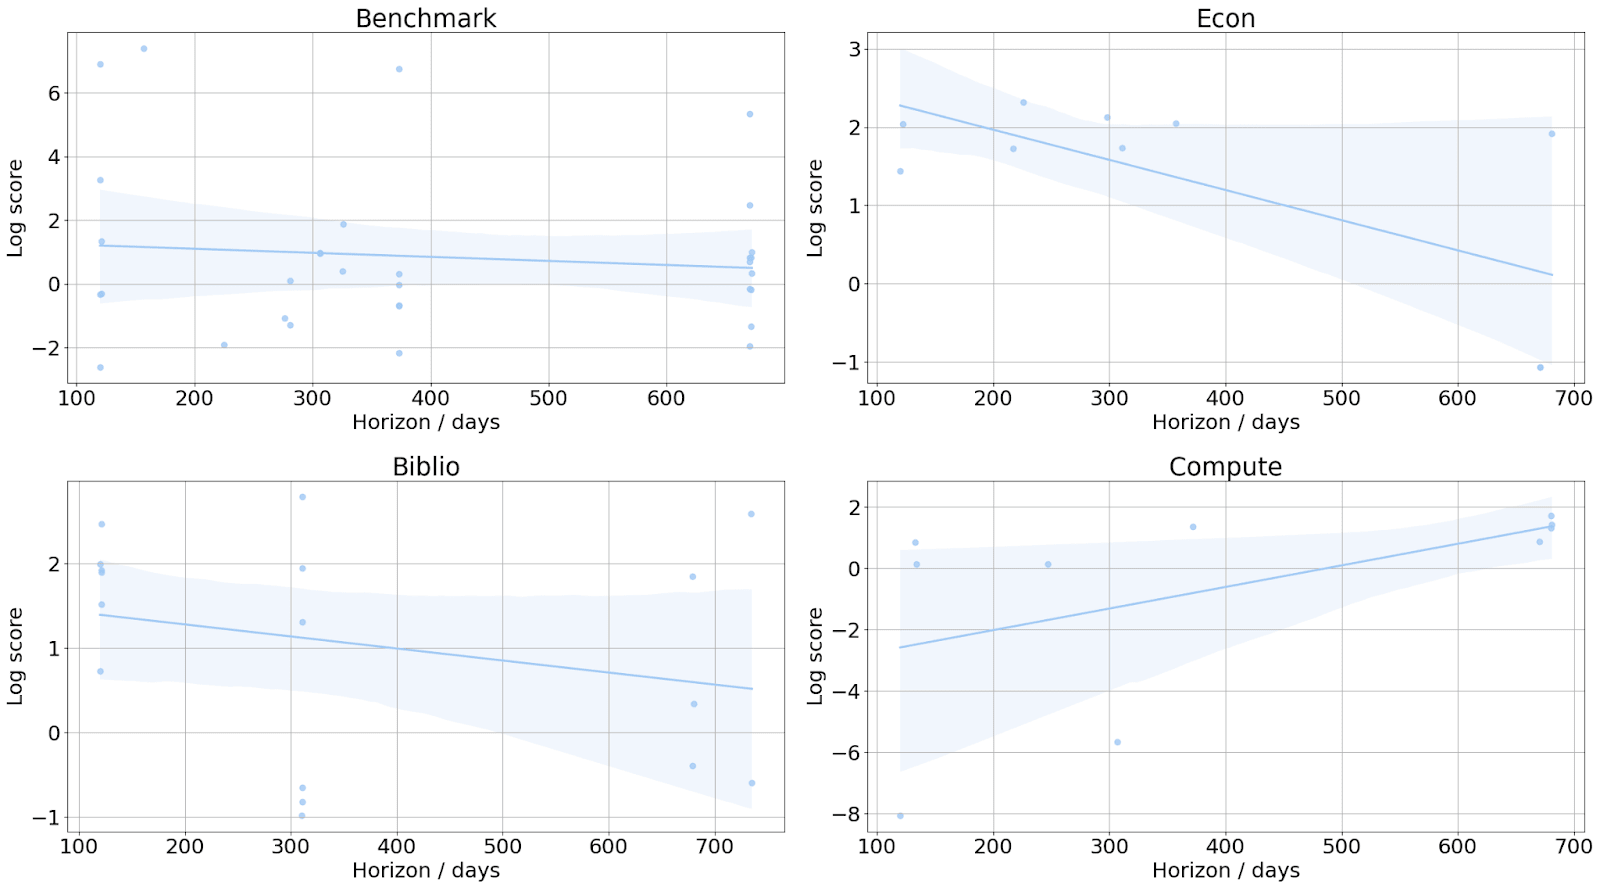
- Does accuracy change as a function of time until resolution?
- The log score of the Metaculus prediction at question close didn’t change as a function of the prediction horizon, i.e. the time elapsed between question close and resolution. The result doesn’t change after controlling for question category.
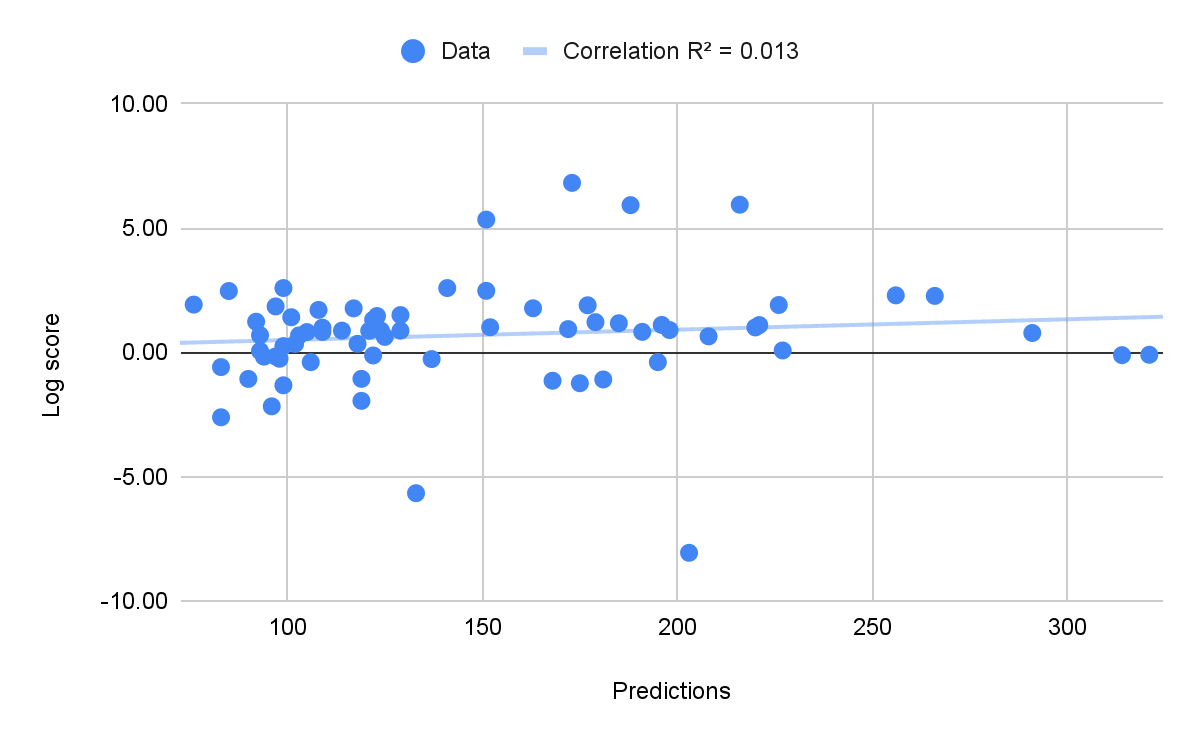
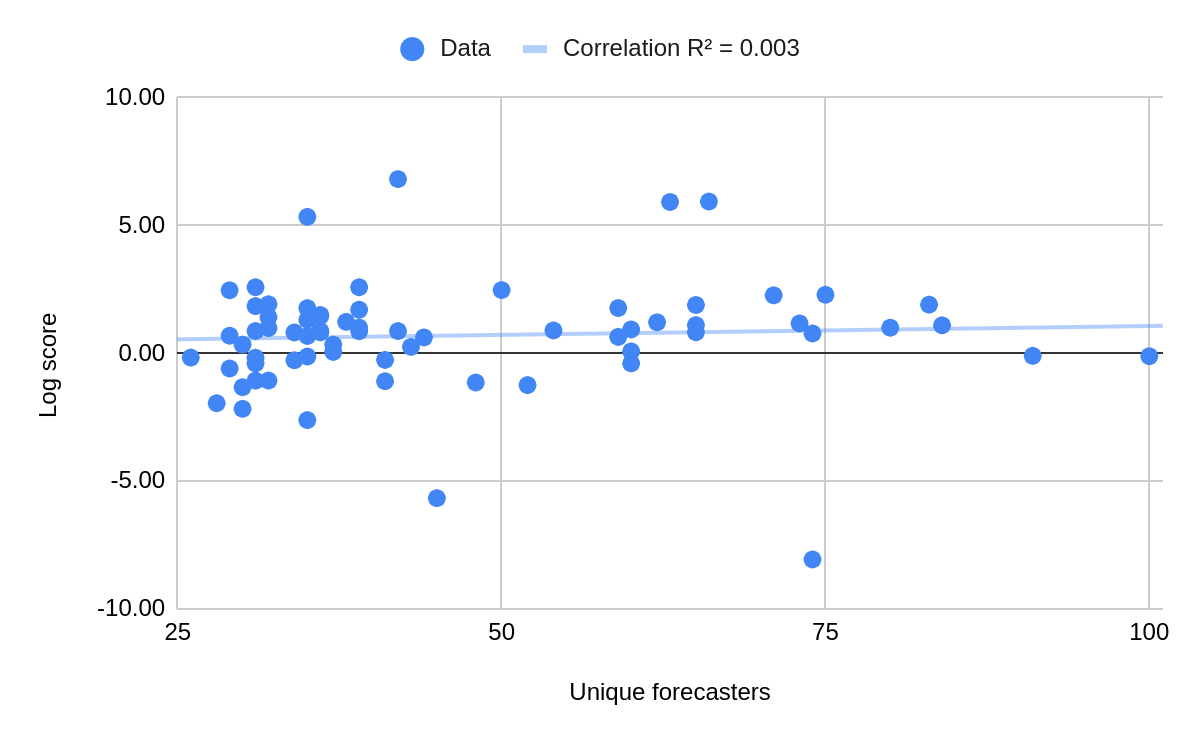
- Does accuracy improve with more forecasts or unique forecasters?
- Log score at close time was not correlated with the number of predictions or the number of unique forecasters on the relevant question.
- This is in mild tension with this other result that looked at a larger subset of Metaculus questions, and with the broader literature on the wisdom of the crowds. However,
- As noted by the author, the Metaculus analysis is probably confounded by time affecting both the number of people who’ve forecasted on the question and the information available to make those forecasts.
- The range of unique forecasters in our dataset (25-100) is probably past the point of vanishingly low diminishing returns.
 Some narrative speculations
- What were the biggest surprises? Were they near misses?
- The biggest surprises were questions about compute, economic indicators, and SOTA performance on text and image benchmarks. I don’t see an obvious common cause behind them. I added narrative speculations in the notes column of the spreadsheet for the top 10 misses.
- I don’t think these were near misses. None of them felt like “a paper came out just the day before resolution and it blew the SOTA out of the water”.
- Overoptimistic forecasts were very much so, i.e. when a forecast was too bullish it was more likely that the true value ended up below the 10th percentile of the CDF than between 10% and 50%.
Appendix: Comparison with previous tournament
In late 2019 and early 2020, Metaculus ran a series of questions about AI progress on a separate subdomain. These questions were not published to the top domain. Of the 34 questions that have been resolved, 23 were binary and 11 were continuous.
The people making predictions on these questions were a mix of top Metaculus forecasters and AI safety experts. How well did they do?
- Their average log score on continuous questions was 1.766 vs 0.701 in the AI progress tournament. Their average log score on binary questions was 0.246.
- There was no evidence of bias in their predictions – this is true of both continuous and binary questions. The number of questions is too small to draw any meaningful conclusions about bias broken down by category.
- There was very weak evidence of underconfidence on binary questions.
Thanks to Joshua Blake, David Manheim, Luke Muehlhauser, and Jaime Sevilla for helpful feedback, and to Britney Budiman for editing and formatting support. All errors are mine.
Special thanks to Peter Mühlbacher for catching some errors post-publication.

Disclaimer: I work for Metaculus.
Thanks for carefully looking into this @Javier Prieto, this looks very interesting! I'm particularly intrigued by identifying different biases for different categories and wondered how much weight you'd put on this being a statistical artefact vs a real, persistent bias that you would continue to worry about. Concretely, if we waited until a comparable number of AI benchmark progress questions, say, resolved, what would your P(Metaculus is underconfident on AI benchmark progress again) be? (Looking only at the new questions.)
Some minor comments:
I think the author knows what's going on here, but it may invite misunderstanding. This notion of "being better than predicting a […] uniform distribution" implies that a perfect forecast on the sum of two independent dice is "better than predicting a uniform distribution" only 2 out of 3 times, i.e. less than 70% of the time! (The probabilities for D_1+D_2 = 2,3,4,10,11, or 12 are all smaller than 1/#{possible outcomes}.)
Given that quite a lot of these AI questions closed over a year before resolution, which is rather atypical for Metaculus, comparing log scores at question close seems a bit unfair. I think time-averaged scores would be more informative. (I reckon they'd produce a quantitatively different, albeit qualitatively similar picture.)
This also goes back to "Metaculus narrowly beats chance": We tried to argue why we believe that this isn't as narrow as others made it out to be (for reasonable definitions of "narrow") here.
Thanks, Peter!
To your questions: