Comments
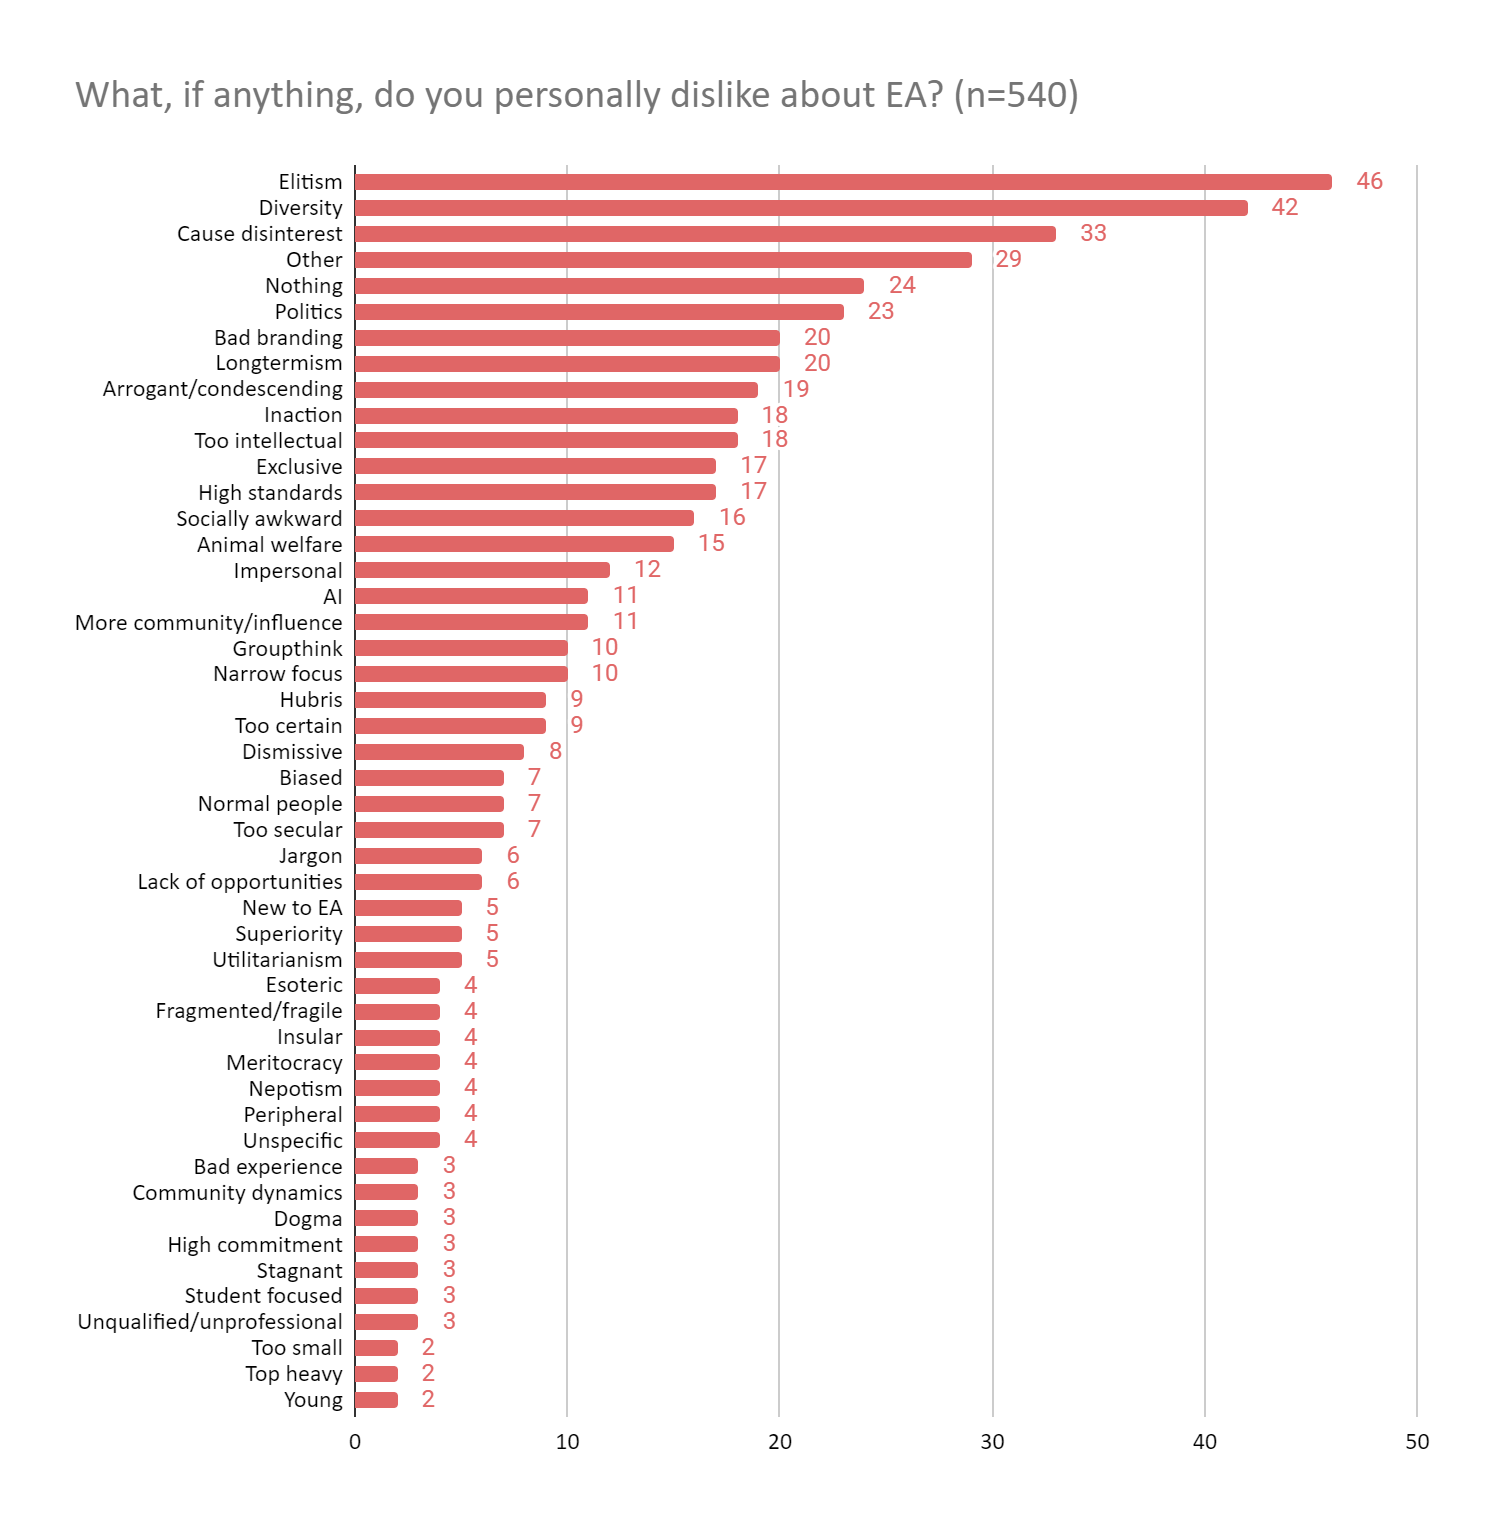
For the question "What if anything do your personally dislike about EA?" what does "politics" refer to exactly?
Also, I assume that each respondent was only able to submit 1 thing each. Is that correct?
For the question "What if anything do your personally dislike about EA?" what does "politics" refer to exactly?
Also, I assume that each respondent was only able to submit 1 thing each. Is that correct?
Thanks for asking.
"Politics" included responses saying that EA was too woke/left and too capitalist (roughly twice as many in the former camp as the latter, but these are very small numbers so that ratio is inexact), and a very small number of mentions of too much politics, too little politics.
For this question, people could mention any number of things in principle, i.e. they could write literally anything they wanted, but each response was only coded as representing a single category that was thought to best reflect that comment.
Thanks David this is very helpful!
Also, under the "Why did you give the two ratings above?" what does "more community/influence" , "new to EA" and "peripheral" mean?
For "new to EA" and "peripheral": people would often say things like "I'm new to EA, so I don't really know" or "I'm only peripherally engaged with the community, so I don't really know" to explain their ratings.
"More community/influence" captured comments saying they wanted to EA community to do more, particularly involving becoming more of a community or a larger community or influencing people more.
RE: "More community/influence":
For becoming more of a community, it seems like this could be read as a negative (e.g. people don't feel welcome by the existing community, while the latter sounds quite positive - people are happy with the way the community influences and want more of it?
So I could imagine that might be reason for giving this factor both positive or negative rating
it seems like this could be read as a negative (e.g. people don't feel welcome by the existing community, while the latter sounds quite positive - people are happy with the way the community influences and want more of it?
A lot of the ratings/comments were ambivalent in this way. This was in response to the question "Why did you give the two ratings [1-10] above?" rather than something like "Why did you give a positive/negative rating?" A lot of comments, were of the form "The community is great, but it should do more..."
Mean satisfaction ratings for people within the "More community/influence" category were 7.255 and mean satisfaction ratings overall were 7.259 (i.e. very similar).
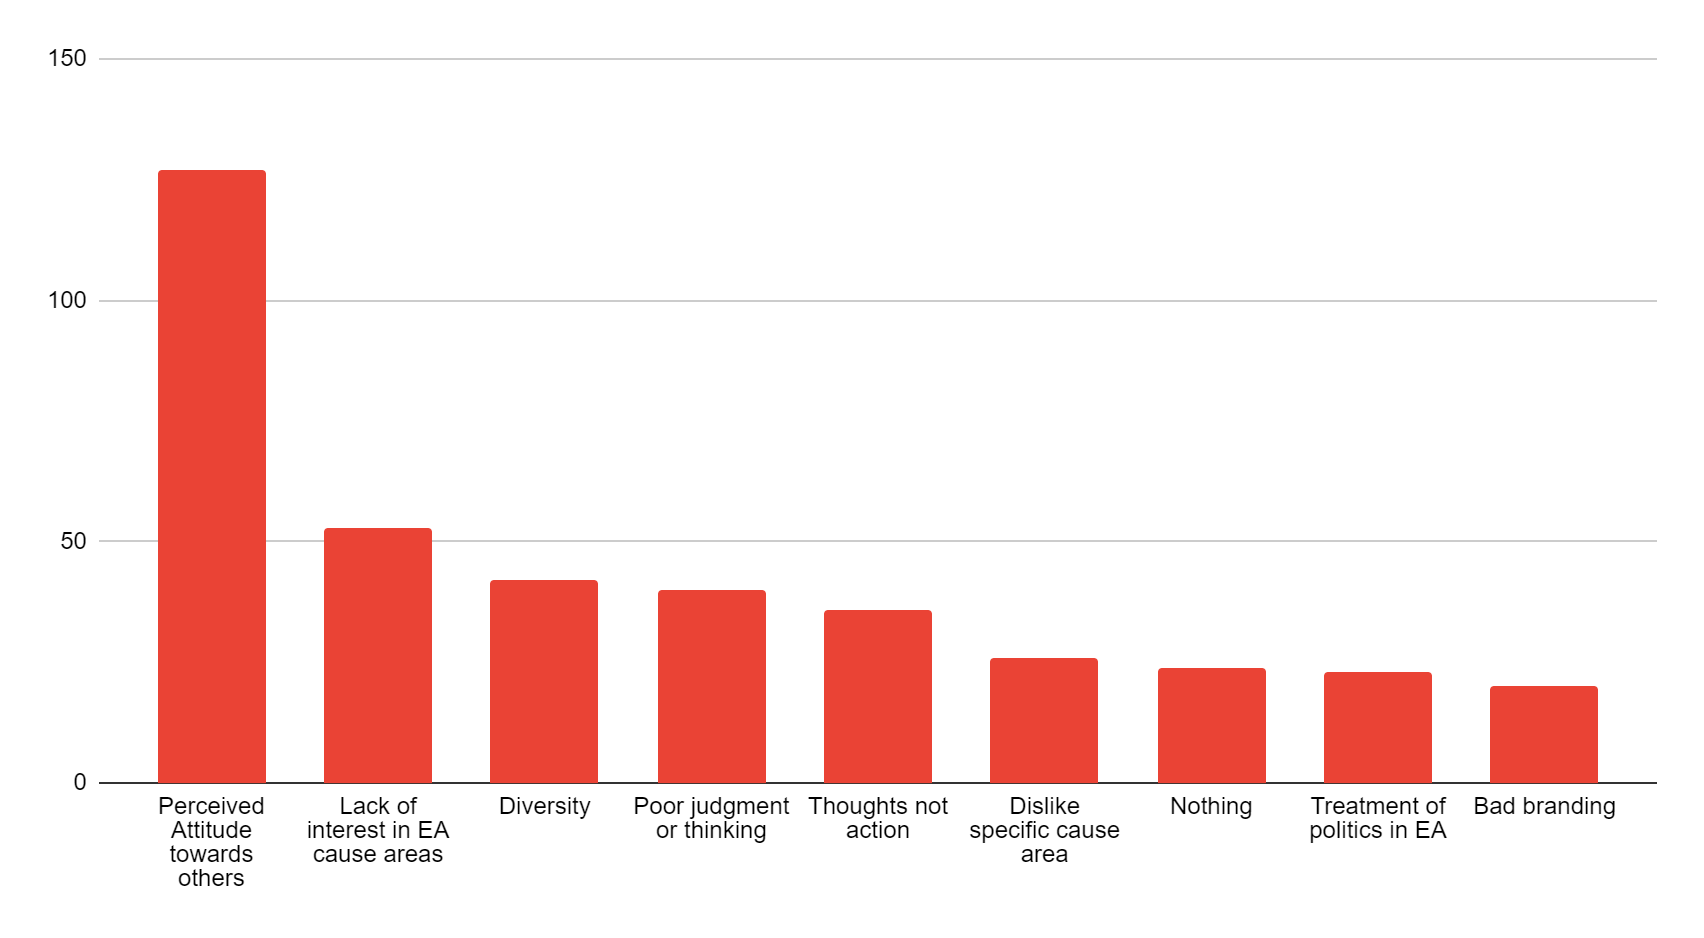
I made a quick graph of high-level categories for the question "What if anything do your personally dislike about EA?"

Notes on the categories:
Here is the Google Sheet with the all the categorizations. You could also copy / recategorize the data if you wish - I'd be curious what other ways we might categorize these issues.
Some things I thought of while making this chart
Thanks! This is interesting to see.
A few caveats/comments:
I agree with that. Also, "Elitism... Exclusive, High standards, Hubris, Dismissive" etc all tend to be a particular sort of behaviours/attitudes, relating to elitism and exclusivity. So one may want a more specific term or phrase than "behavior or attitude towards others".
This is all really useful, especially the second point regarding actual vs. perceived behaviors.
I do think there are some similarities between all these points that I'd maybe categorise under "elitist" (although I don't want to because I think that term has different connotations for people). But perhaps something like "EAs are perceived as being better than non-EAs" an this is expressed as the items I mentioned.
But perhaps it wouldn't be possible to draw these inferences without the comments themselves, where I'd imagine people discussed these overlapping topics.
I've updated the category name for now based on the above + split the lack of interest from what you mentioned in point 3.
I do think there are some similarities between all these points that I'd maybe categorise under "elitist" (although I don't want to because I think that term has different connotations for people). But perhaps something like "EAs are perceived as being better than non-EAs" an this is expressed as the items I mentioned.
I think there's something of a family resemblance, but that it still wouldn't be possible to categorise them all as one thing. For example, I don't think disliking "high standards", necessarily entails disliking a "perceived attitude towards others", or necessarily even thinking that anyone has any particular attitude towards others. I would think it's difficult/impossible to reliable tease these apart without access to the specific responses (which is unfortunately impossible, since we don't have permission to share any of people's qualitative responses).
If there was sufficient interest we could analyse this with more of a qualitative network approach, which can identify these clusters, but as you can imagine it's relatively time-intensive to do.
To get another reference point I coded the "High Standards" comments and found that 75% did not seem to be about "perceived attitudes towards others." Many comments explicitly disavowed the idea that that they think EAs look down on others, for example, but still reported that they feel bad because of demandingness considerations or because 'everyone in the community is so talented' etc.

Like last year’s post, this post reports on a number of questions about people’s experiences of the EA community and what factors helped or harmed their involvement, many of which were requested by the Centre for Effective Altruism. Most of the questions requested are different from last year’s, though they address similar topics.
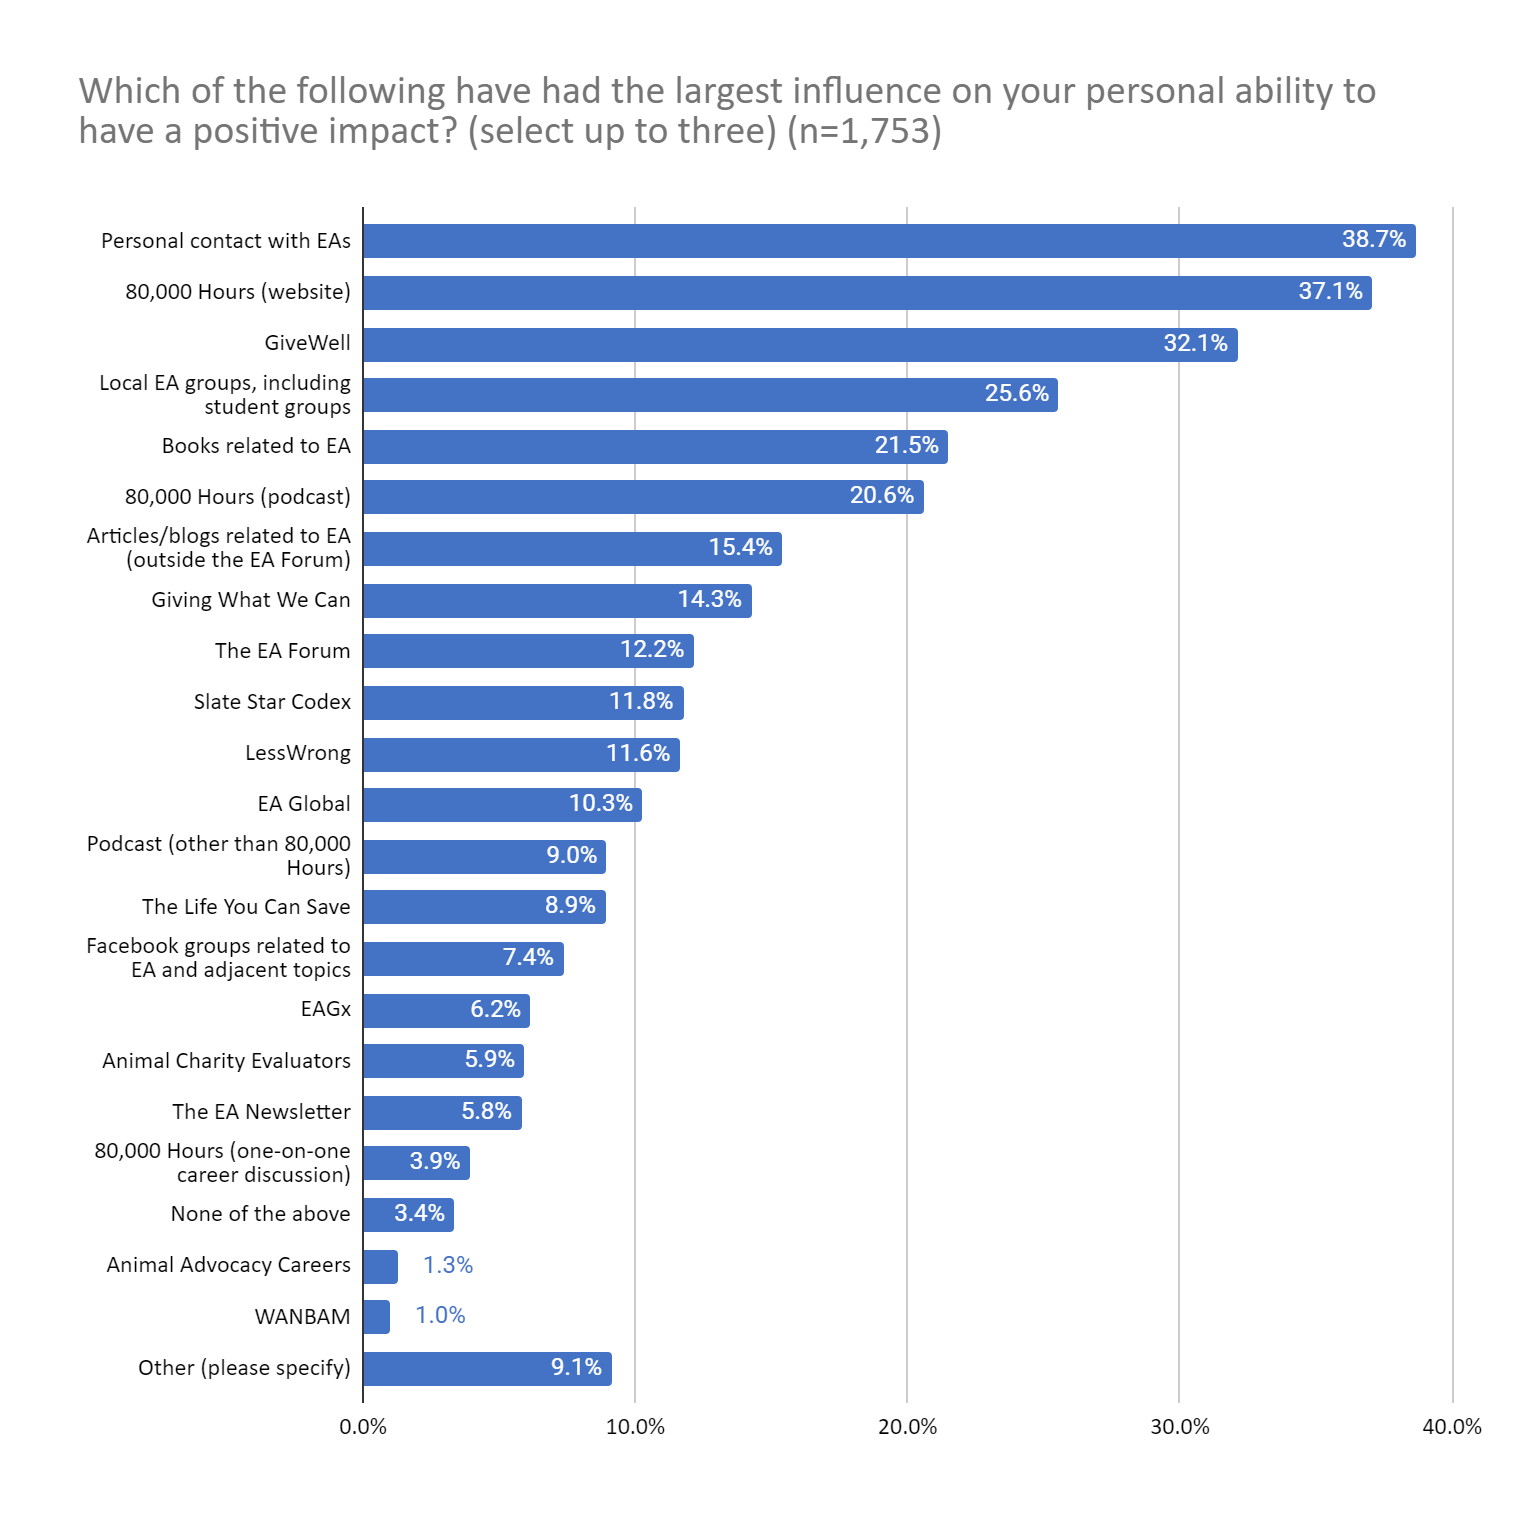
The factors that people most commonly selected were personal contact with EAs, 80,000 Hours (website), GiveWell and Local EA groups.
Notably, these results largely repeat the pattern of results observed for our question about what factors were important for people getting involved in EA, reported in an earlier post, with the same factors making up the top four. [1]
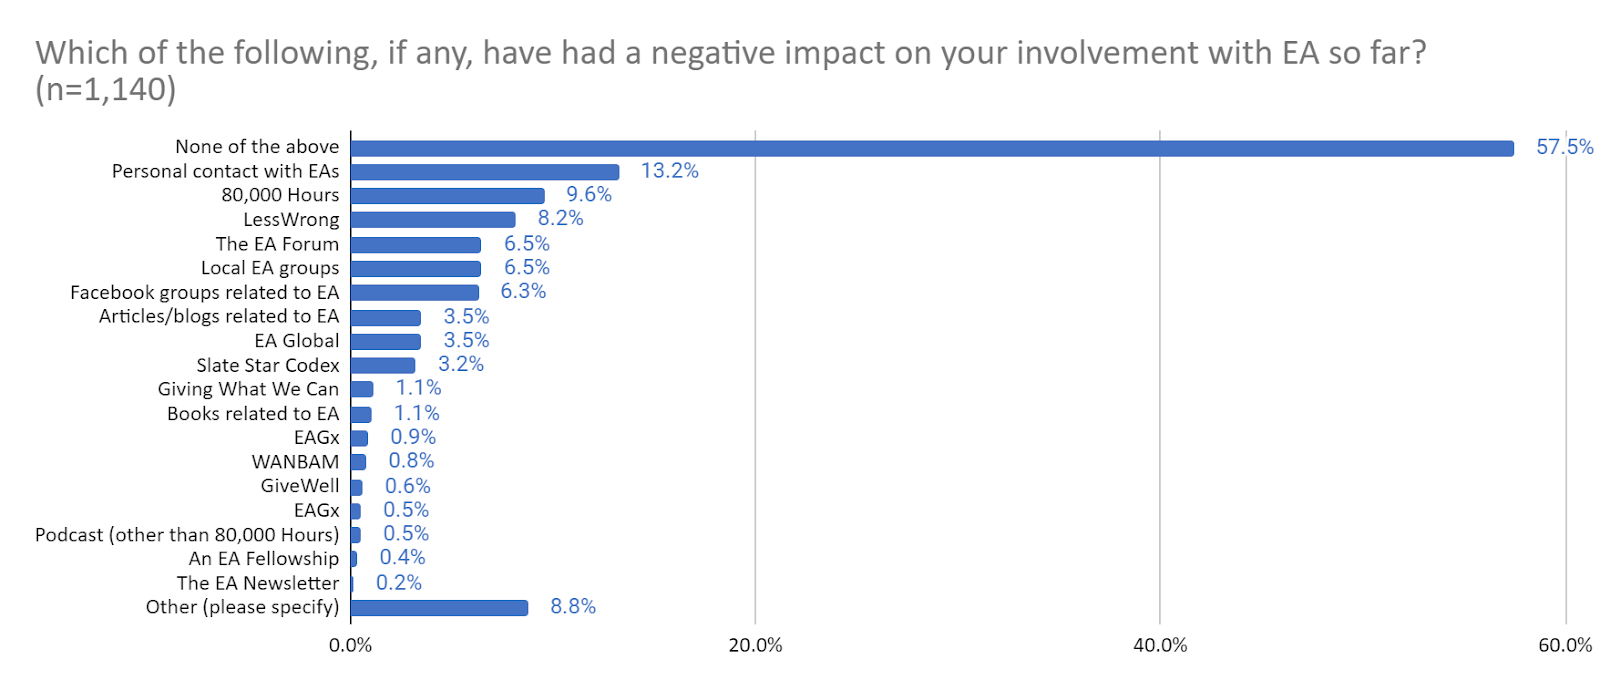
The most striking result for this question is that more than half (57.5%) of respondents selected “None of the above.”On the face of it, this seems like a reassuring sign. Moreover, it does not seem that the majority of respondents merely selected “None of the above” because other factors which had negatively affected their involvement in EA weren’t listed, as only 8.8% of respondents selected “Other” (though it is possible that respondents were merely disinclined to select this option, because they did not want to write in an option).
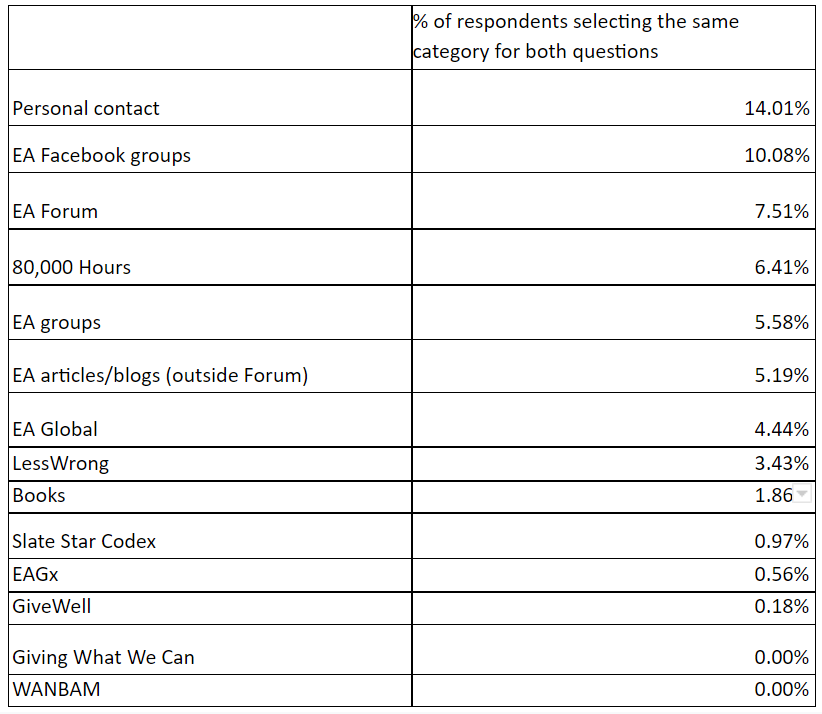
Another striking result is that the factors that were most commonly selected as having an influence on respondents’ personal ability to have a positive impact were also the most commonly selected as having had a negative impact on their involvement with EA so far. It is important to note that the instructions for the latter question explicitly stated that respondents could “select influences as having a negative impact even if you also selected them as having a positive impact above, if [they] wish[ed].” Nevertheless this does make it difficult to interpret the overall impact of these different factors (though see more discussion below).
One plausible explanation is that this is partly explained by larger numbers of respondents having experience of some of these factors. This might lead to them being selected more often both as positive and negative influences. This seems like it may explain the pattern to some extent (e.g. we would expect large number of EAs to have been exposed to 80,000 Hours, personal contacts etc.) although a number of factors which we would expect people to be widely exposed to were not often selected (e.g. EA Newsletter). Relatedly, it could be that some factors generally affect respondents more strongly, leading them to be selected more often. For example, personal contact with EAs may be more strongly affecting, whether positively or negatively, than most other factors. It is also possible that this reflects, to some extent, ambivalence on the part of respondents, with factors commonly affecting them both negatively and positively. This was relatively common for a small number of the categories, though was generally infrequent.
It is also theoretically possible that some people interpreted the first question about what had the largest influence on “personal ability to have a positive impact” as including things which had a large influence in reducing their ability to have a personal impact. We think this is not likely to be a common interpretation, as the wording of the next question makes clear that this first question was intended to be interpreted positively, and we did not see any signs of people interpreting it this way in the open comments, though it remains possible that this accounts for some of the responses.
These two questions weren’t designed (to our knowledge) to facilitate a direct comparison of each factor’s positive vs negative influence (to get a sense of their overall influence). For one thing, the questions each ask about different things (influence on “personal ability to have a positive impact” and on “negative impact on your involvement with EA so far”). Moreover, the questions cannot necessarily be used to compare the total positive or negative impact of each factor in isolation. This is because the questions merely ask respondents to select whether each factor is among the most important factors (up to 3) for influencing their ability to have a positive impact, or influenced someone negatively (for the second question), which does not necessarily indicate the magnitude of the impacts of these factors. Nevertheless, there may be some interest in comparing how often different categories were selected for each (for the categories which were included for both questions), so we have provided some graphs below.
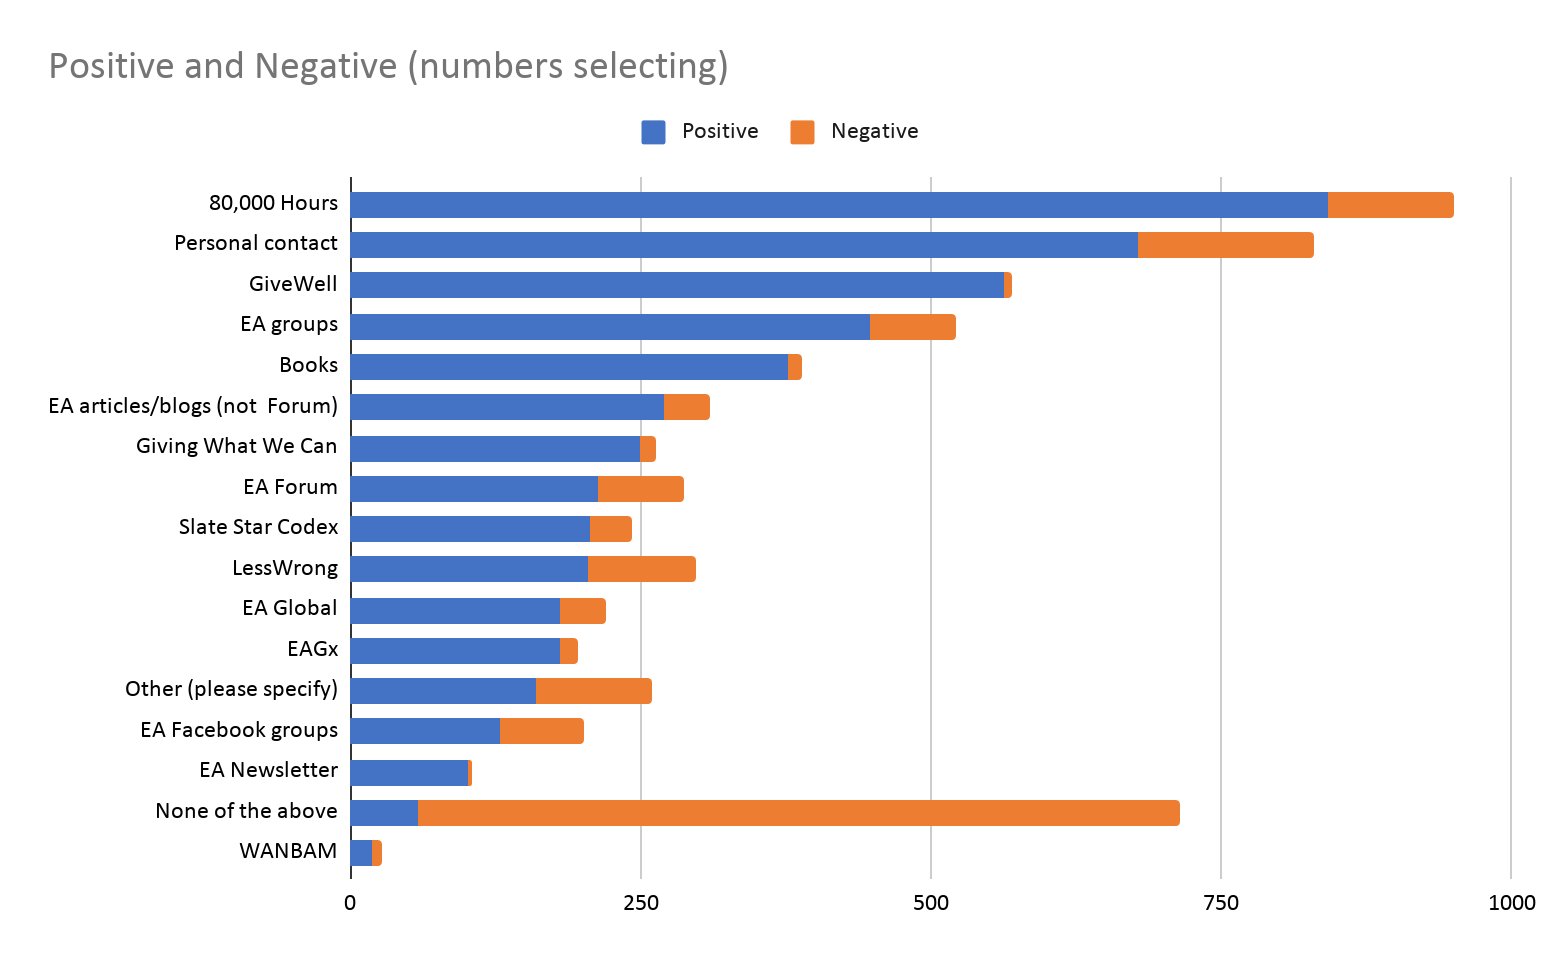
The first graph below shows the numbers selecting each category for each question. It is ordered highest-lowest in terms of the number selecting the category for the ‘positive’ question.
As we can see, 80,000 Hours and personal contact were commonly selected for both the positive question and the negative question (though considerably more commonly selected for the positive). In contrast GiveWell was very commonly selected for the positive question but very infrequently cited as a negative influence. EA groups were the fourth most commonly selected for the positive question, but also relatively frequently selected for the negative question.
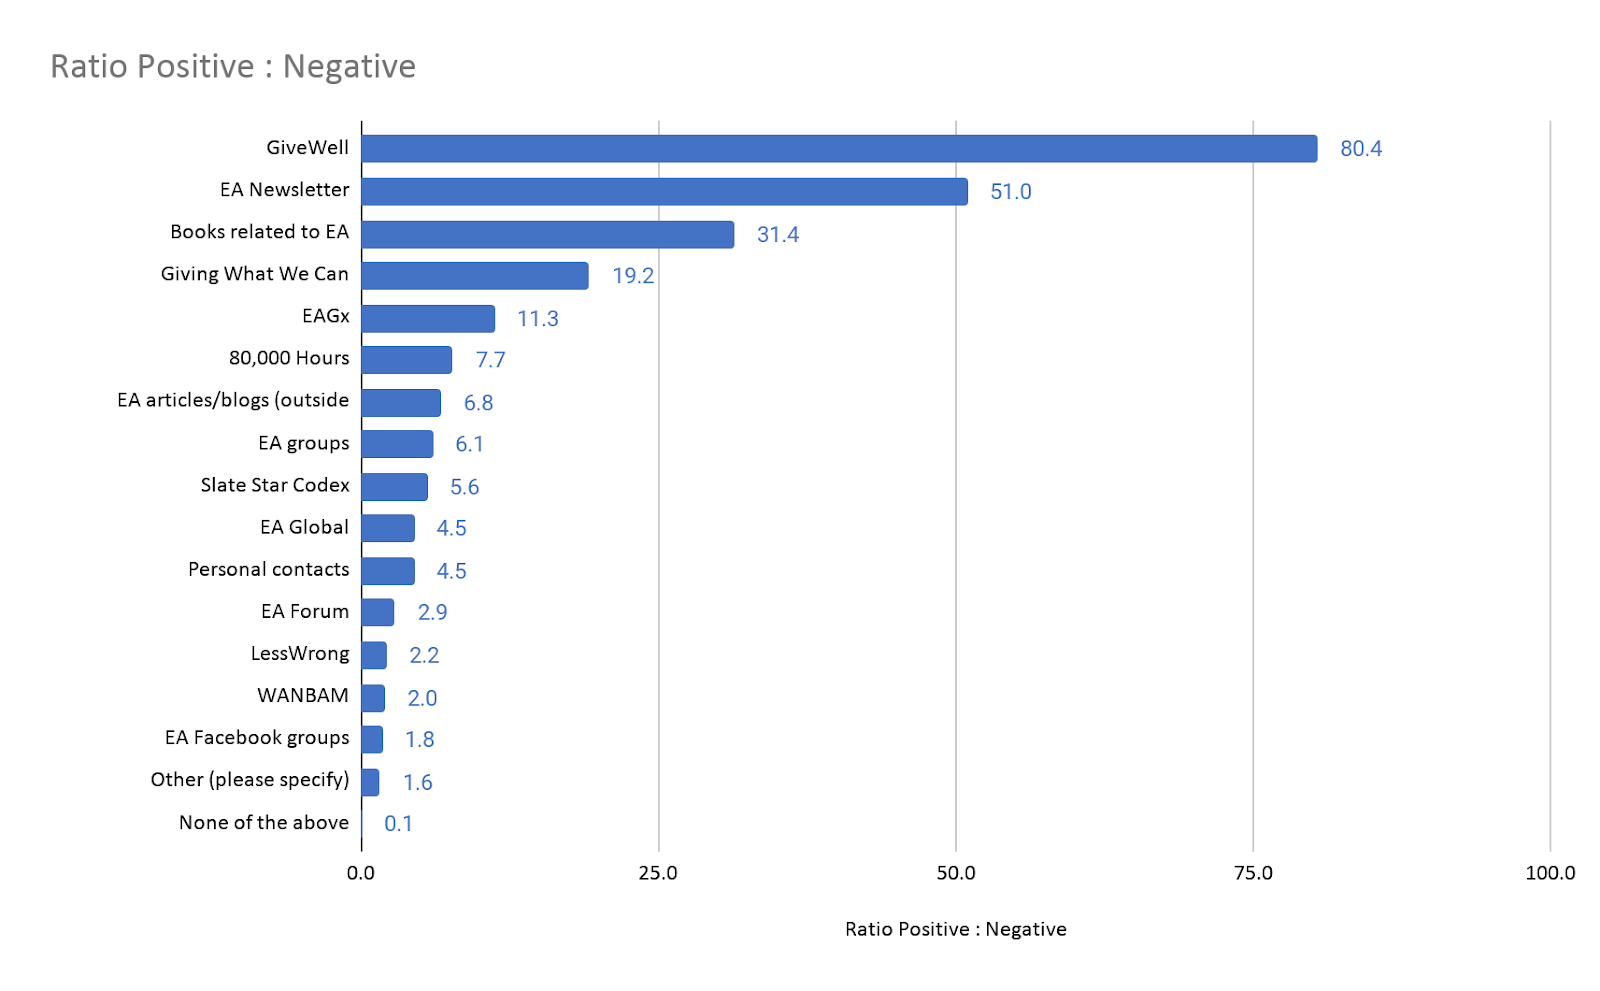
The graph below displays the ratio (highest- lowest) of mentions for the positive question to the negative question. As noted above, GiveWell has a very high ratio of positive:negative selections, but we can also see that the EA Newsletter has a very high ratio, despite being selected relatively infrequently for the positive influence question, due to being selected very infrequently as a negative influence. This seems to make sense, since the Newsletter seems likely to offer milder benefits across a large number of people (but rarely harm them).
Most categories are comfortably above a 1:1 ratio, though a small number are at around 2:1 or less.
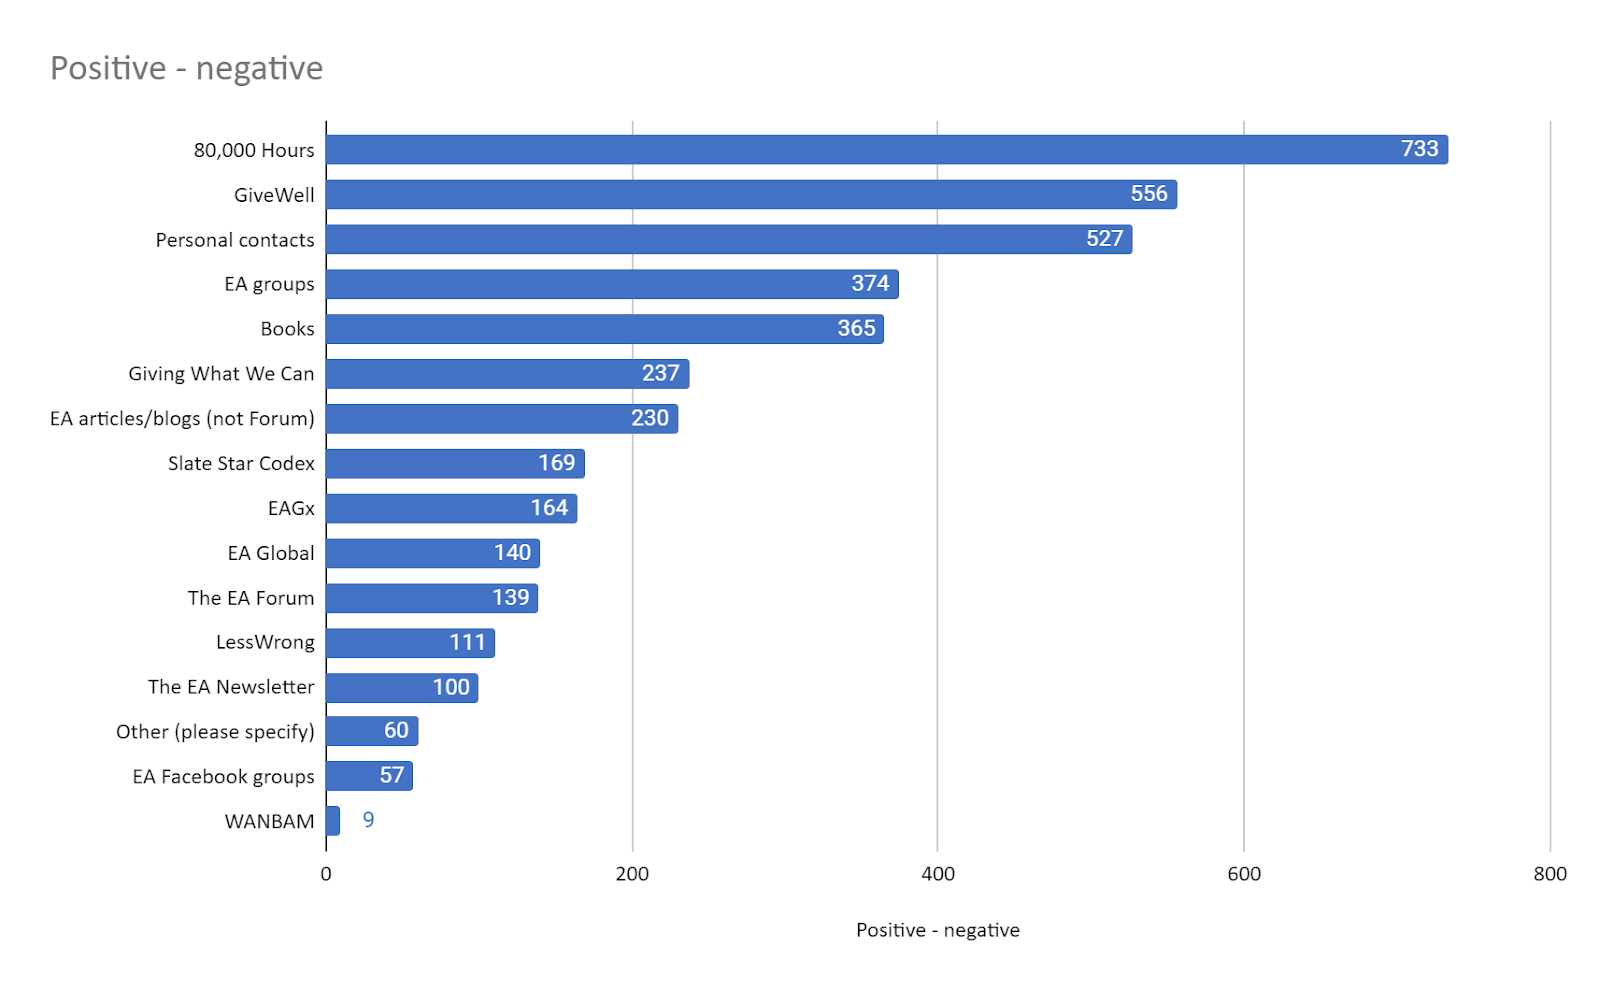
The following graph shows the total number of people selecting the factor for the positive question minus the number that selected it for the negative question. This gives more weight to factors which were selected by a larger absolute number of respondents, over factors which were selected by a good ratio, but only for a small number of respondents. For this graph, we dropped the category ‘None of the above’ which was selected by many, many more respondents for the negative question than the positive one.
As in previous posts, we examined differences in the proportions of respondents selecting these categories across gender, race and engagement groupings. In each plot we’ve greyed out those categories with too small a sample size to evaluate.
Race
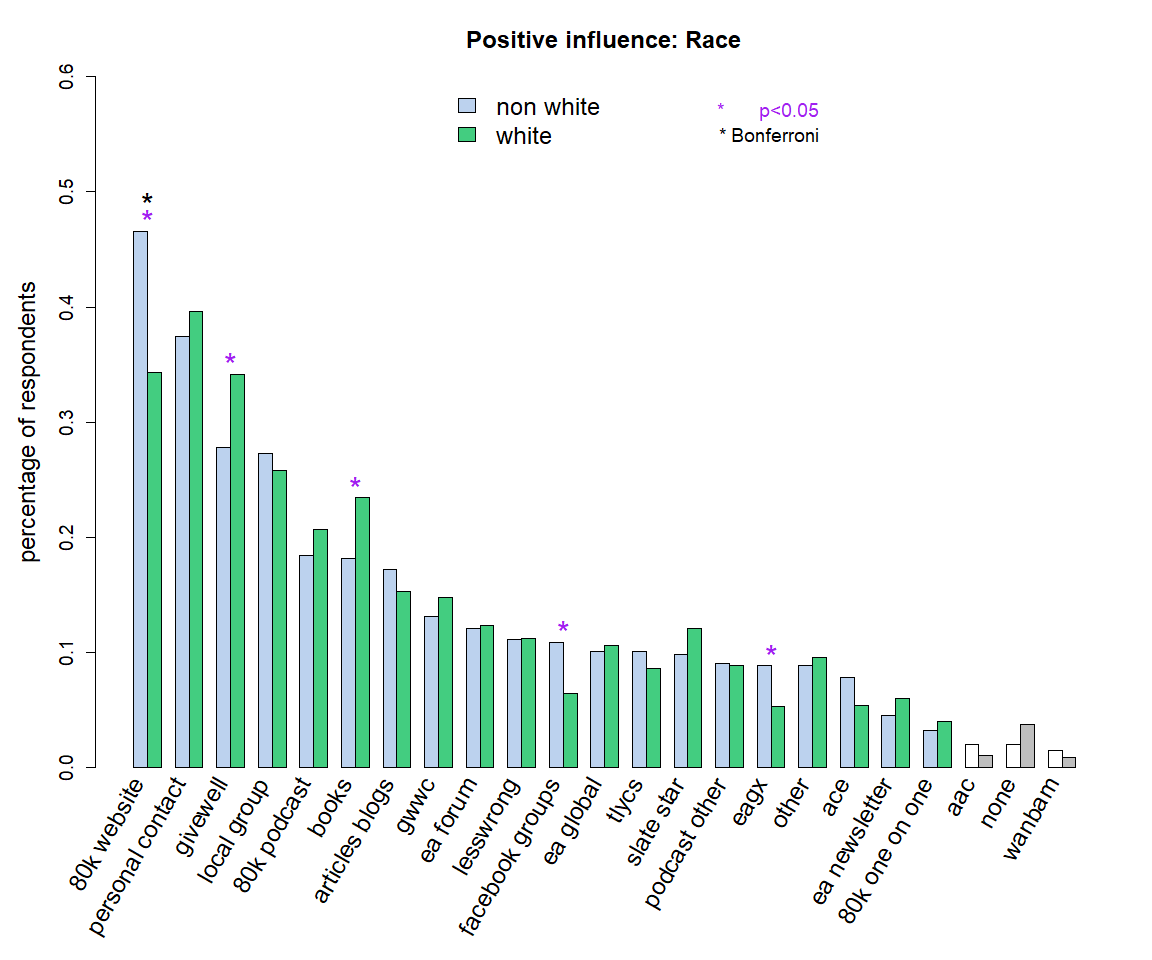
After adjusting for multiple comparisons, we find only one significant difference, with 80,000 Hours (website) being selected for the ‘positive’ question by a larger percentage of not exclusively white[2] than white respondents.
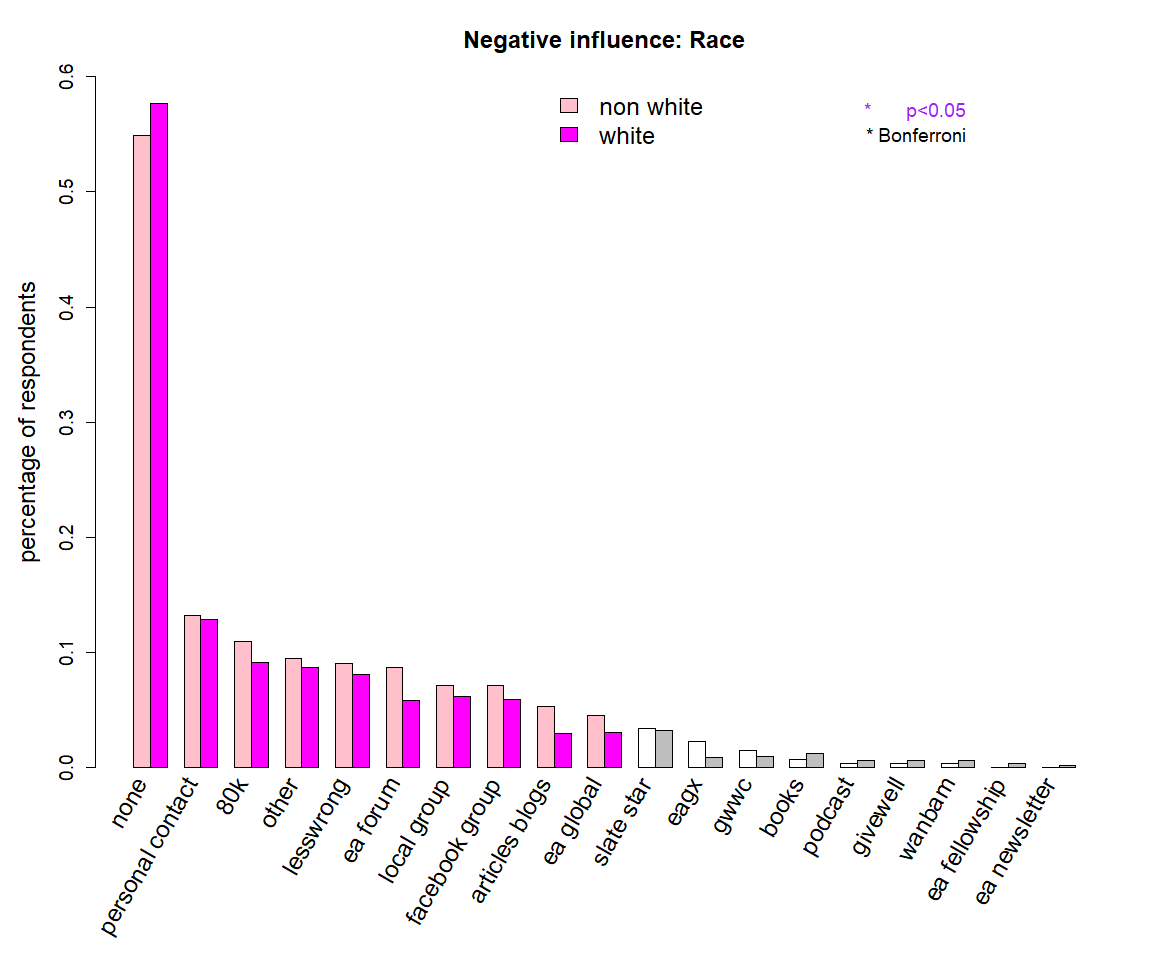
We observed no significant differences for the ‘negative’ question, though since a much smaller number of respondents selected negative influences, we have a much smaller sample size overall.
Gender
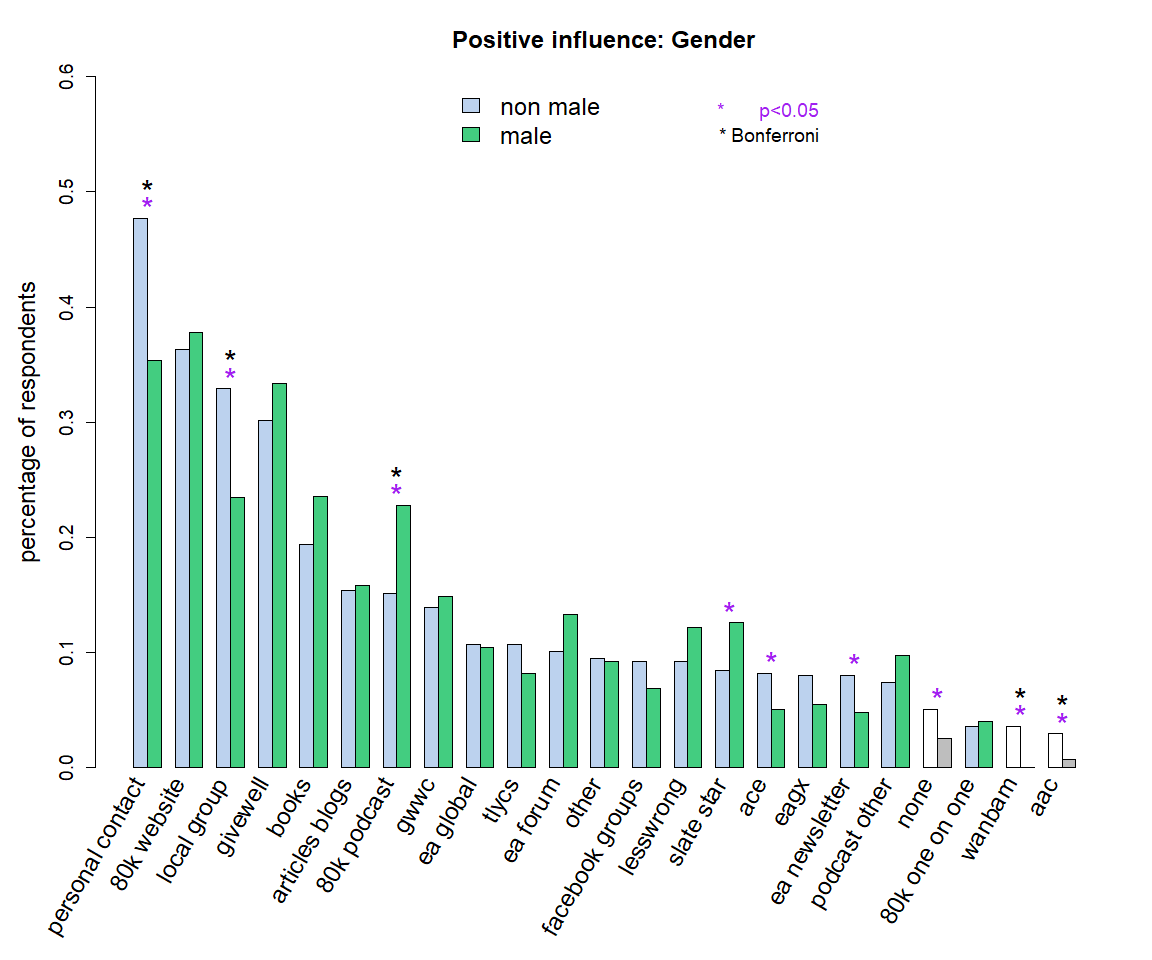
In line with our findings discussed in a previous post about what factors are important for people “getting involved” in EA, we found that significantly higher proportions of non-male respondents selected personal contacts and local groups as important.
In addition, the 80,000 Hours podcast was selected less often by non-male respondents, in contrast to the direction of the results for the 80,000 Hours website.
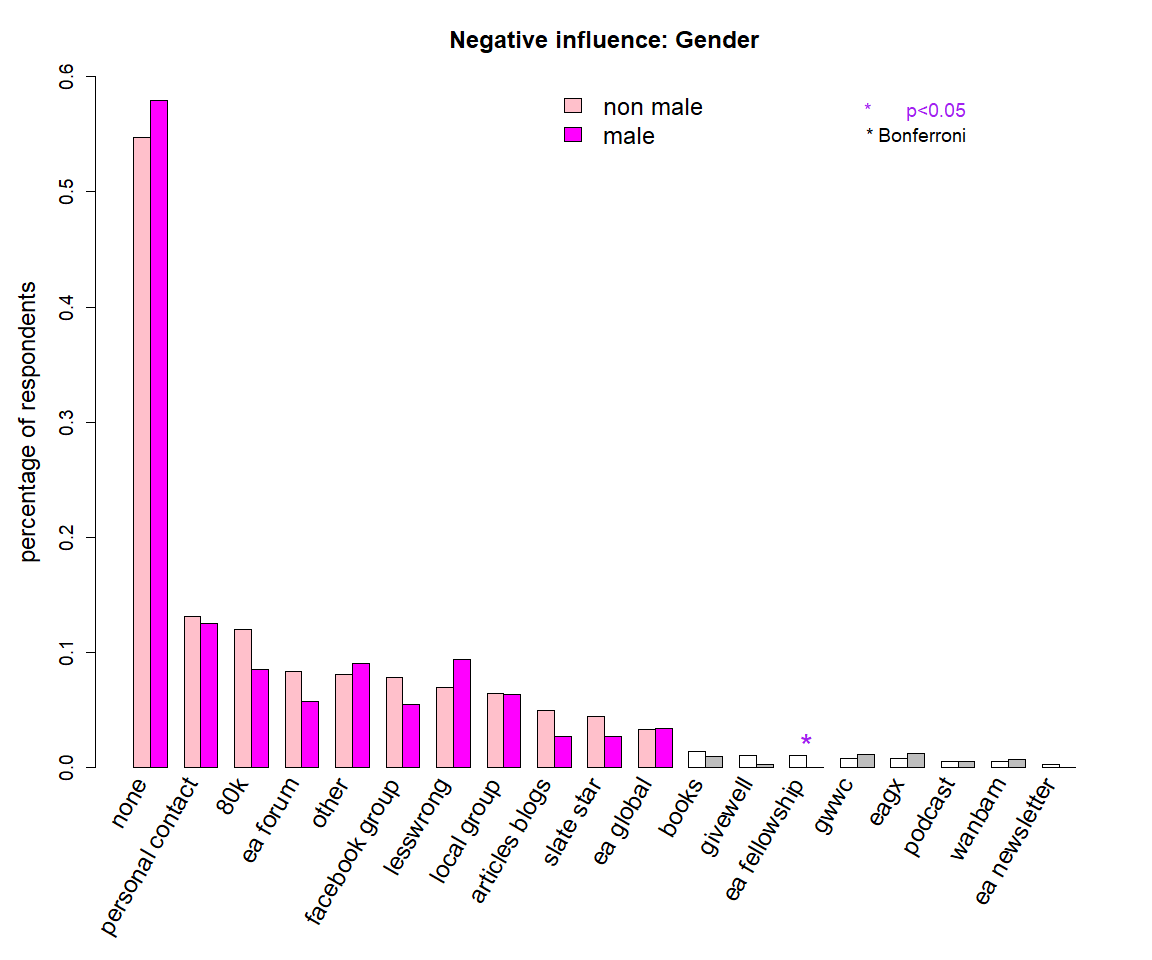
For the negative influences question, we found no significant differences for gender.
Engagement
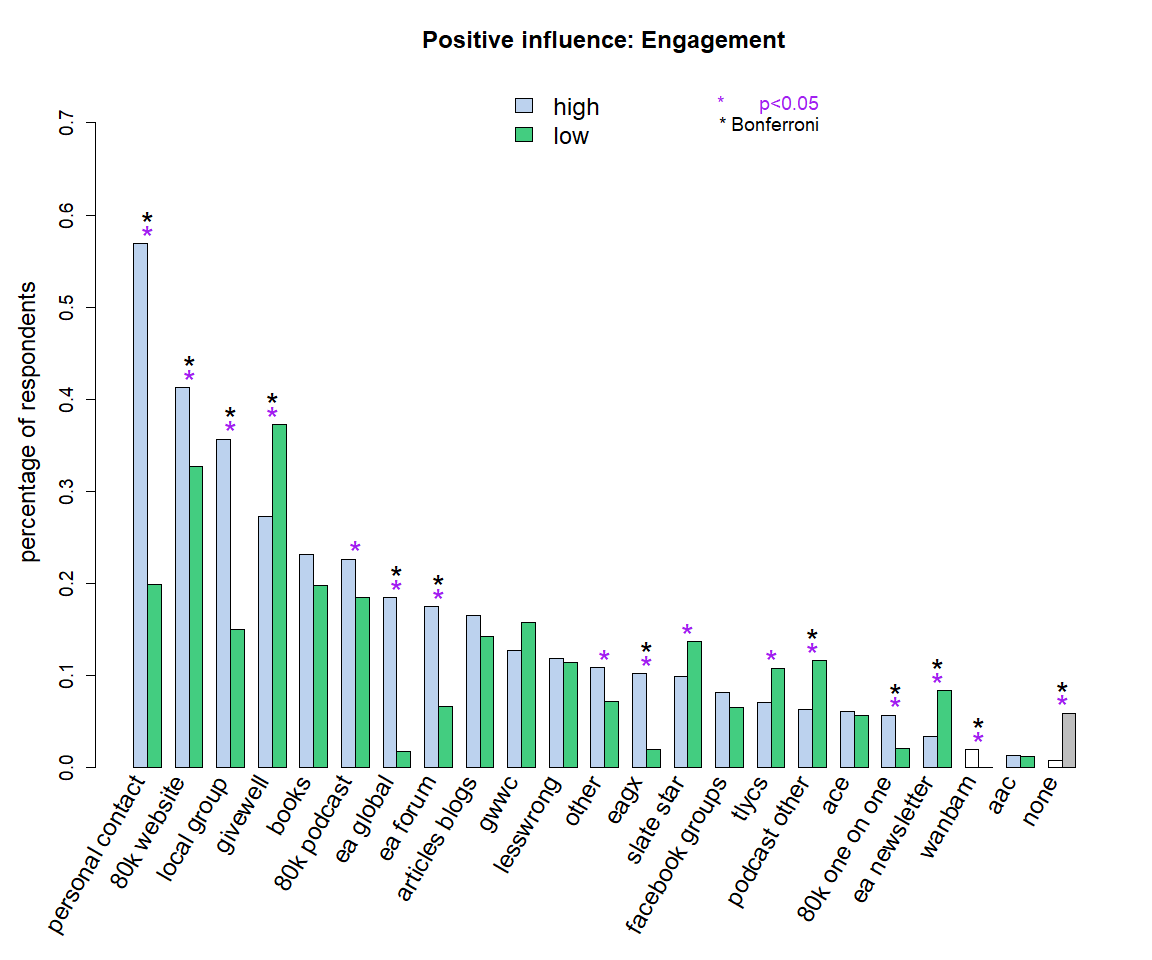
For low/high engagement respondents, we find many large, significant differences. Personal contacts, the 80,000 Hours website, EA groups, EA Global, EAGx, the EA Forum and 80,000 Hours one-to-ones were selected by higher percentages of highly engaged EAs than less engaged EAs.
In contrast, GiveWell and podcasts (other than 80,000 Hours) were selected more commonly by less engaged EAs.
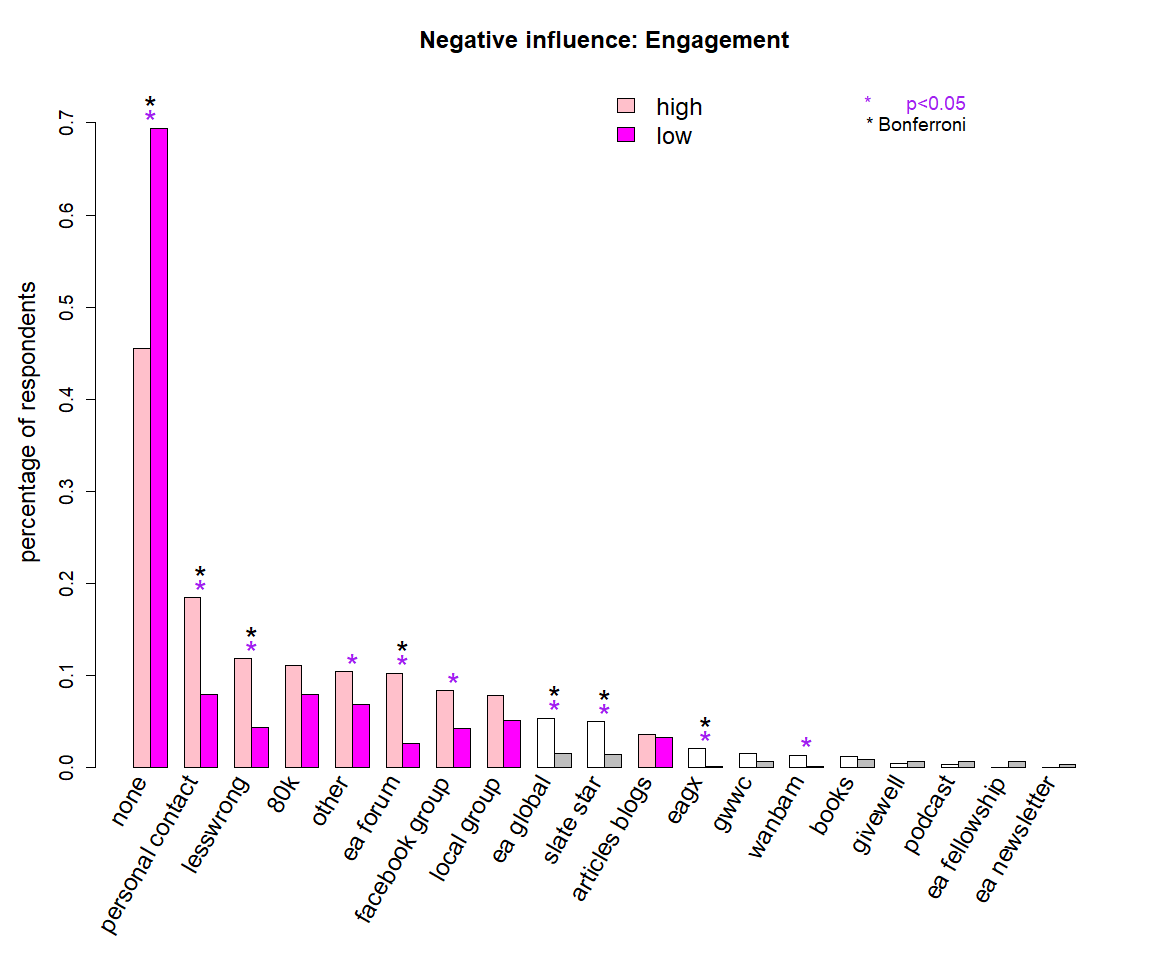
For negative influences, we found that a much higher percentage of less engaged respondents selected none of the above (perhaps because they had encountered fewer of these factors). Conversely, personal contact, LessWrong and the EA Forum were selected by significantly higher percentages of highly engaged respondents.
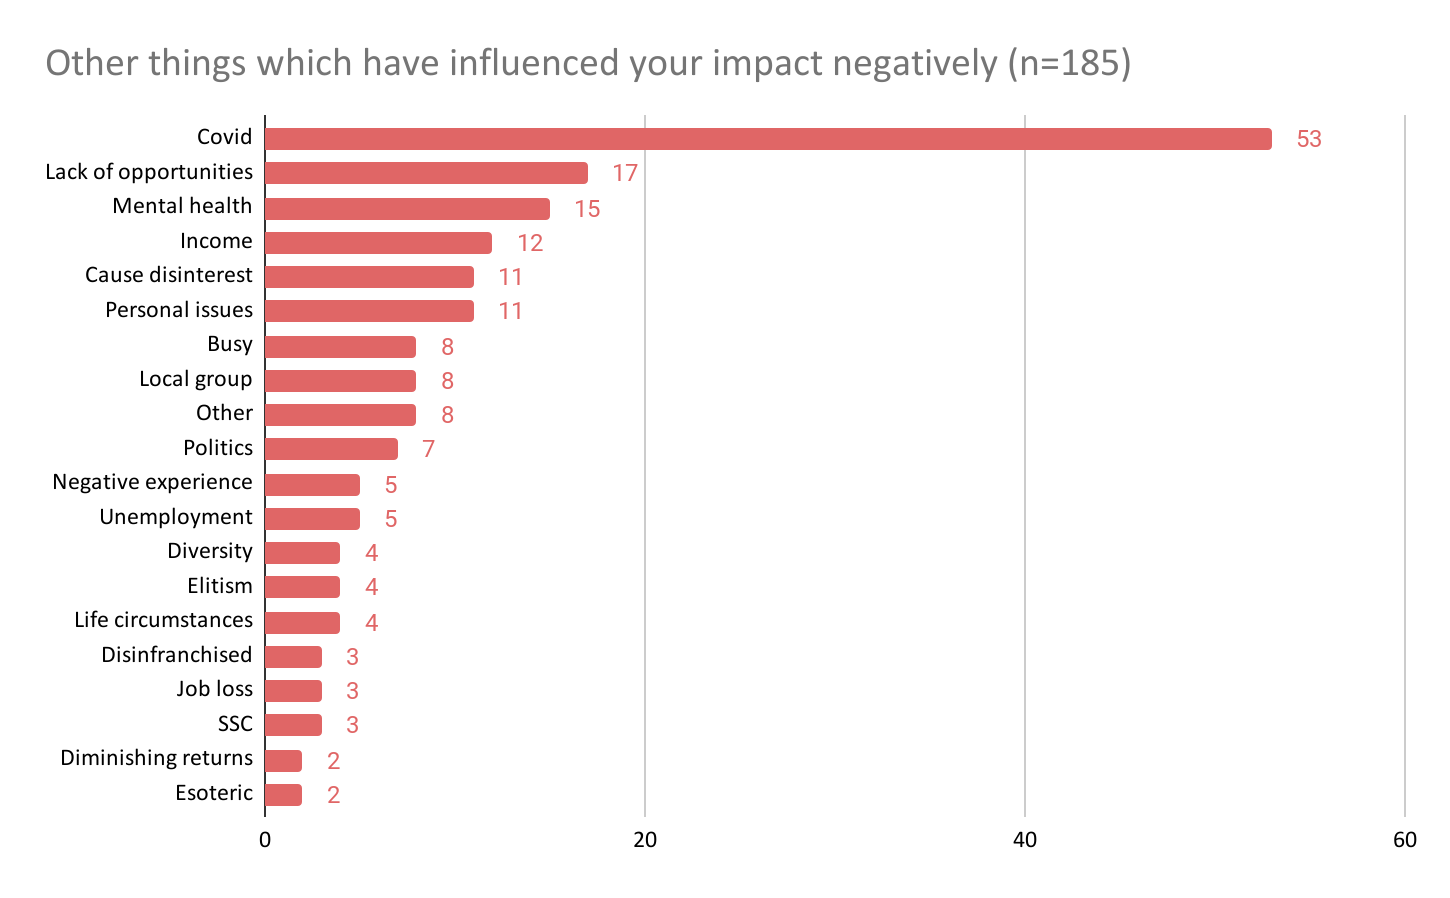
436 respondents (20% of total) provided open-ended details regarding factors which influenced their impact over the last year. 33 people provided both positive and negative factors.
The largest factor by far which negatively impacted influence was some result of the pandemic. These included job loss, reduced income, stress, social isolation, remote interaction, and negative impacts on mental health. Some of these causes were also mentioned on their own, but not directly attributed to the pandemic. Other negative influences were a lack of career opportunities, disinterest in EA causes, personal issues, being too busy, and local group issues.
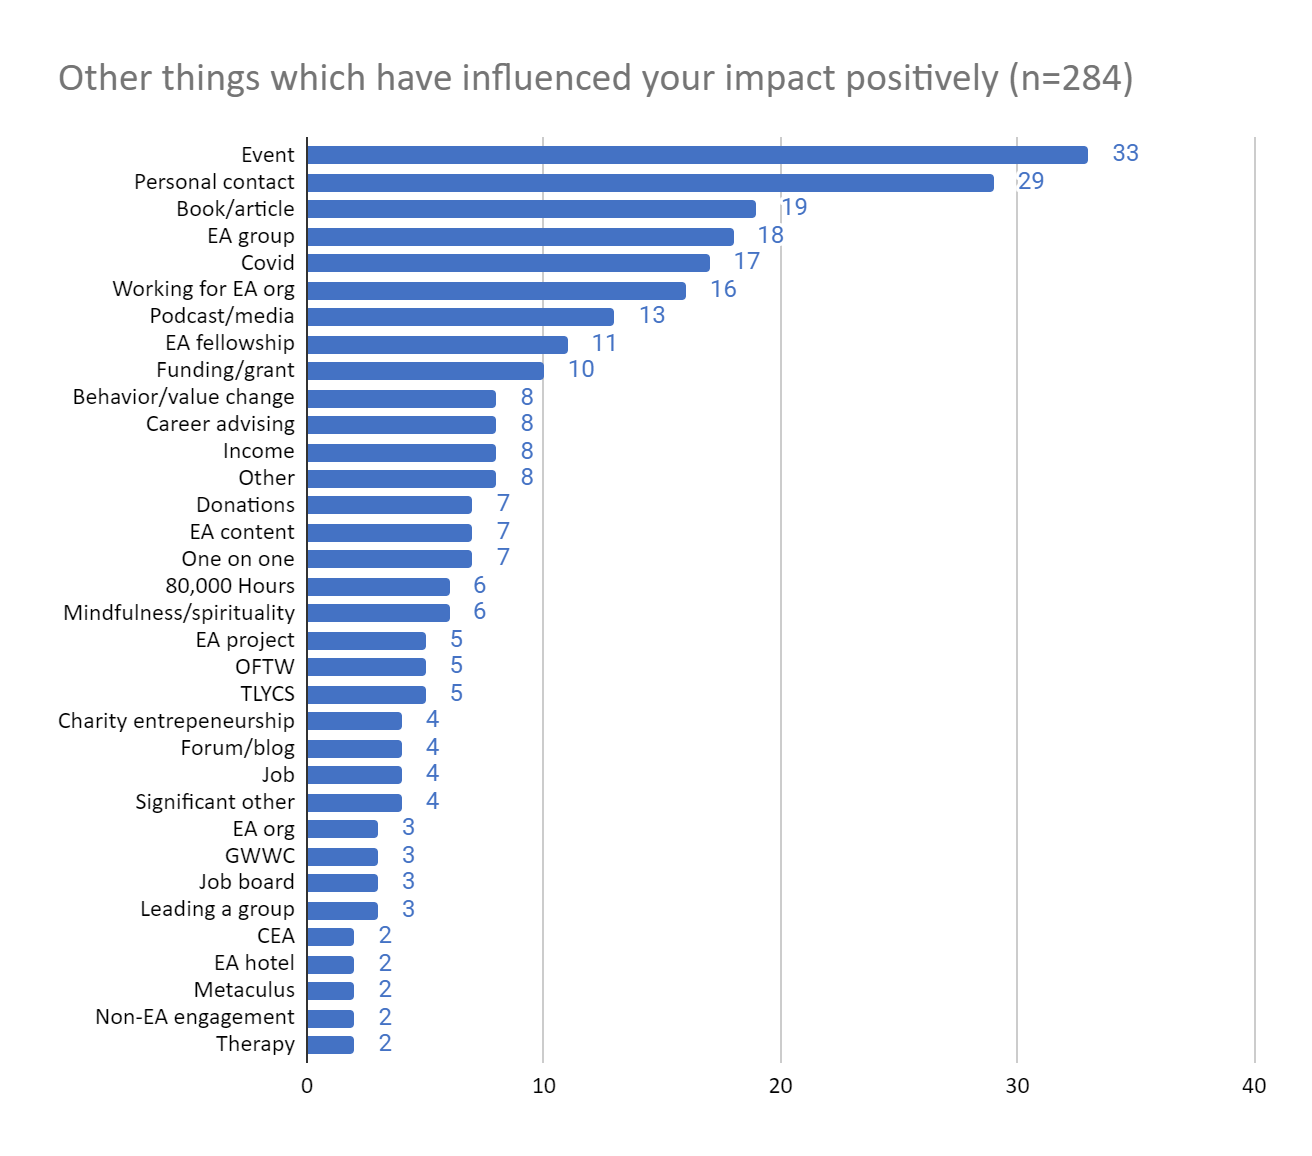
The most commonly mentioned ‘other’ positive influence on impact was attendance at an event.
As was the case last year, a lot of the responses mentioned things that were already broader categories mentioned in the question. Personal contact with EAs, other professionals, or mentors was commonly mentioned as a positive influence. 19 people mentioned reading books or articles such as, The Precipice, Doing Good Better, and The Life You Can Save. Local, university, and virtual EA groups were reported as positive influences by 18 people. The pandemic was also mentioned as a positive influence by some, citing more free time, increased motivation to donate, and being able to interact with EAs globally. Other commonly reported influences were working for an EA org, some podcast or other media, EA fellowships, and funding/grants.
This year we asked respondents to rate how several factors had influenced their likelihood of staying engaged in EA over the last 12 months. Respondents could indicate that they had had no significant interaction with this factor or rate it on a scale running from (1) Made me a lot less likely to stay engaged - (4) Significant interaction, but neutral effect - (7) Made me a lot more likely to stay engaged. This format has a significant advantage over the questions discussed previously, as it allows us to get a sense of the magnitude of the influence the factors had, but it comes at the cost of being significantly more demanding on respondents.
One of the most notable findings from this question was that very large percentages of respondents reported having had no significant interaction with each of these factors (a majority for most of the items). A majority of respondents reported some significant interaction with personal contacts, the 80,000 Hours website, 80,000 Hours podcast, an EA group or the online EA community (other than the Forum), but none others. Moreover, many respondents who reported a significant interaction with a factor, reported that it nevertheless had neither positive or negative overall effect on their likelihood of staying involved. As such, personal contacts were the only category for which a majority of respondents reported having some impact on their retention (whether positive or negative).
These very low percentages may partly be a result of the question asking about the last 12 months specifically. It is also theoretically possible that the factors which are most important for people’s retention in EA tend to influence them earlier in the process of their getting involved in EA (resulting in them being solidly engaged going forward), rather than in an ongoing fashion. More research examining this seems valuable.
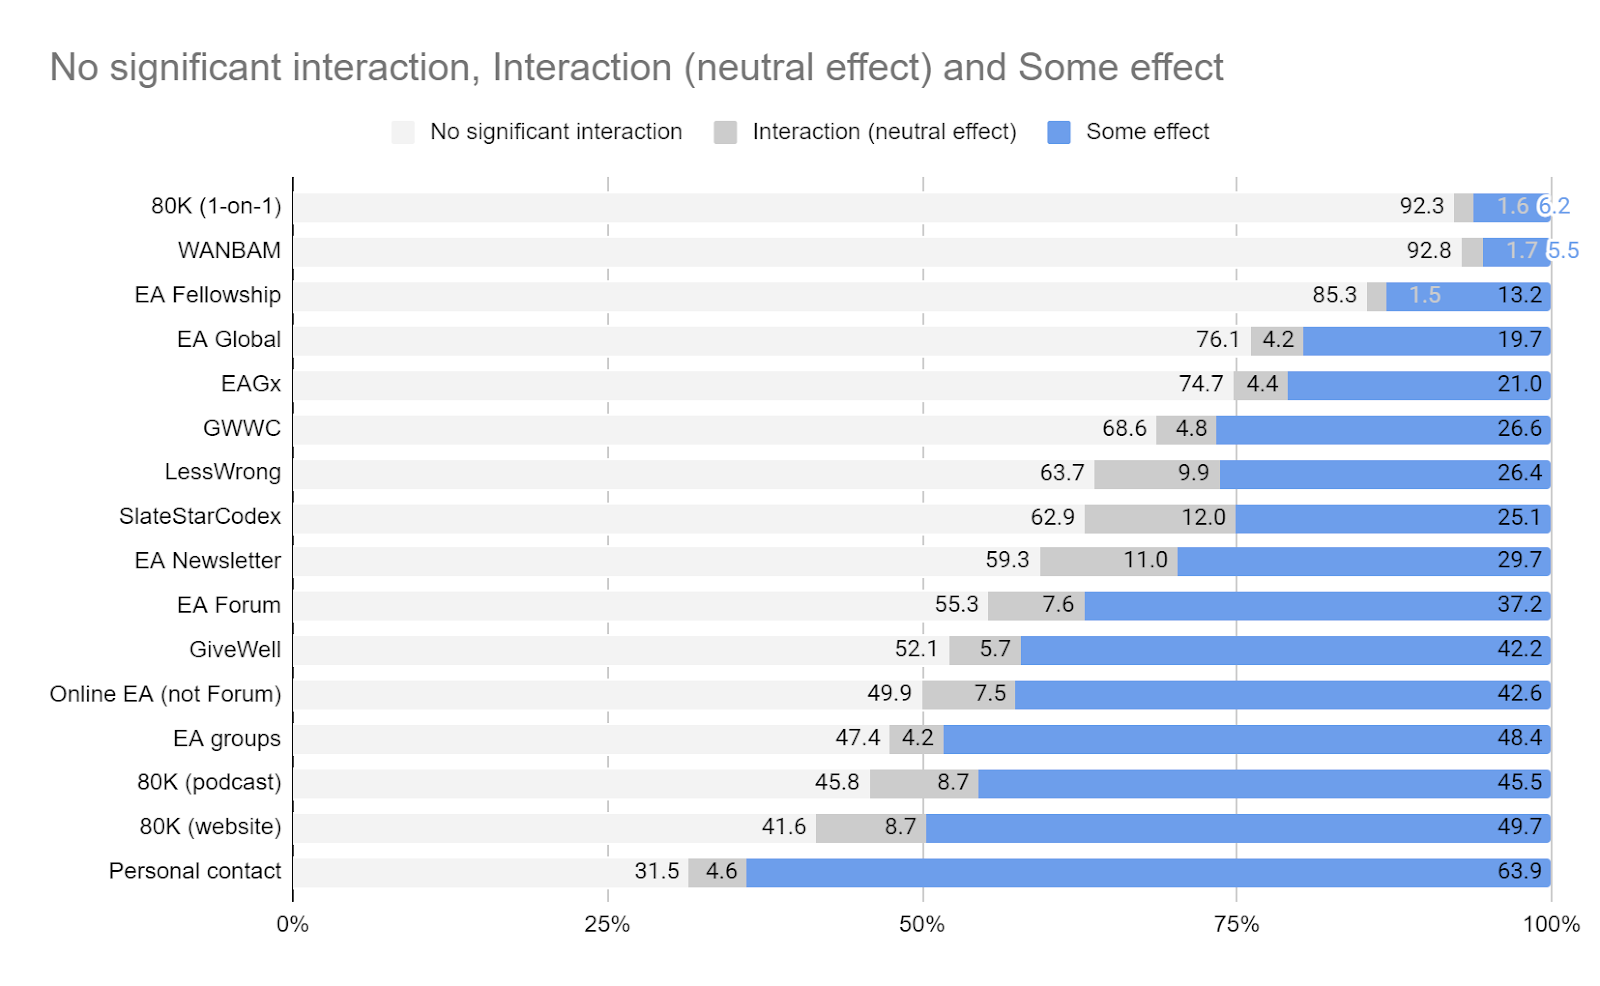
The graph below shows only those responses which indicated some interaction with a factor (including those who had a “significant” interaction, but with neutral effect). As the graph shows the percentages of those who reported an interaction with each factor, it is important to bear in mind that the absolute number of respondents varies across each category (per the above graph).
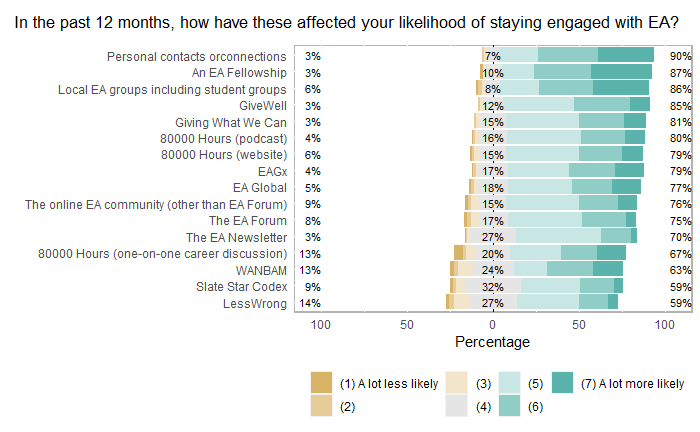
As we can see, the responses are overwhelmingly positive, with very small percentages of respondents (<15% in all cases, and even fewer in many cases) indicating that a factor made them less likely to stay engaged. These results need to be interpreted with a couple of things in mind, however. Firstly, this question may be particularly influenced by selection/survivorship bias (if any factor strongly made people less likely to stay engaged, we might be less likely to receive an answer from them, given that they might have disengaged from EA). Secondly, respondents might deliberately not interact with things which they expect they would not enjoy, or which they previously experienced and learned they would not enjoy. This doesn’t challenge the validity of the results, but it does sound a note of caution about any inferences one might make about whether it would be positive to get more people exposed to these factors. Even if all of the people who actually interacted with a factor reported benefit from it, it doesn’t follow that scaling up the number of people exposed to this factor would bring similar benefits.
This year we also asked respondents to indicate which factors were the most important source of them changing their mind or learning something important regarding their path to impact or making an interesting and valuable personal connection, if either of those things had happened in the last year.
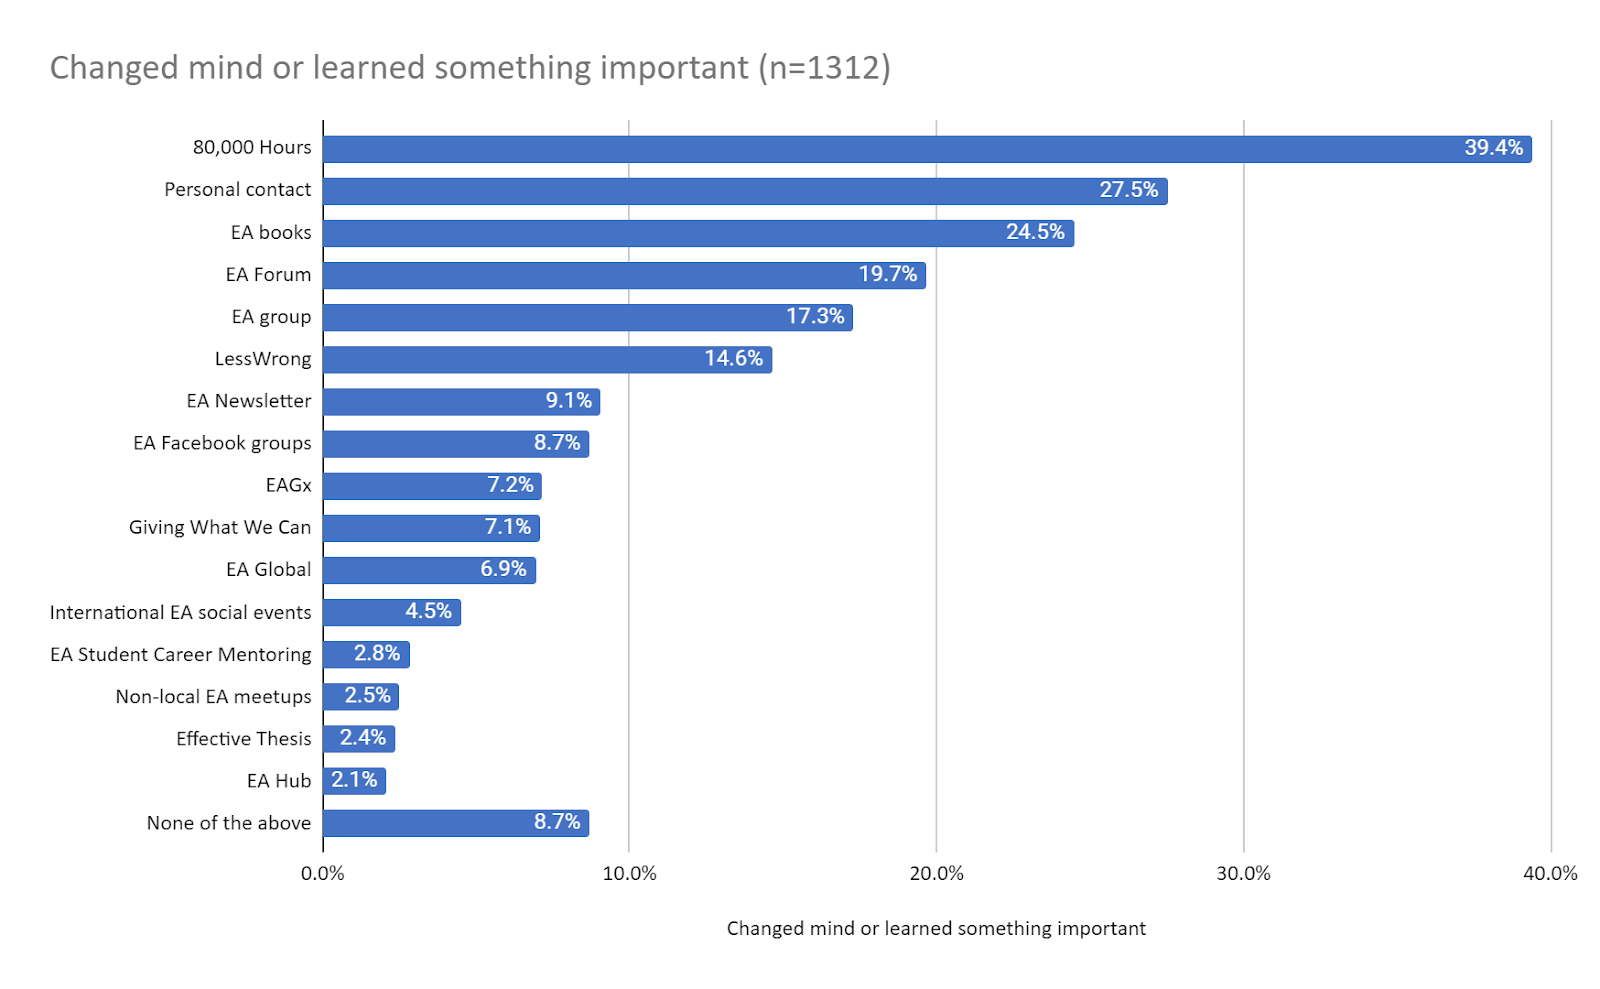
80,000 Hours was the factor most commonly selected as important for helping respondents change their mind or learn something important by a very large margin. This was followed by personal contacts and EA books, with the EA Forum following somewhat further behind.
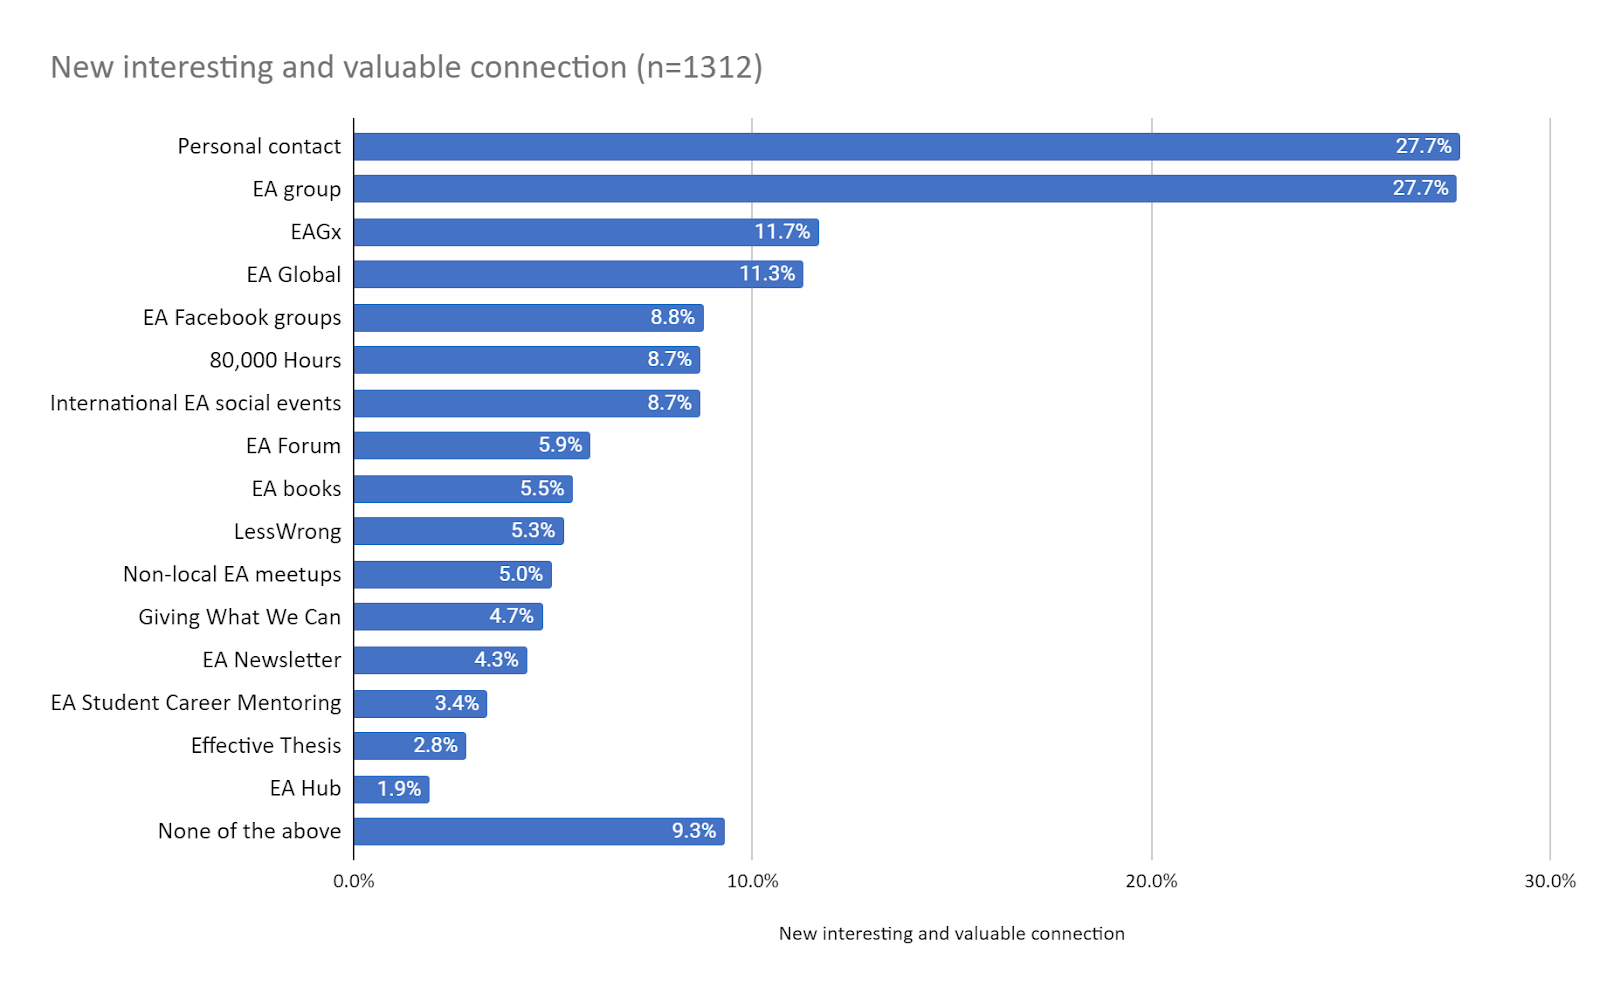
In terms of being important for making a new interesting and valuable personal connection, unsurprisingly, social factors were cited the most frequently, with personal contacts and EA groups both a long way out in front of other factors. EAGx and EA Global were the next most commonly selected factors, both receiving similar numbers of responses. EA Facebook groups, 80,000 Hours and international EA social events were each selected with similar frequency.
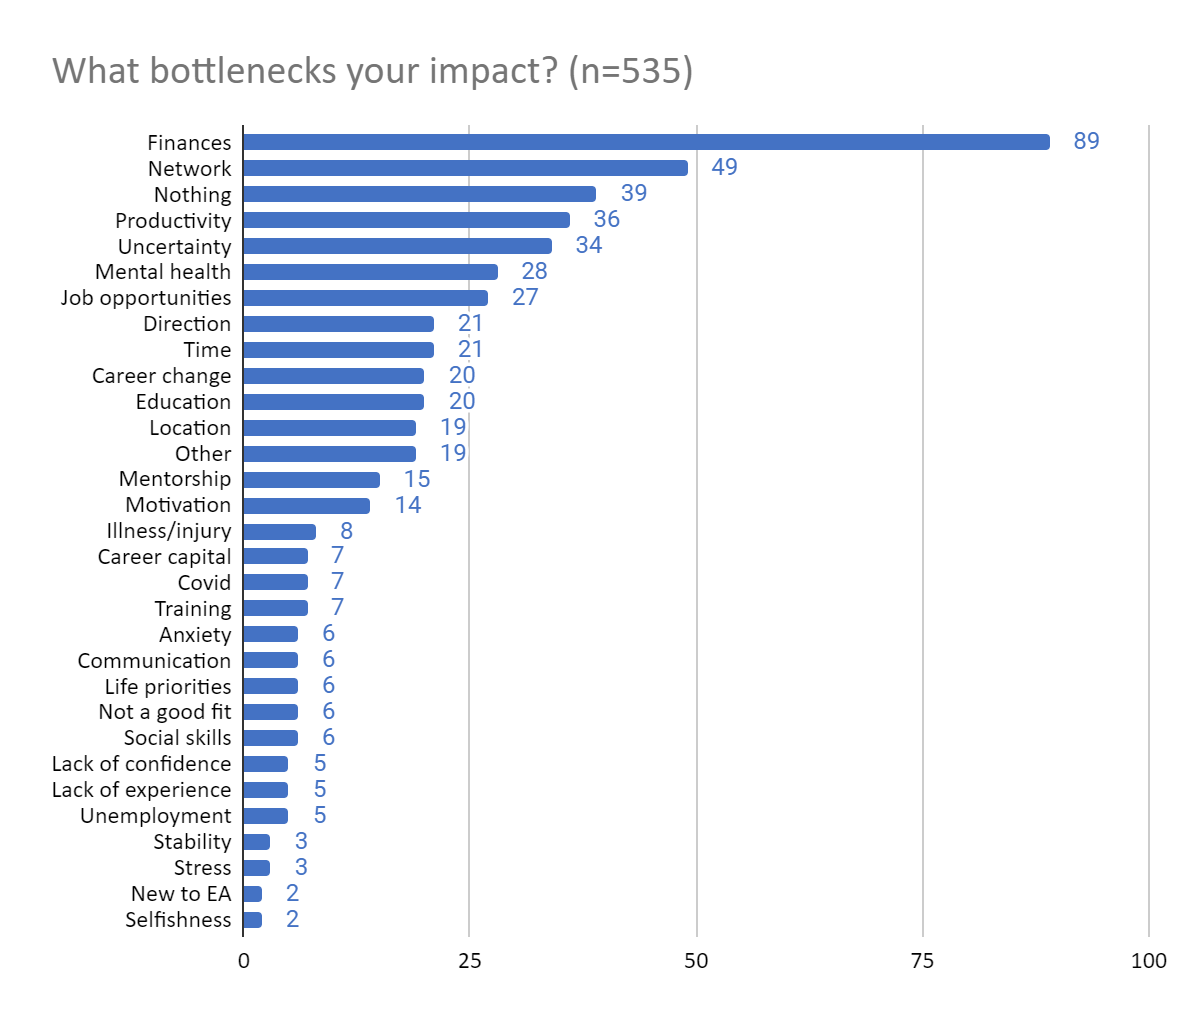
Roughly 25% of survey participants reported some bottleneck affecting their impact in an open comment question.
The most commonly cited hindrances were related to personal/family finance, reduced/low income, or reduction in ability to donate. The second most mentioned bottleneck was lack of an EA/professional network. Inability to focus and be productive was also widely reported. 34 people felt uncertainty about which cause to pursue, where to donate, or what their next career step ought to be. Other bottlenecks reported include mental health, lack of job opportunities, lack of direction for how to apply their professional abilities, lack of time, inability to switch to a more effective career, lack of education, living location, need for a mentor, and lack of motivation.
This year we asked a series of questions potentially broadly related to people’s satisfaction with the EA community. These included:
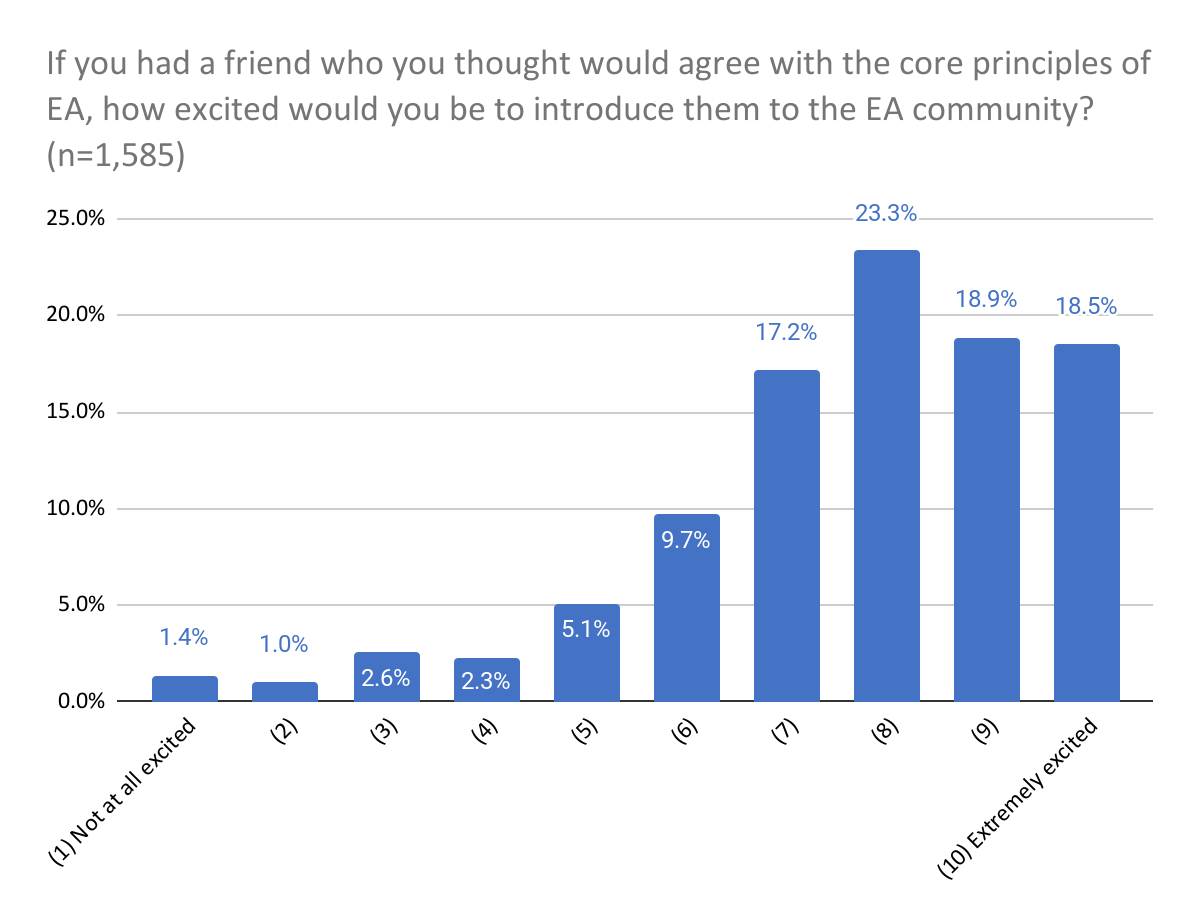
- A Net Promoter Score question which we asked last year about “how excited” the respondent would be to introduce a “friend who you thought would agree with the core principles of EA” to the EA community?
- Two ACSI questions about how well “the EA community compare[s] to your ideal?” and “your overall satisfaction with the EA community”
- Two requested questions, which asked about agreement with the statements “The EA community helps me have more impact, including through recruiting or mentoring other EAs.” and “I feel that I am a part of the effective altruism community.”
Responses to these questions were highly intercorrelated, particularly the two ACSI measures.
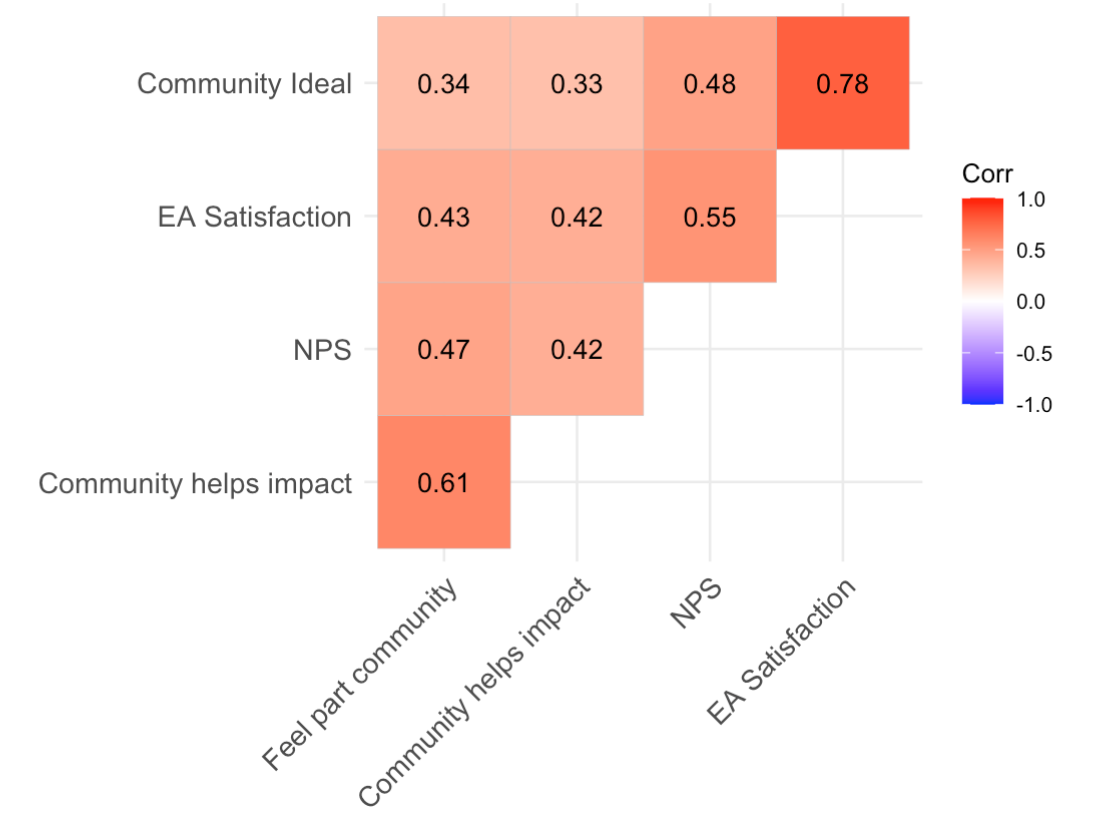
We also conducted exploratory factor analysis, finding that the two ACSI measures strongly loaded onto one factor, the two ‘bespoke’ items loaded onto a second factor, while the NPS item cross-loaded onto both. In a separate followup analysis, we also found that the bespoke measures correlated more strongly with our measure of engagement, than they did with the other satisfaction measures
We have previously criticised the use of NPS measures, especially when explicit “Net Promoter Scores” are calculated, and we suspect the ACSI measures are generally superior as a measure of satisfaction. In a separate analysis, we also found that the two bespoke measures were more strongly associated with engagement (rs=0.5-0.6) than they were with measures of attitudes towards the EA community. As such, we suspect that the two ACSI measures are the best measures of general satisfaction with the EA community.
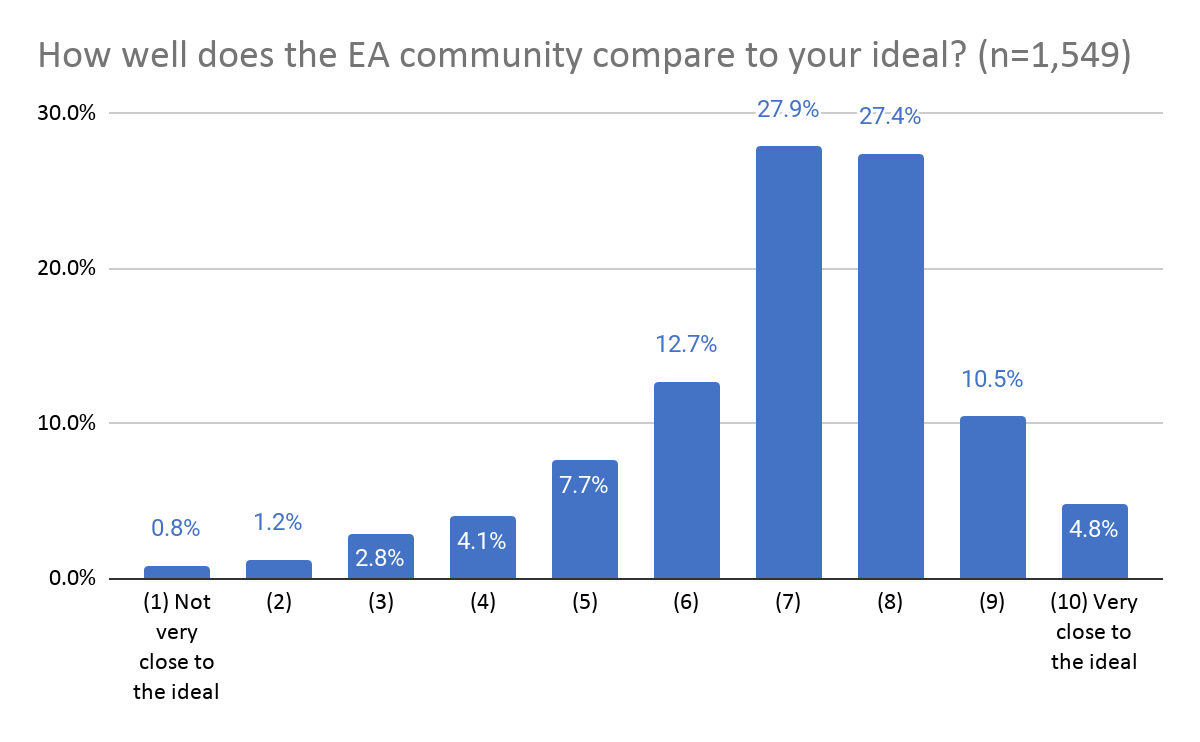
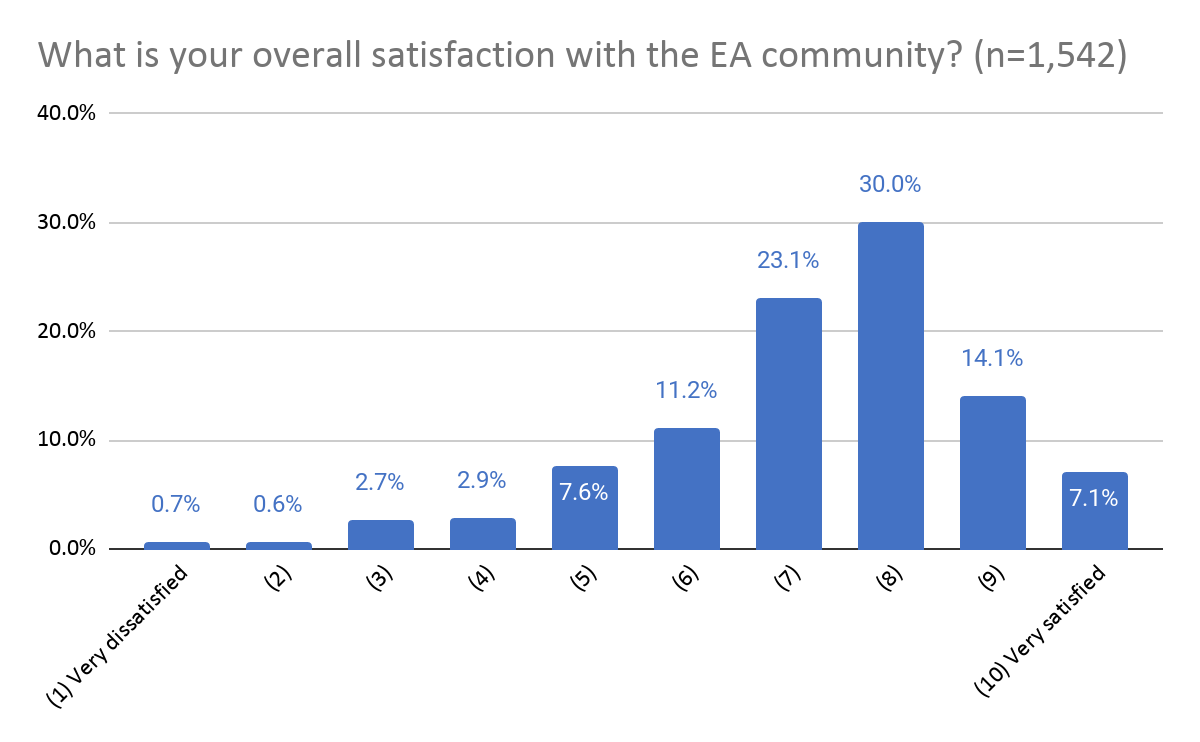
The two individual ACSI items each show similar high levels of reported satisfaction with the EA community.
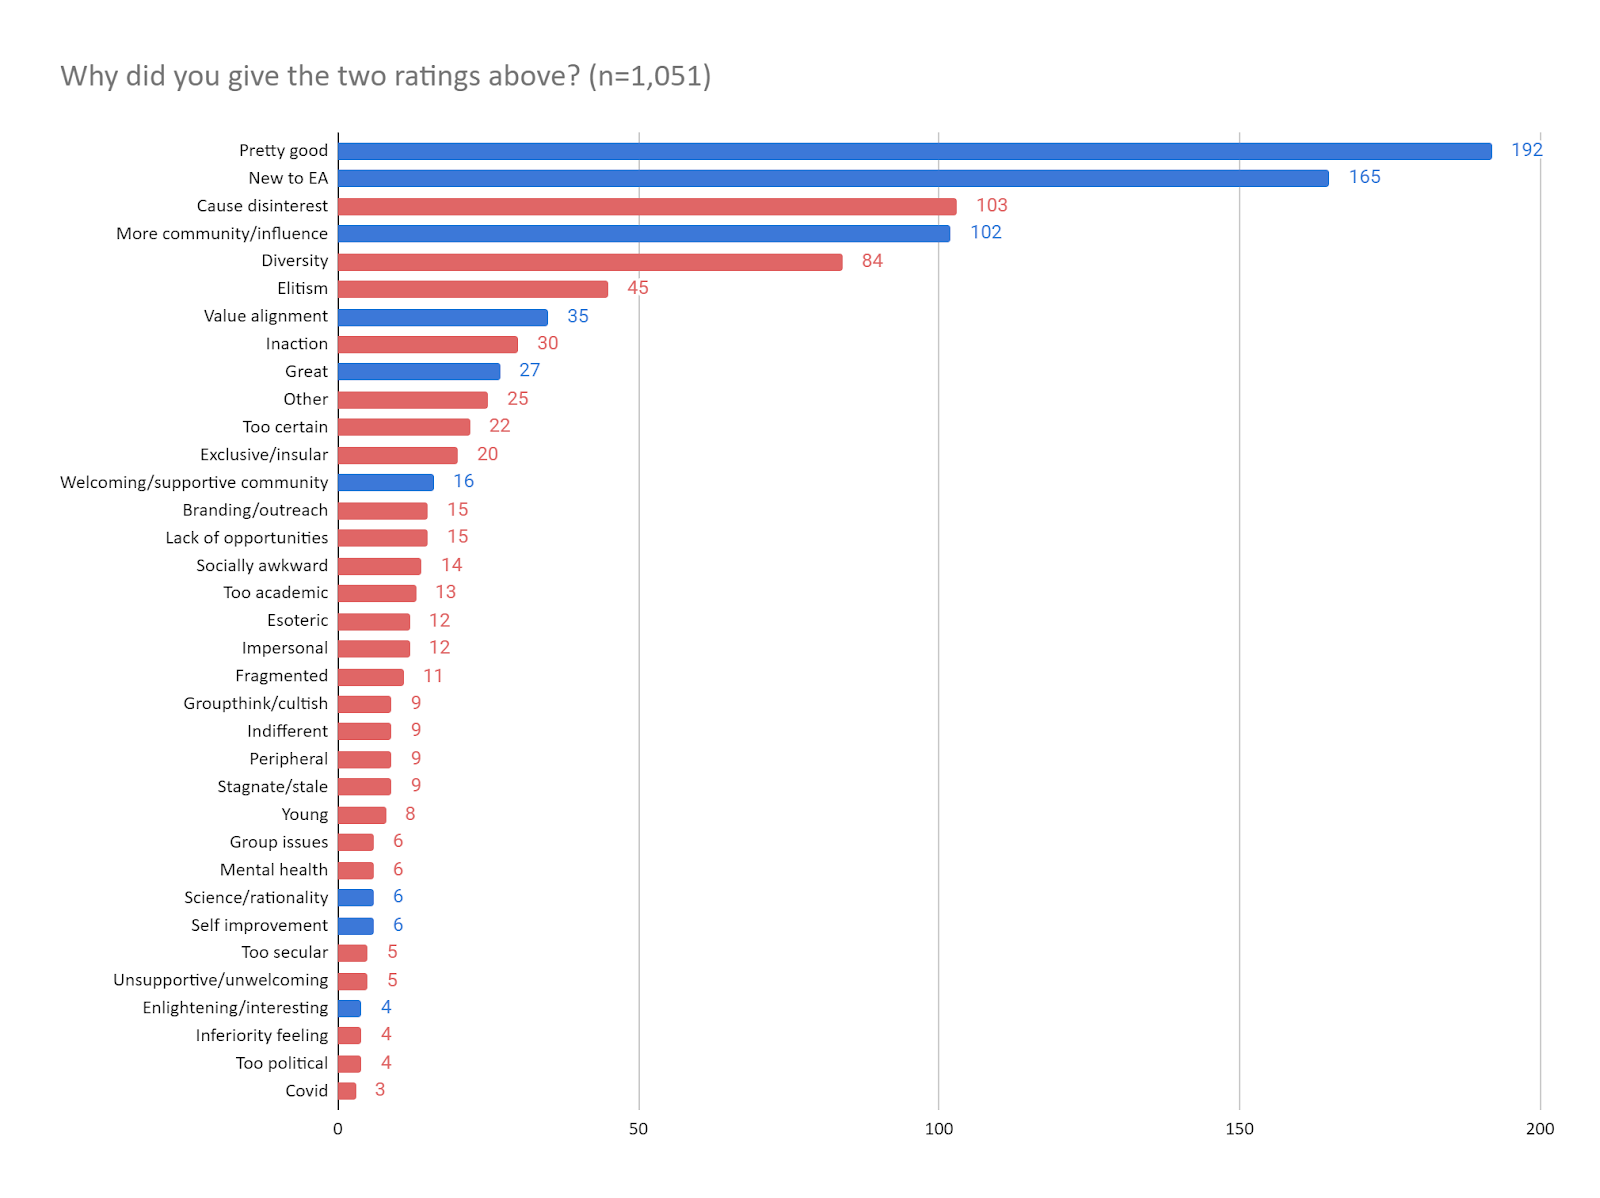
We also provided an open comment box for people to optionally explain the two previous ratings.
Roughly 18% of these responses reported being impressed by the EA community overall, only mentioning some slight negative response.
Almost 16% reported being new to EA or unfamiliar with EA principles and therefore gave a neutral rating.
The two most commonly reported negative reasons for low ratings were a disinterest in EA causes or its current cause prioritization, and a lack of diversity in the EA community. The respondents included both a lack of diversity in gender, racial, and geographic representation, as well as a need for greater diversity of ideologies, practices, and perspectives.
Nearly 10% of replies said they wanted to see the community grow, gain influence, or be more active in their location or area of focus.
Common positive replies included feeling that their values aligned well with EA, that the community is welcoming/supportive, and 2.6% thinking the EA community is great. Other common negative responses were elitism, lack of action on cause areas, EAs being too certain, the community being exclusive/insular, bad branding, and lack of opportunities.
We also provided a separate question about what, if anything, respondents personally disliked about EA. 540 respondents (about a quarter of the sample) responded. The most commonly mentioned factors were elitism, (lack of) diversity or disinterest in the causes most prioritised by EA.
The Net Promoter Score style question about excitement about introducing a friend to EA produced a similar pattern of results to last year. The mean and median scores are, in fact, slightly higher than last year (7.6 vs 7.11, 8 vs 7), though without engaging in a more elaborate analysis looking at the data across years, we can’t rule out this being driven by factors such as differential dropoff (i.e. less satisfied people are less likely to remain in the community and/or complete the EA Survey), rather than a general increase in positivity.
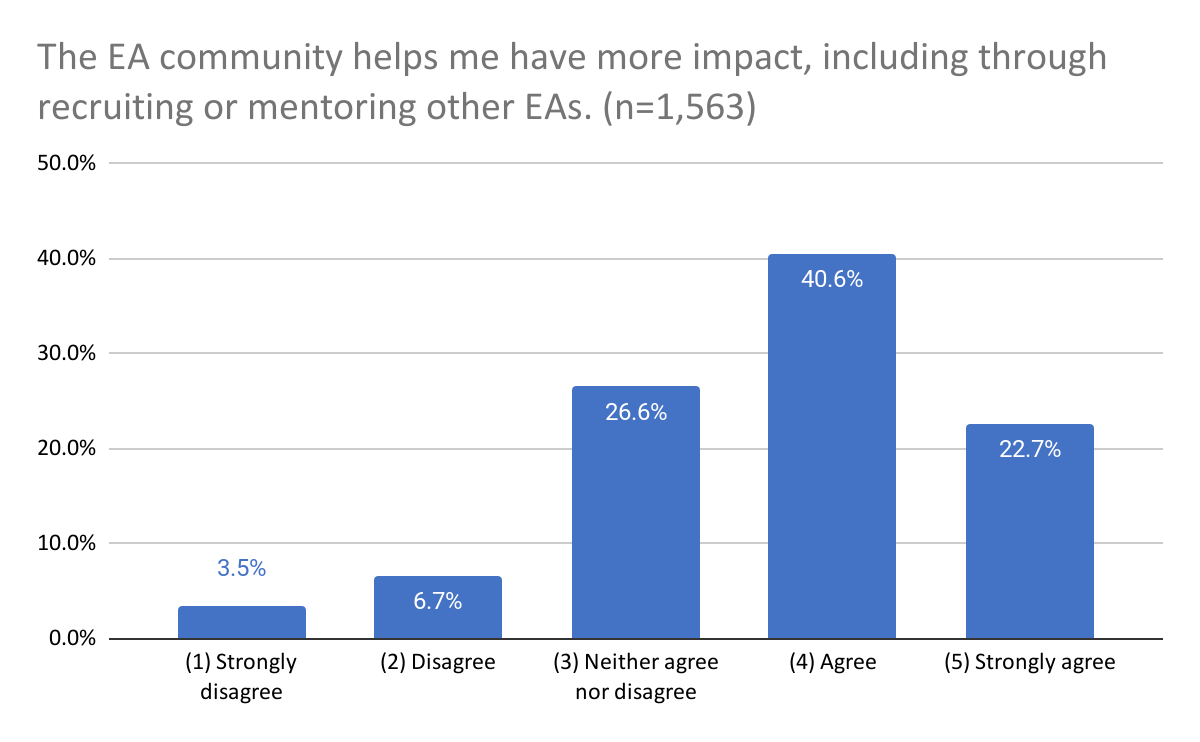
Most respondents (63.3%) reported agreement that the EA community helps them have more impact.
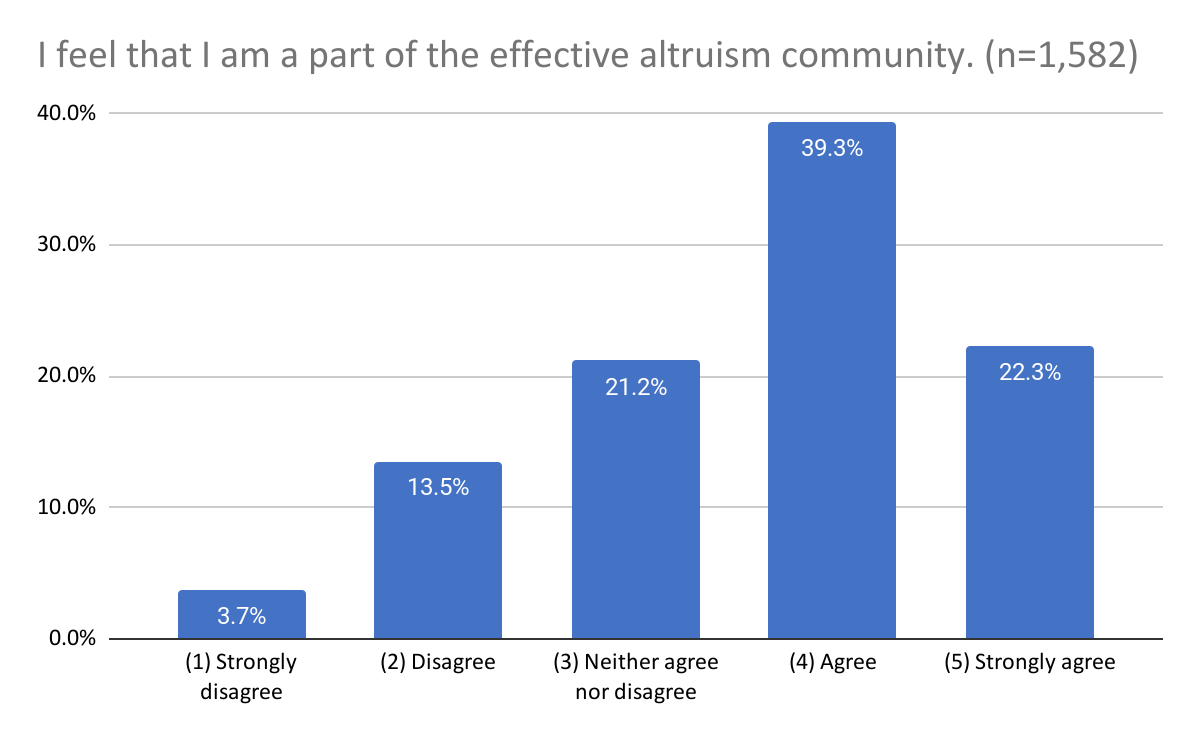
Likewise, a majority (61.6%) reported agreement that they “feel [they are] a part of the effective altruism community.” It’s not entirely clear how this should be interpreted, since it’s not entirely clear what being part of the effective altruism community means, and we suspect respondents may have interpreted this in a wide variety of different ways.
As we noted above, we think the two ACSI measures are generally superior to the NPS, and we don’t have a good sense of what the two other requested measures are measuring, so for our model of satisfaction with EA, we decided to focus solely on the mean score of the two ACSI items.
Predictors of satisfaction: descriptive and causally-suggestive
Ordered logistic models
Here we are not interested in a simple predictive model. We are not trying to 'predict satisfaction' for any selection or planning purpose. Thus 'fitting the data' (or even 'fitting set-aside data') is not the goal.
We want to answer specific questions like "do women tend to be less satisfied, all else equal", with implications for:
The 'all else equal' is also challenging. e.g., in considering whether 'women are less satisfied', do we want to 'control for' income, occupation, or even cause priorities? If we don't control for those, we might be getting at something that is only indirectly related to gender and misses the point. But if we do control for them, we may not be diagnosing the right thing.[4]
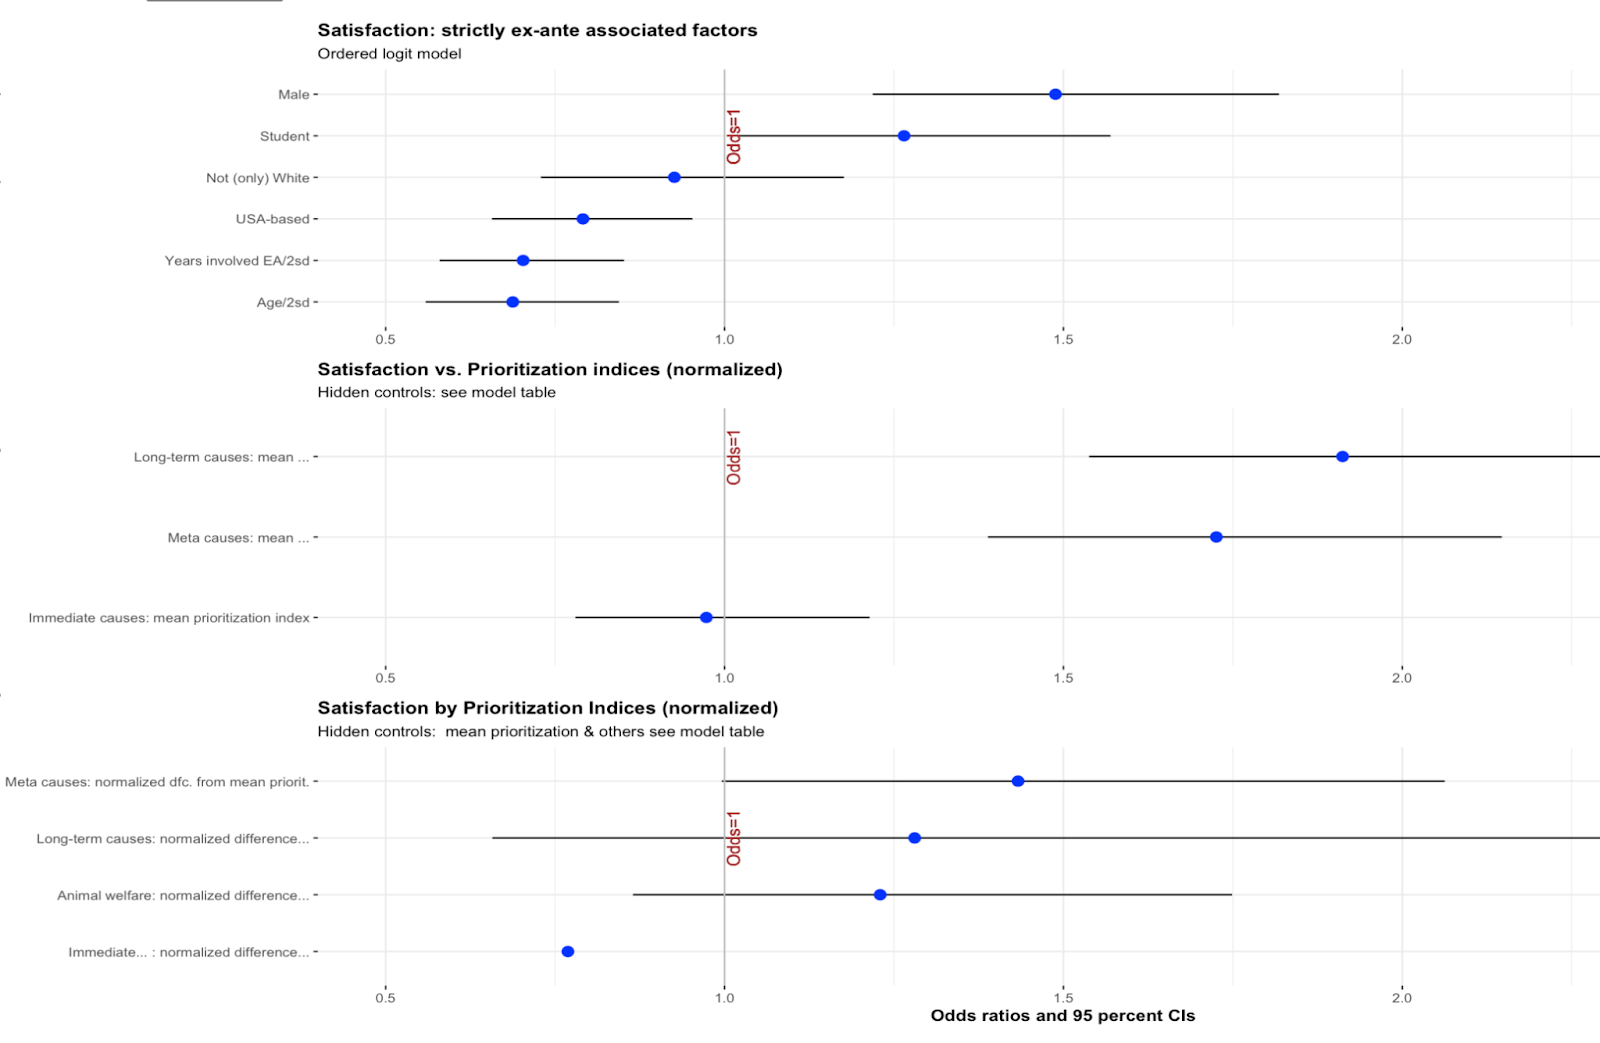
Below, we construct an ordered logit model, reporting the odds ratios – these can be loosely interpreted as the “relative probability of stating a 1 unit higher level of satisfaction”, relative to the base group. e.g., if the coefficient for males is 1.5, this means that, controlling for everything else in the model, comparing any two consecutive levels of satisfaction (2 versus 1, 9 versus 8, etc) males are approximately 50% more likely to be in the higher group.[5]
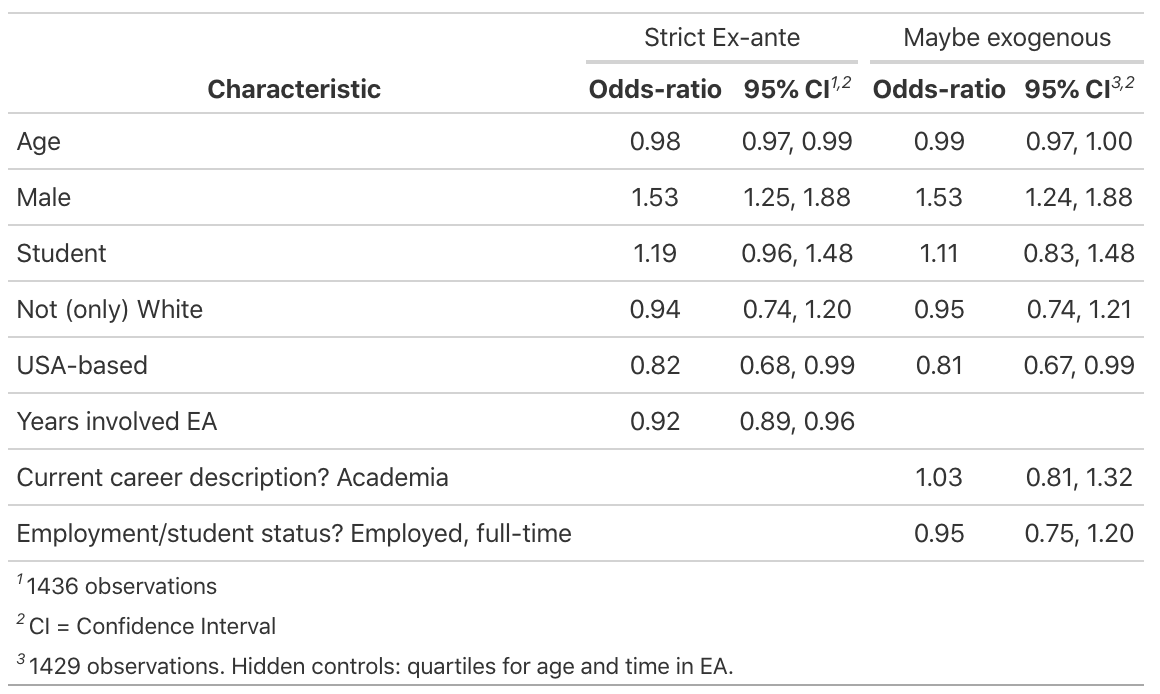
The first ("Strict Ex-ante") columns consider only those 'ex-ante' characteristics that (at least if accurately reported), could not themselves have been influenced by the individual's experience in EA. Still, we are hesitant to give a direct causal interpretation here.[6]
The next columns ("Maybe exogenous") add two characteristics, which, while not entirely ex-ante, are (arguably) unlikely to be substantially impacted by the EA experience, and thus perhaps not vulnerable to reverse-causality issues.[7] As a robustness check, these columns also include (hidden) controls for quartiles (25% percentile groupings) of age and time-in EA. The results here are nearly identical to the first columns.
Holding all else (in the above models) equal:
Note that these relationships also generally persist in the models below, which also include prioritization and 'first-heard' measures.
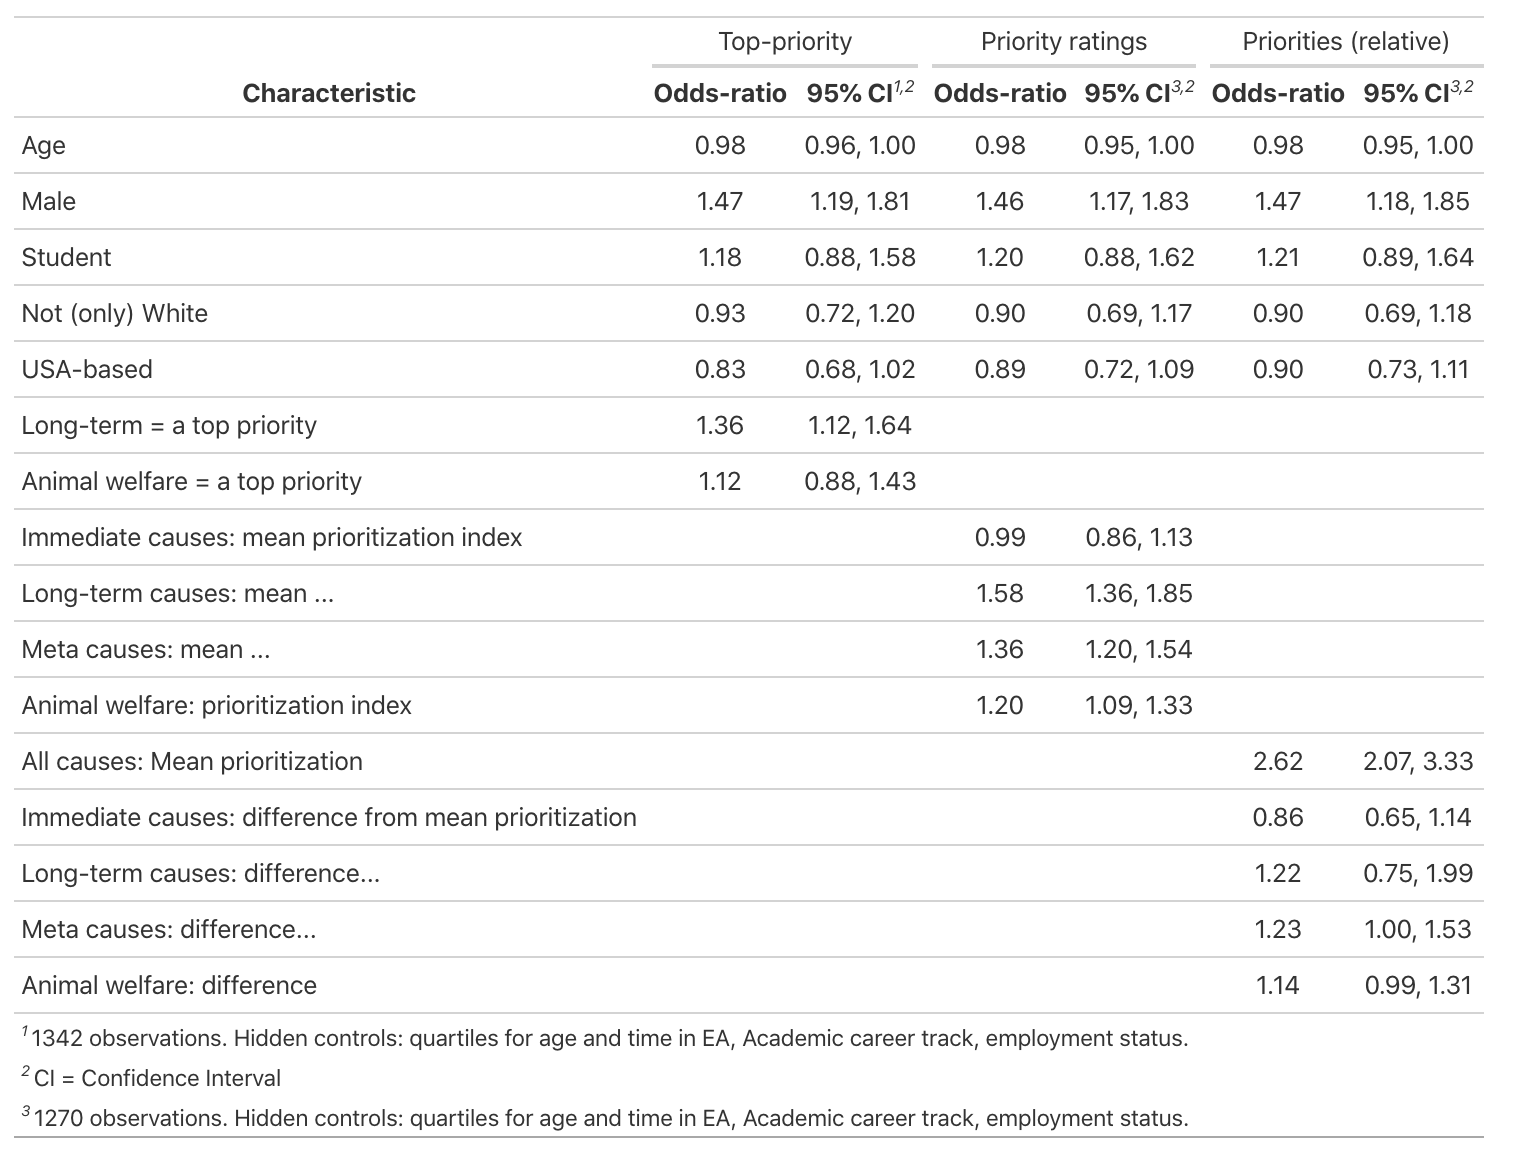
The table above considers the relationship of satisfaction to cause-prioritization, with three distinct approaches.
This model focuses on whether the respondent assigned one of the “long term” (or low-probability and high-risk) causes an importance as high or higher than any of the other non-long-term causes. The long-term causes were defined as Broad longtermism, Existential risks, AI risks, Biosecurity/pandemic preparedness, and Nuclear security. The single "Animal welfare..." category is treated similarly.
Here we focus on the simple relationship between the 'prioritization score' assigned a numerical value ranging from 1 (for "I do not think any resources should be devoted to this cause") to 5 (for "I think this cause should be the top priority). We construct several indices for each person averaging this score across…
Summarizing the results of these above models:
As above, these models suggest that 'males are more satisfied', 'older people are less satisfied', and 'US-residents are less satisfied', holding other things equal.
Below, we also consider whether satisfaction differs among those 'first hearing of EA' from EA from distinct sources. This might indicate differences in the extent to which each source, as a 'path towards EA' is driving satisfaction. However, the potential for differential selection makes us reluctant to infer this to be a causal relationship.
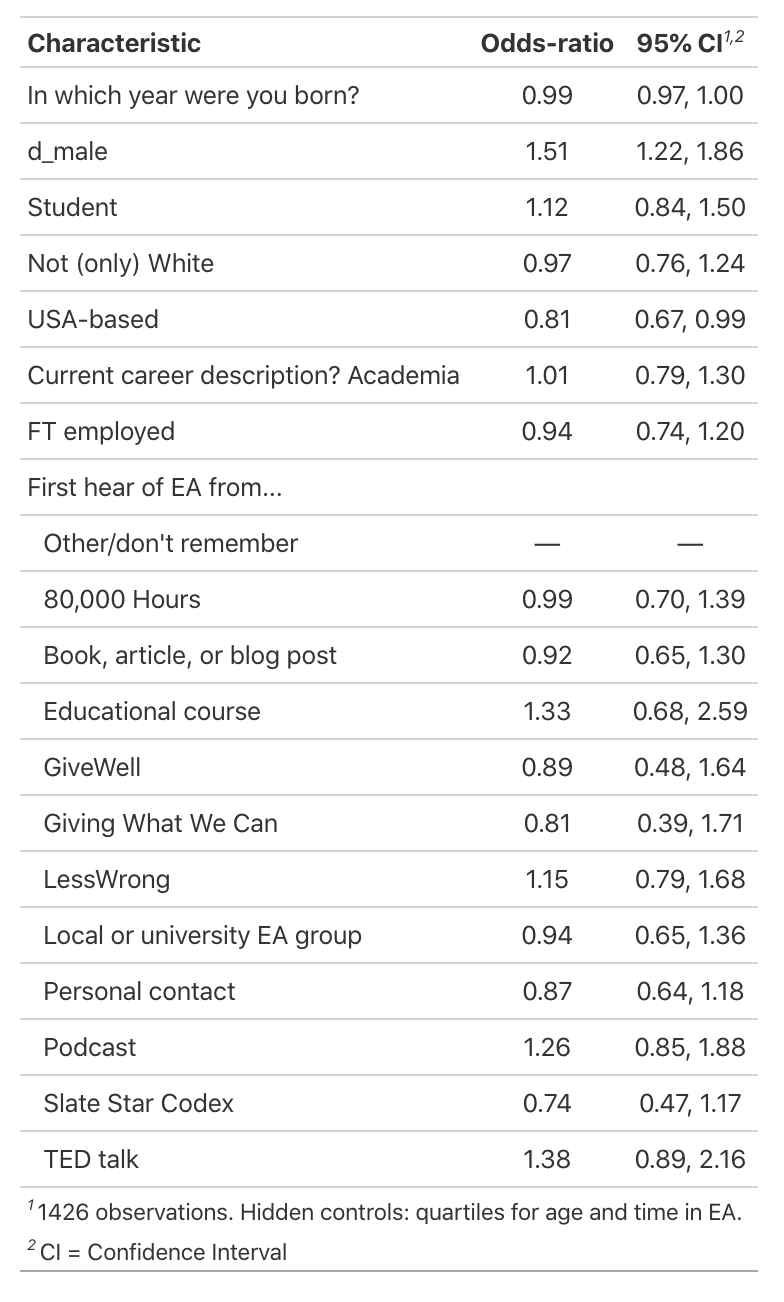
As these group sizes are fairly small (see the 'how involved in EA' post), we have limited ability to make inferences about these differences.
While those who heard of EA from some sources, such as TED talks, educational courses, and podcasts seem to be somewhat more satisfied, the confidence intervals are rather wide. None are individually significant by standard statistical measures, nor are the 'first hear' coefficients jointly significant in a likelihood-ratio/Chi-sq test (p=0.50).[11]
To compare the magnitude of the key coefficients, the continuous explanatory variables are scaled by two standard deviations so as to be comparable to the coefficients on binary variables (see Gelman (2008)). In this table and set of plots, we only show the strict ex-ante, priority ratings and priority (relative) models, dropping the top priority column (though this showed similar results).
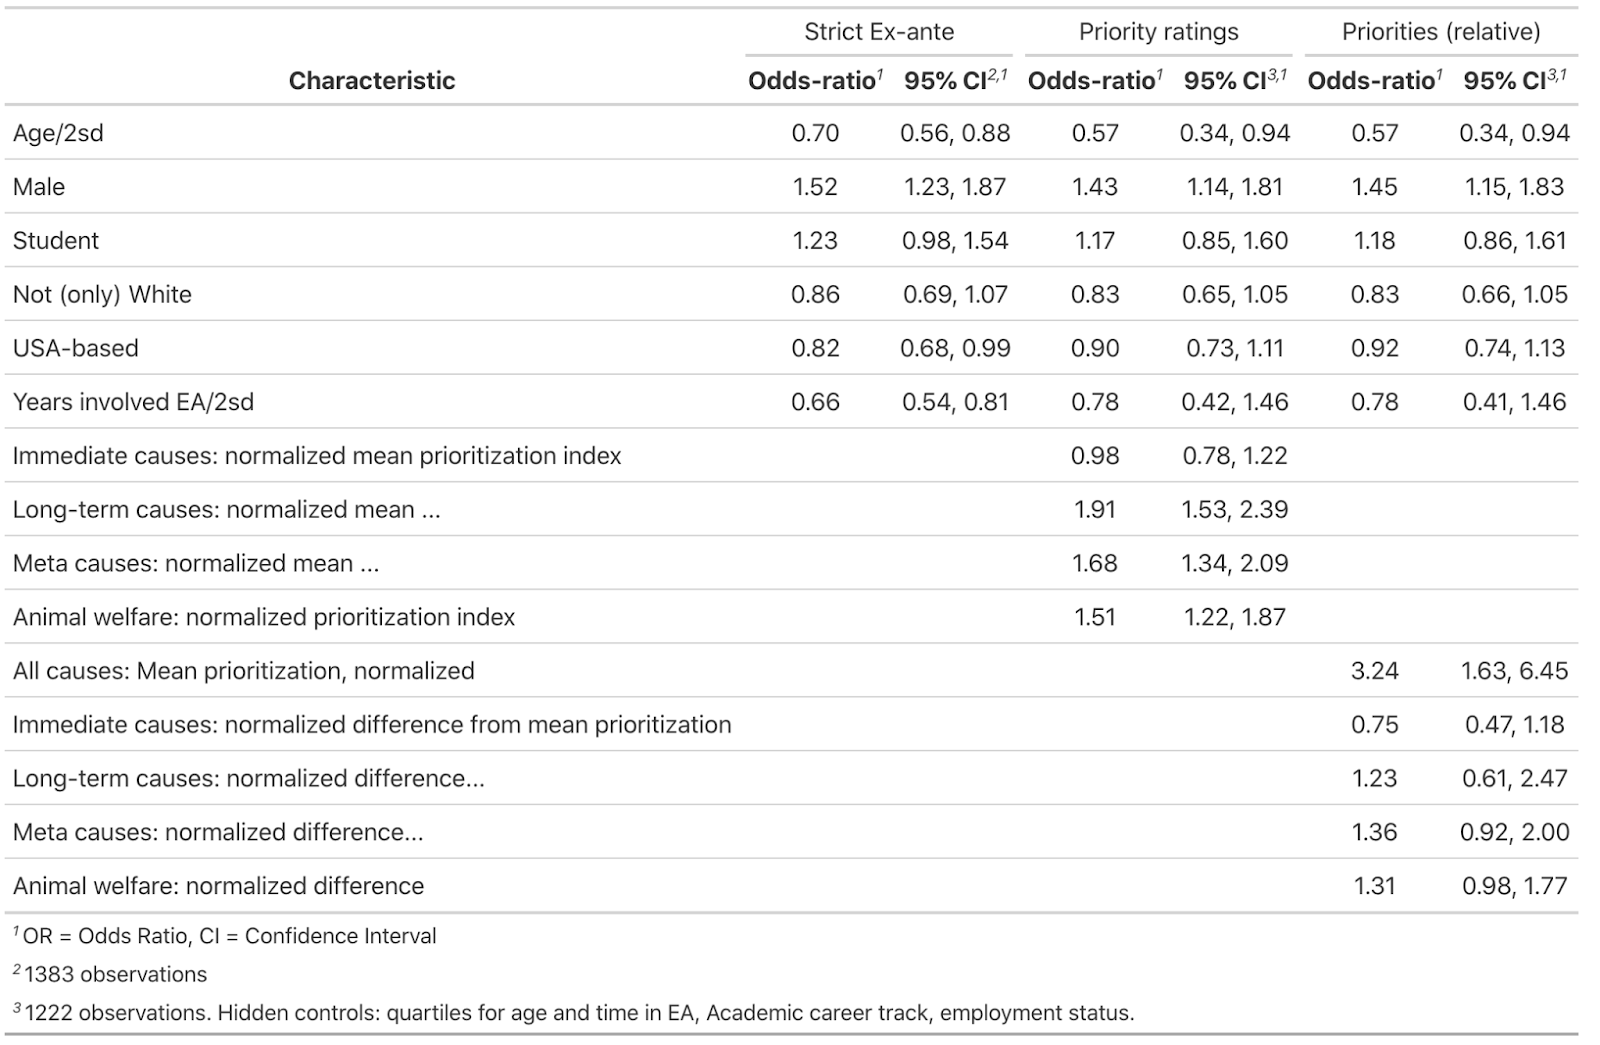
We present tree plots to visualize this. You can view a full size version of this by opening the image in a new tab.
As a robustness check (and arguably, for easier interpretation), we present simple linear models (rather than ordered logistic models) with some of the same sets of variables as above. This implicitly treats the satisfaction measure as if it were a cardinal measure.
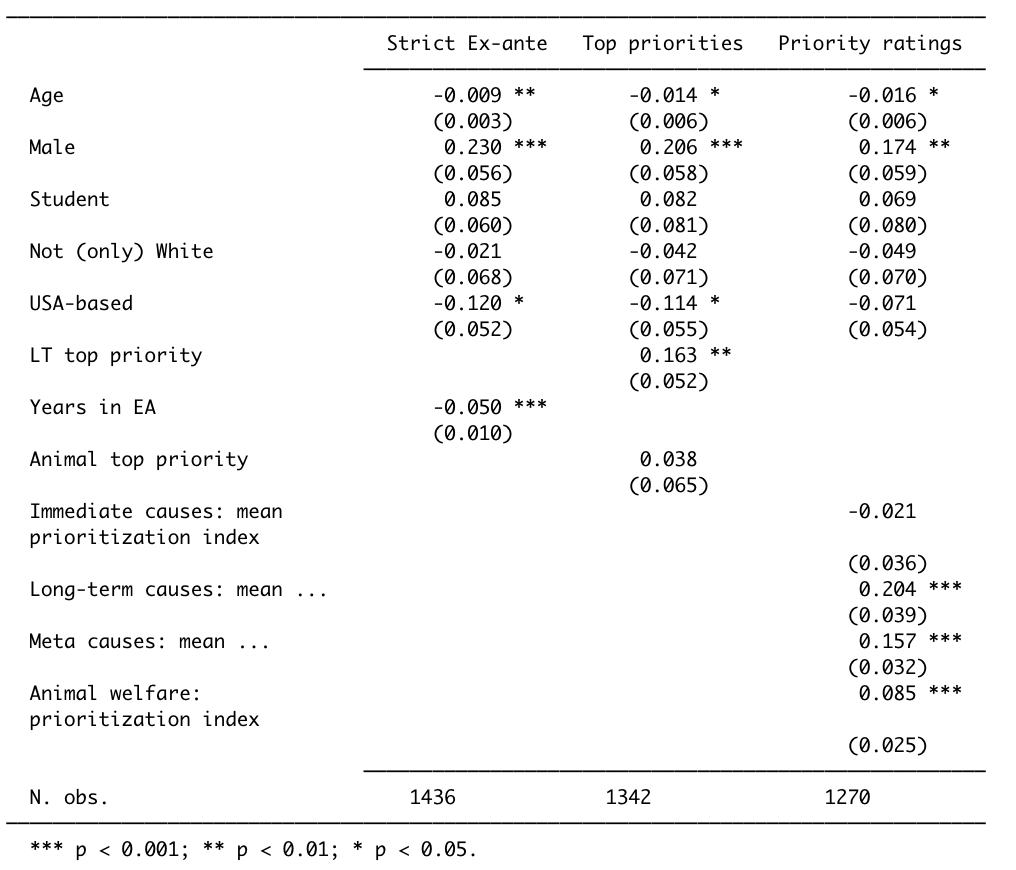
Recall that the outcome variable– the averaged satisfaction measure–is standardized (to have mean 0 and standard deviation 1). Thus the coefficients can be directly interpreted as 'fractions of a standard deviation’ impact.
The three columns in the table above use the same right-hand-side variables as in the earlier (ordered logit) table, and results are similar. Again male gender and putting a high priority rating on long-term causes or meta causes (and to a lesser extent, animal welfare) are associated with greater satisfaction, while age, years in EA, and living in the USA are associated with lower satisfaction.

The annual EA Survey is a project of Rethink Priorities. This post was written by David Moss, David Reinstein and Jacob Schmiess. Thanks to Peter Wildeford, Ben West and Ben Todd for comments.
We would also like to express our appreciation to the Centre for Effective Altruism for supporting our work. Thanks also to everyone who took and shared the survey.
If you like our work, please consider subscribing to our newsletter. You can see all our work to date here.
We think this is generally superior, as we suspect this better allows us to capture real differences in the number of factors that are important to different respondents, and we have some evidence that the number of factors selected varies systematically across different kinds of respondents). ↩︎
As in our other reports, respondents who selected any response option other than white are categorised as ‘not exclusively white’, even if they also selected white, and contrast this with respondents who only selected white as their racial identity. This is so as to ensure that respondents who select at least one non-white response option, as may be the case for mixed race respondents, are classified as ‘not exclusively white’ rather than ‘white’ (though of course, we cannot guarantee that such respondents identify as ‘white’ or ‘non-white’). ↩︎
Some caveats: This may not tell us what causes overall satisfaction with EA, nor even the extent to which the stated levels of satisfaction are important intermediate drivers of satisfaction. Individuals who are less satisfied in certain areas may differ systematically from others in both observable and unobservable ways. E.g., people with a highly-positive demeanor might be particularly likely (A) to report they "agree: I feel that I am a part of the effective altruism community" and might also (B) report high levels of overall satisfaction with EA. But (A) need not be the cause of (B); (A) and (B) may simply be picking up particular personality traits that we cannot control for using other response data. ↩︎
Perhaps analogously, in considering wage differentials between men and women, one might consider controlling for physical strength, or perhaps for differences in verbal ability. But the former tends to be systematically lower in women (for biological reasons), and the latter seems to be systematically higher for females. If we 'control' for each of these, we may not get a good descriptive picture of the wage differences between similar men and women, as we are eliminating a channel that may be an inherent part of the 'gender' characteristic we are interested in. ↩︎
Note that the ordered logit model imposes a particular functional form: a variable must have proportional relative 'effect' on the probability of being in a higher versus a lower category, with this proportional 'effect' being the same between any comparison of adjacent categories. ↩︎
Differential selection and attrition may drive observed associations. e.g., less satisfied groups may have been relatively less likely to join EA or complete the survey, or dropped out relatively more. The relationship may also be driven by unobserved mediators. e.g. certain groups may tend to be happier people and thus report higher satisfaction. ↩︎
In other models, not shown, we also considered income (without imputing values where this was missing); this reduced our sample size considerably but seemed to have a near-zero relationship with satisfaction. ↩︎
Although we focused on the US in these models due to it being the largest population grouping, the US had similar mean satisfaction to the UK. We will discuss descriptive variation in satisfaction levels more in our Geography post. ↩︎
We can separately identify 'age' coefficients and 'tenure in EA' coefficients here as people joined EA at different ages. However, the interpretation is challenging, particularly if we allow for both age, period, cohort, and tenure effects. Note that these are not standardized coefficients so the ‘size’ of the effects are not comparable to the binary coefficients; we report a standardized version in graphs below. ↩︎
These specific categorisations were generated by Exploratory Factor Analysis which we conducted (not shown here), though also seem to match a priori intuitive categorisations. ↩︎
Nor are the 'learning-related' (podcast, TED, Educational course, Book+) coefficients jointly significant. Details of testing available by request. Further work could explore this through: 1. clustering meaningful groups of first-involvers to increase the statistical power 2. In a Bayesian context to make reasonable inferences about the extent to which some groups are more satisfied than others, overall. ↩︎
This was very insightful. Thanks to everyone that made the survey and this write-up possible.
Do you have more information about how personal/family finance as a bottleneck for impact is to be understood? e.g.
It would be great to see this in more detail in the next survey given the prevalence of the bottleneck.
Thanks!
Unfortunately, the majority of people's open comments didn't provide more detail beyond something like "financial constraints" or "low income." Among the minority of comments which did offer more detail, the specific thing most often mentioned was simply that people could donate more if they had more money. Freedom to explore different options, switch career, spend more time on high-impact work, and stress related to money were all mentioned by ~ a couple of people.