Summary
- Gender
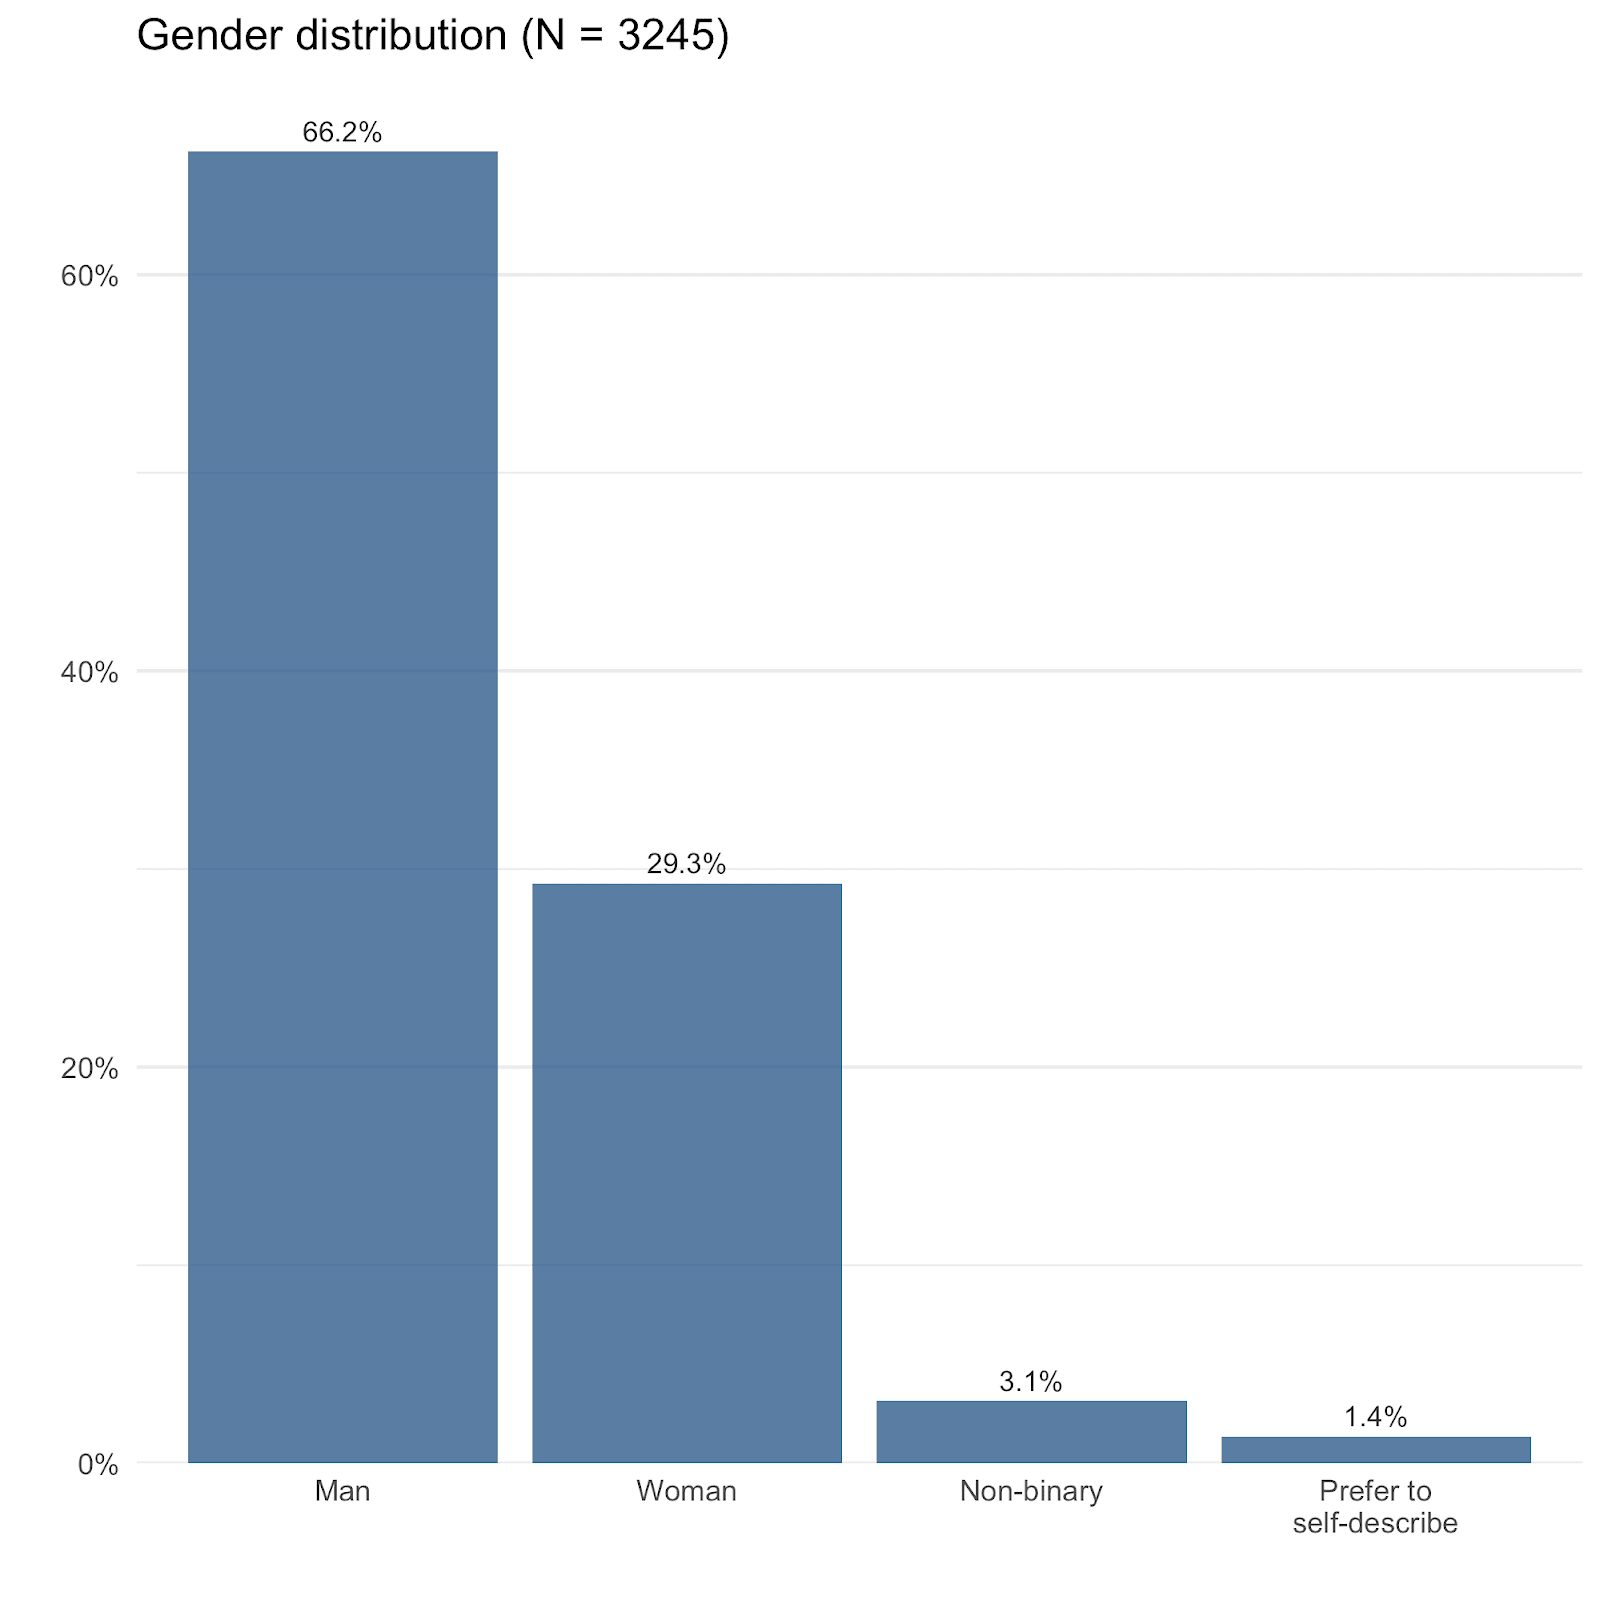
- Since 2020, the percentage of women in our sample has increased (26.5% vs 29.3%) and the percentage of men decreased (70.5% vs 66.2%).
- More recent cohorts of EAs have lower percentages of men than earlier cohorts. This pattern is compatible with either increased recruitment of women, non-binary or other non-male EAs in more recent years and/or men being more likely to drop out of EA.
- We examine differences between cohorts across years and find no evidence of significant differences in dropout between men and women.
- Race/ethnicity
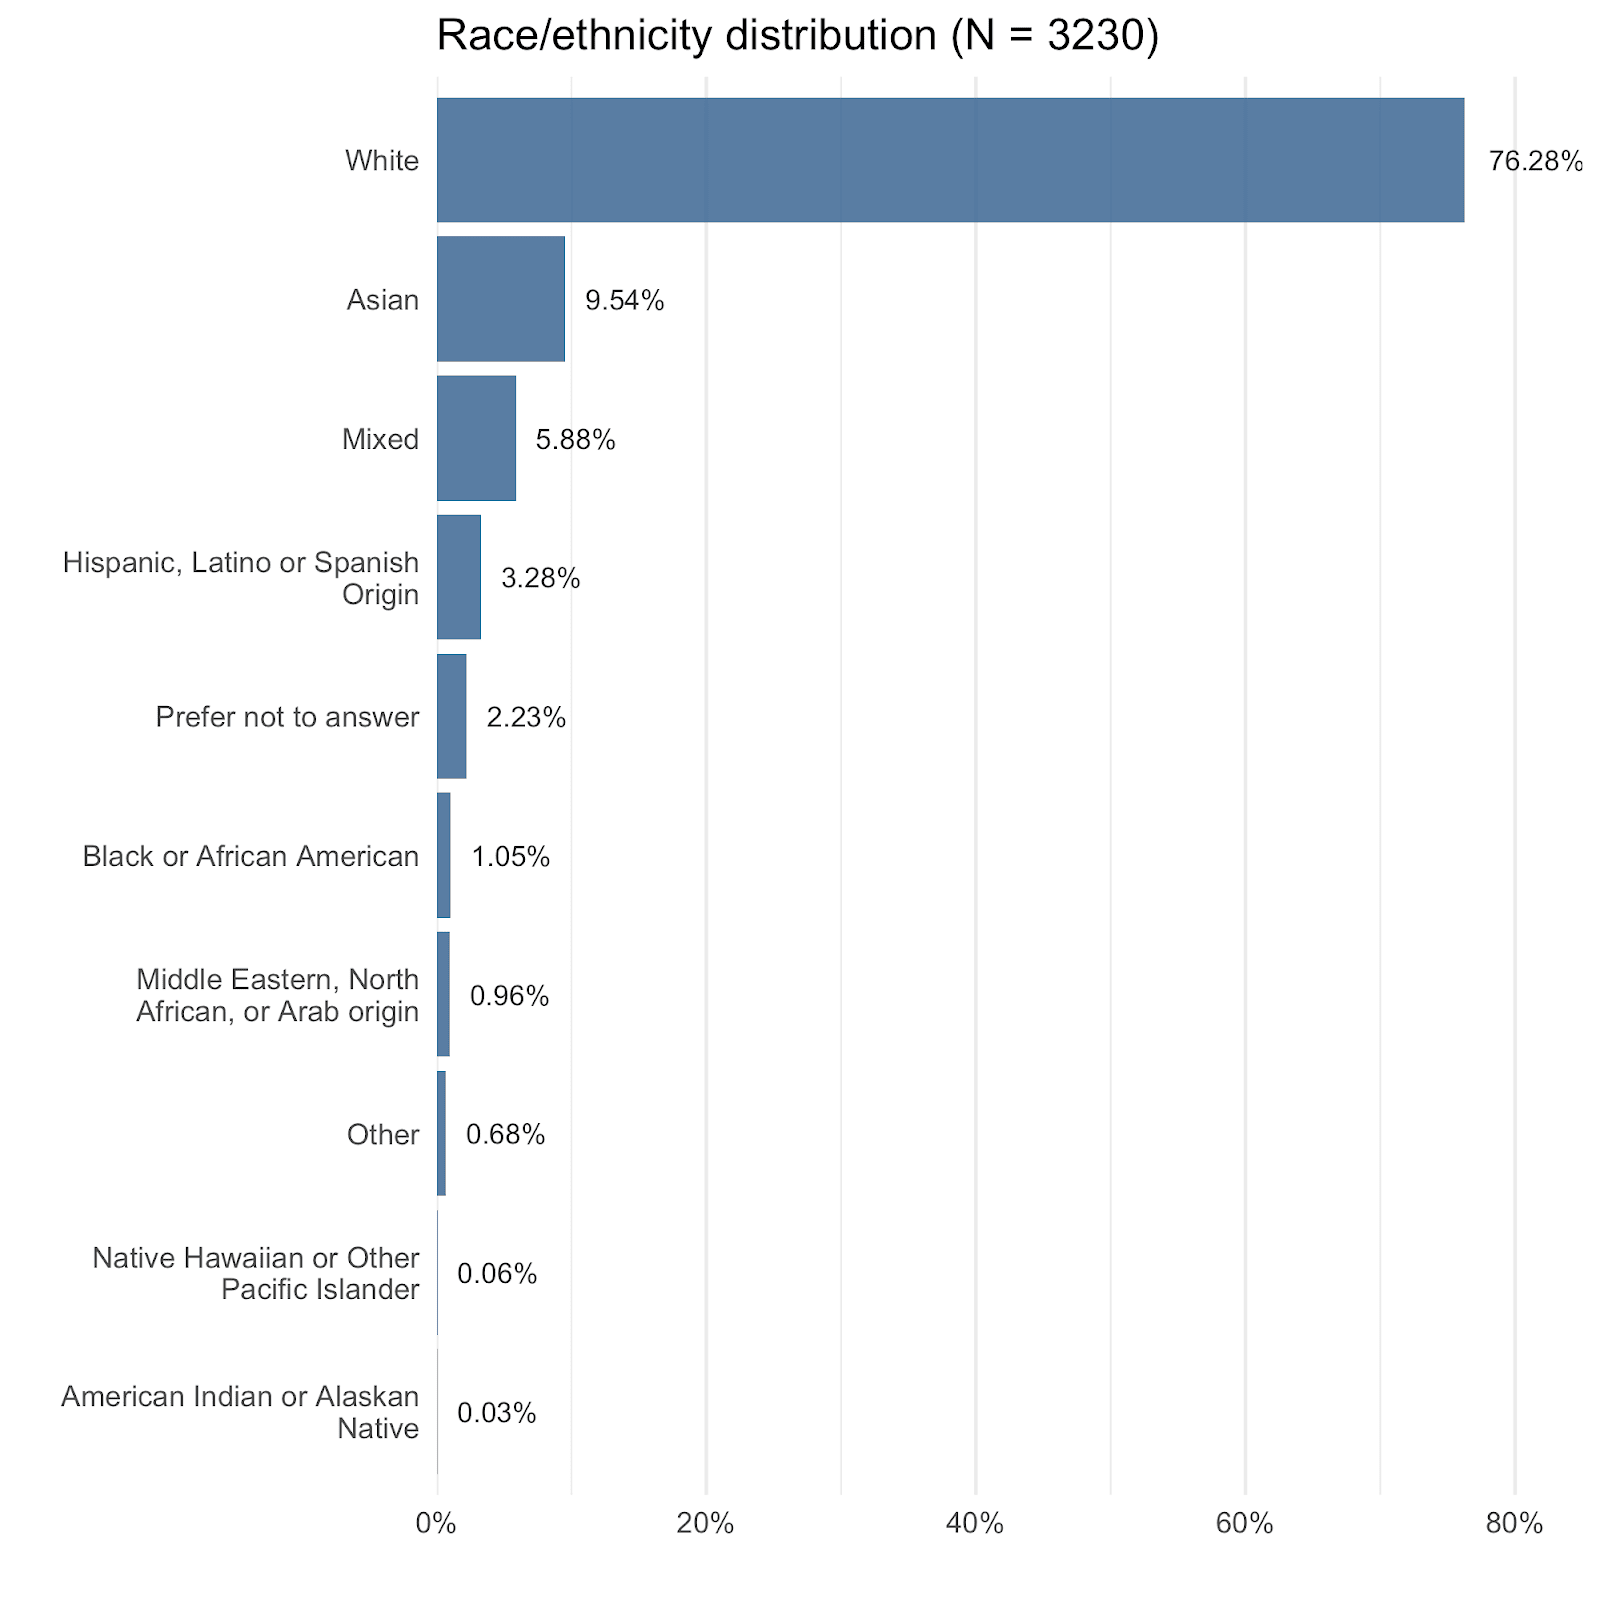
- The percentage of white respondents in our sample (76.26%) has remained fairly flat over time.
- More recent cohorts contain lower percentages of white respondents (compatible with either increased recruitment and/or lower dropout of non-white respondents).
- We also examine differences between cohorts across years for race/ethnicity, but do not find a consistent pattern.
- Age
- The average age at which people first get involved in EA (26) has continued to increase.
- Education and employment
- The percentage of students in the movement has decreased since 2020 and the percentage in employment has increased. However, just over 40% of those who joined EA in the last year were students.
- Universities
- 11.8% of respondents attended the top 10 (QS) ranked universities globally.
- Career strategies
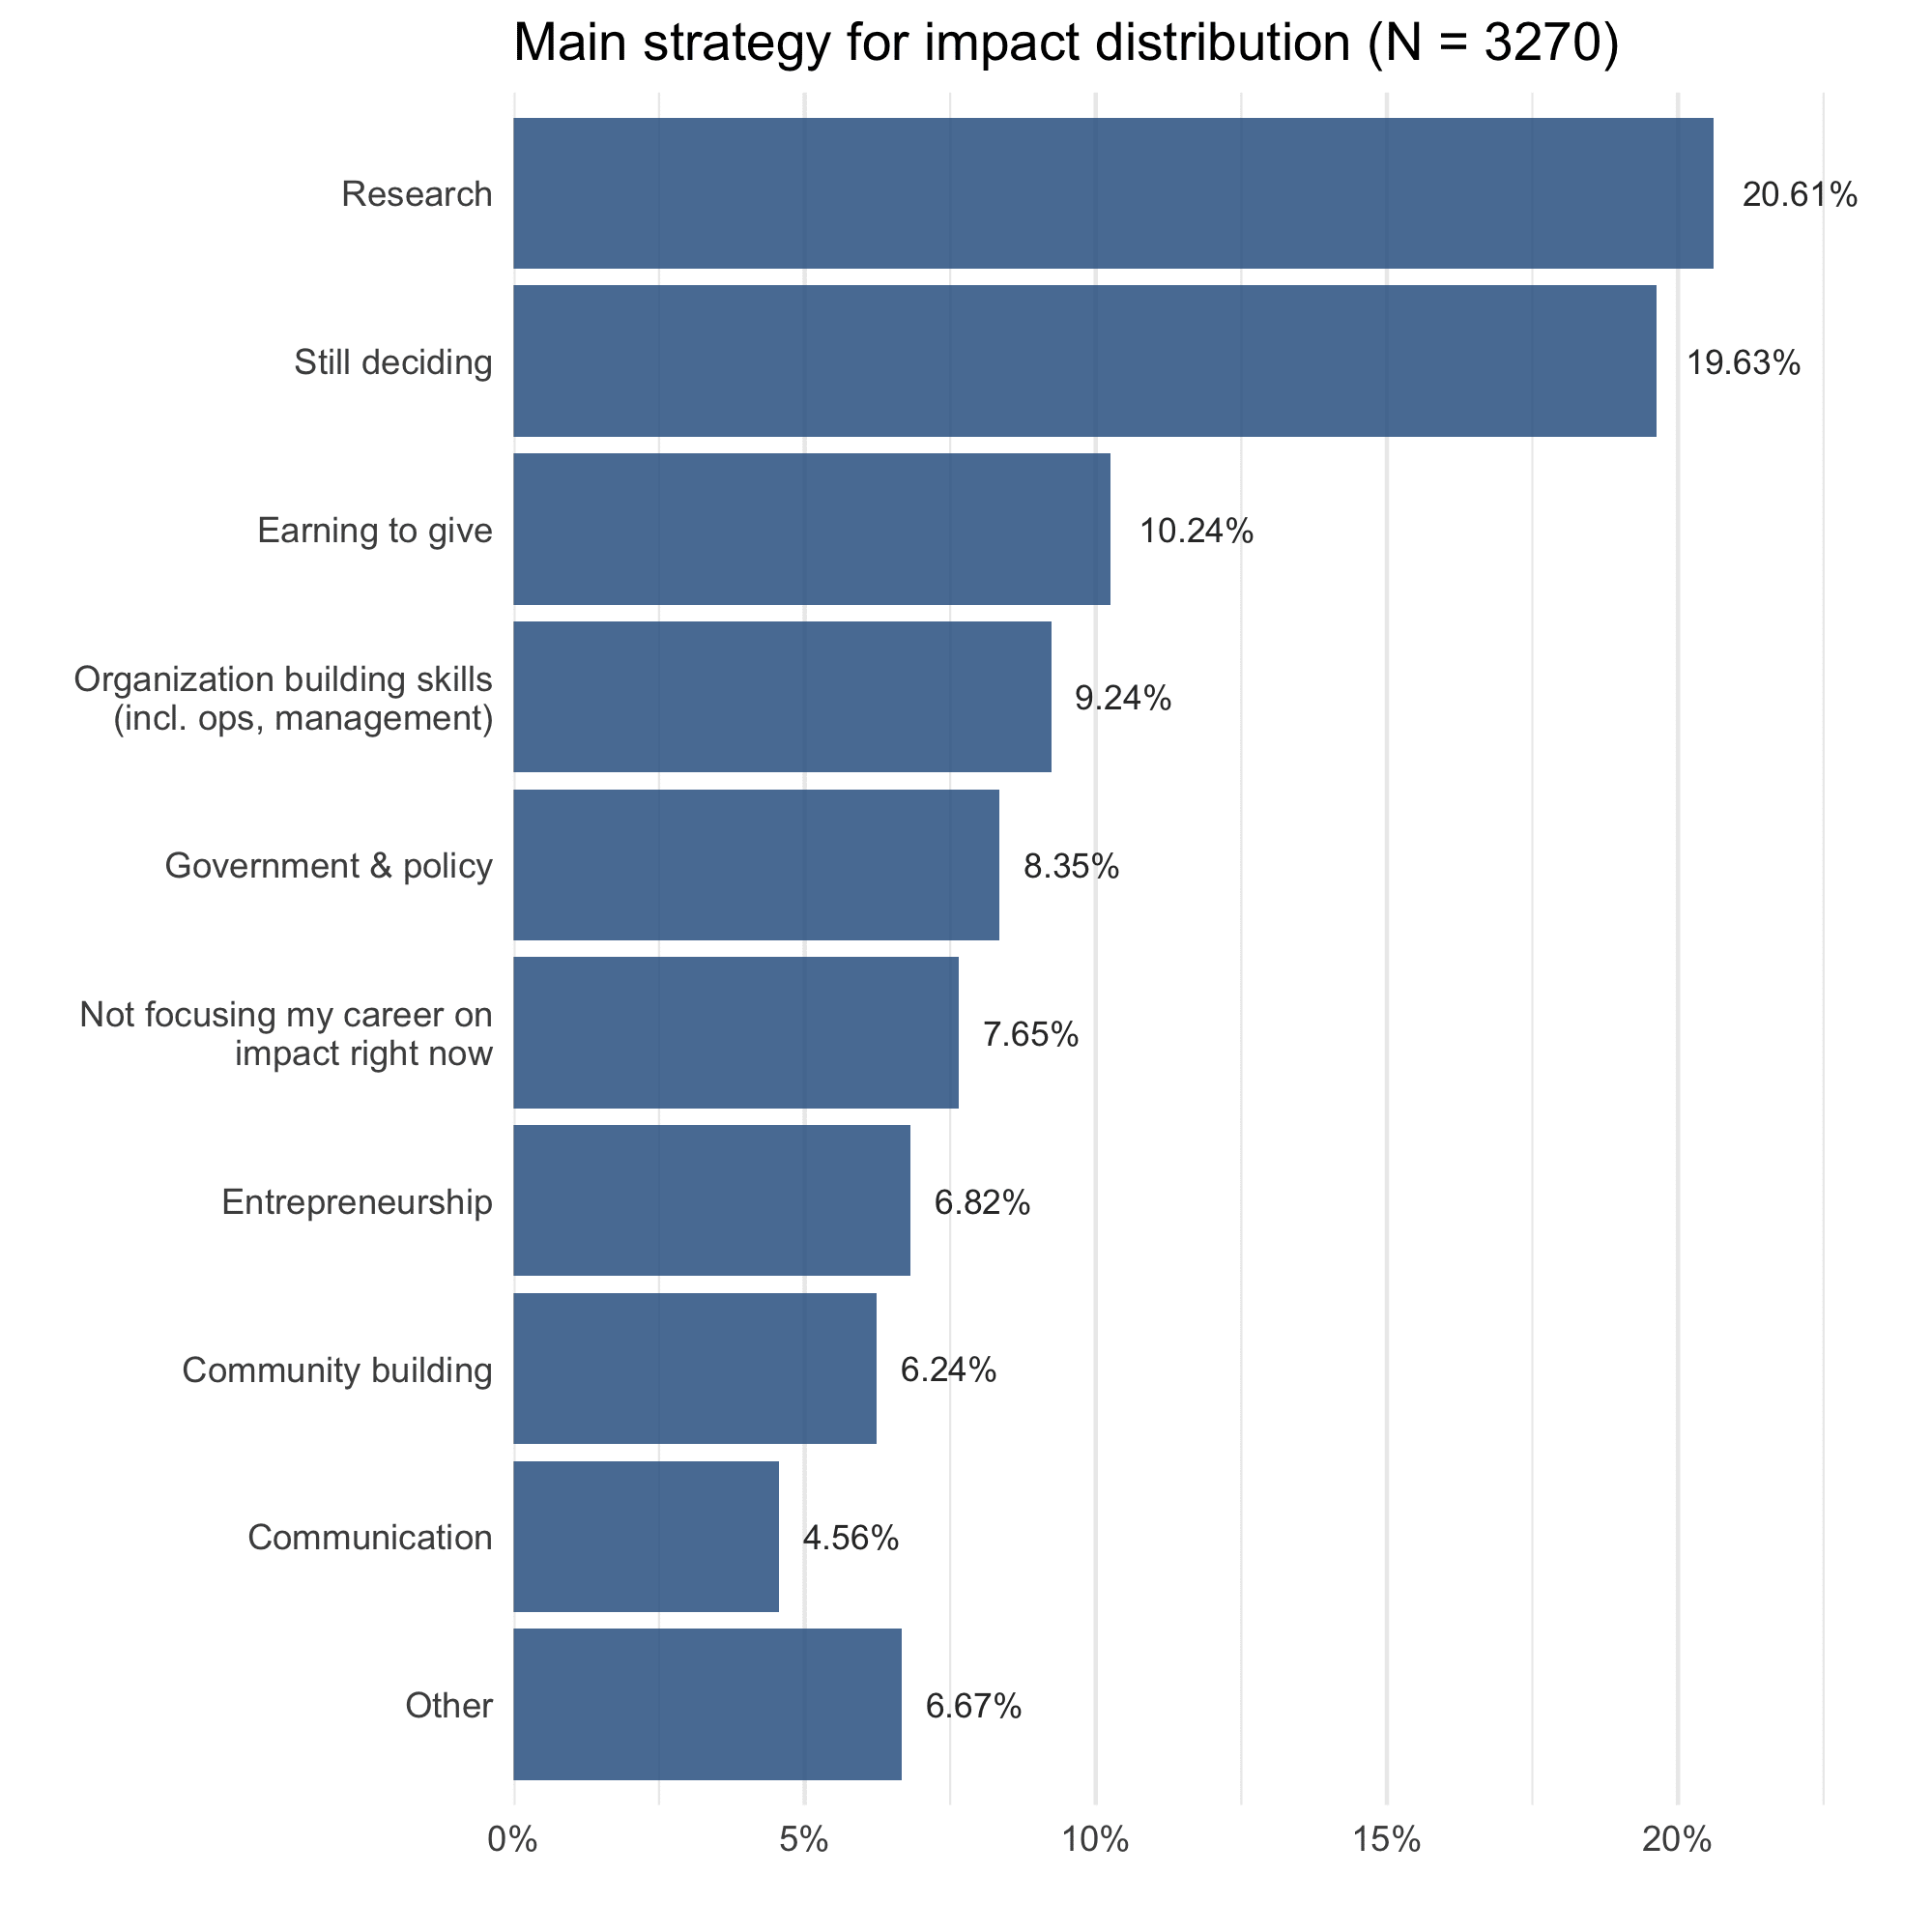
- The most commonly cited strategy for impact in one’s career was ‘research’ (20.61%) followed by ‘still deciding’ (19.63%).
- More than twice as many respondents selected research as selected ‘earning to give’ (10.24%), organization-building skills (ops, management), government and policy, entrepreneurship or community building (<10% each).
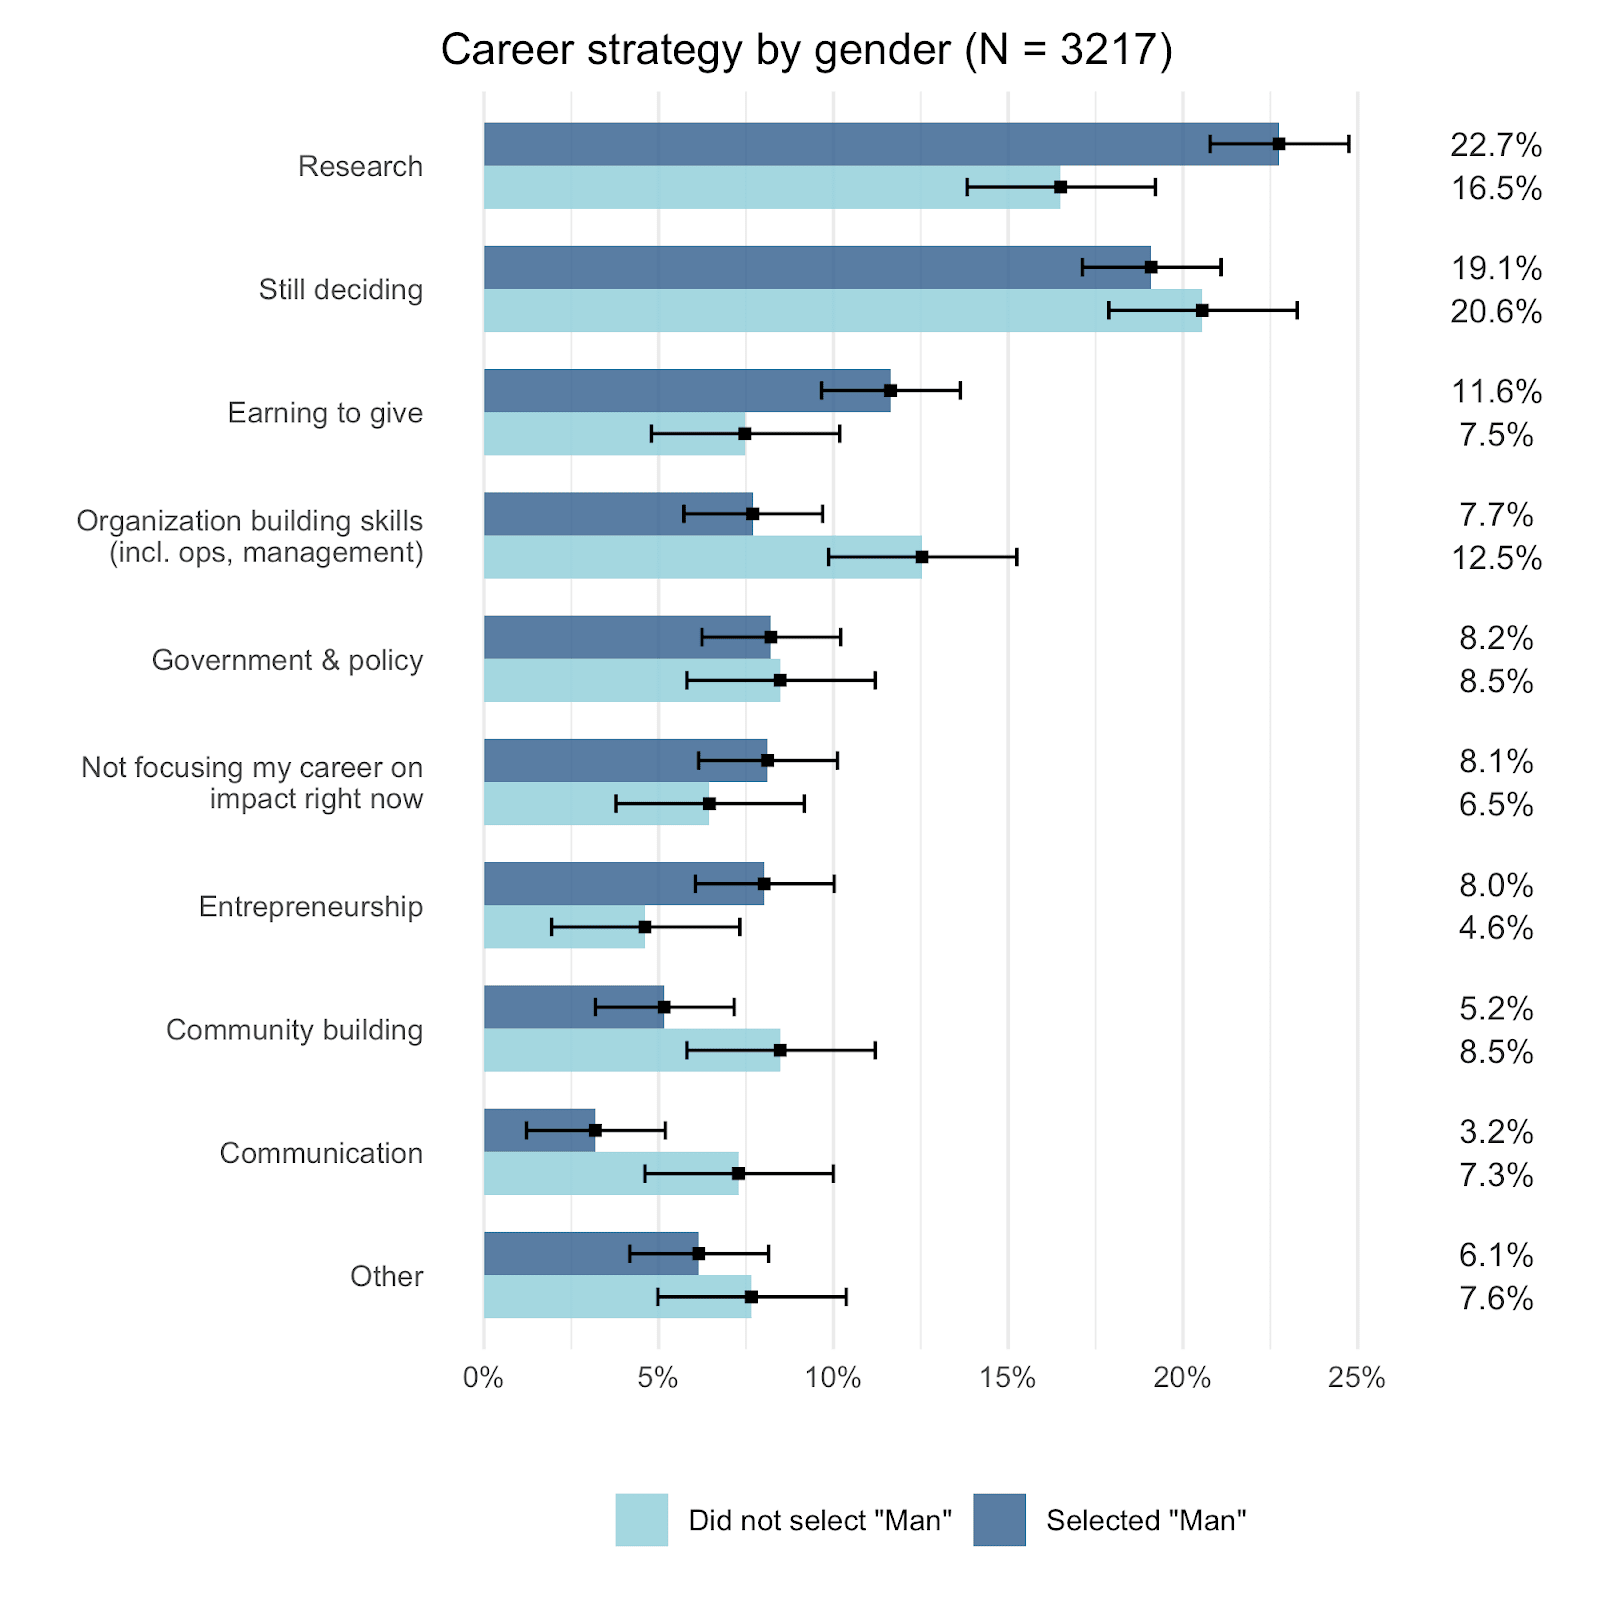
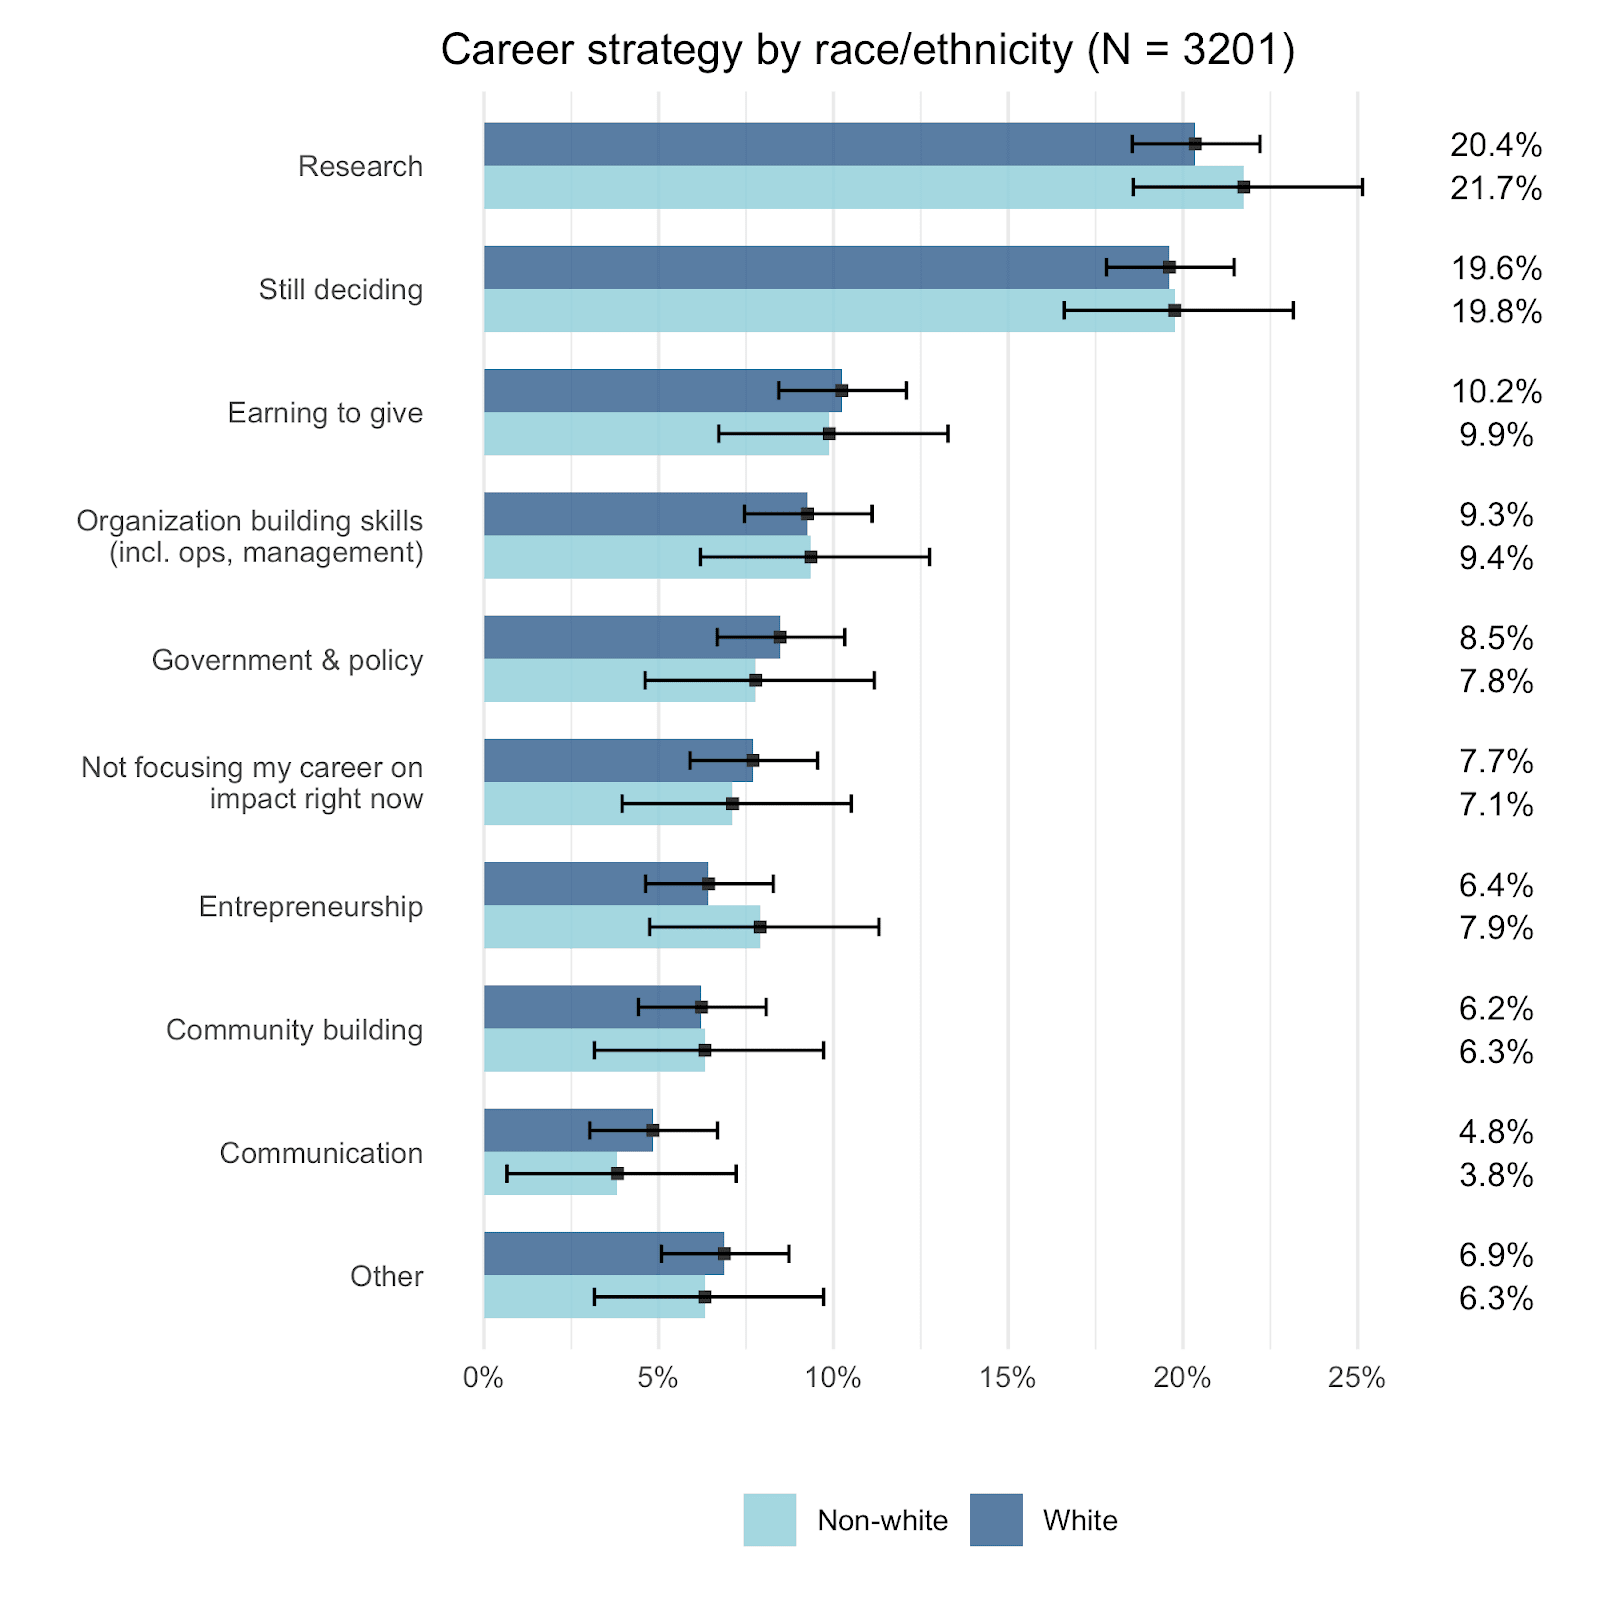
- Men were significantly more likely to select research and significantly less likely to select organization-building skills. We found no significant differences by race/ethnicity.
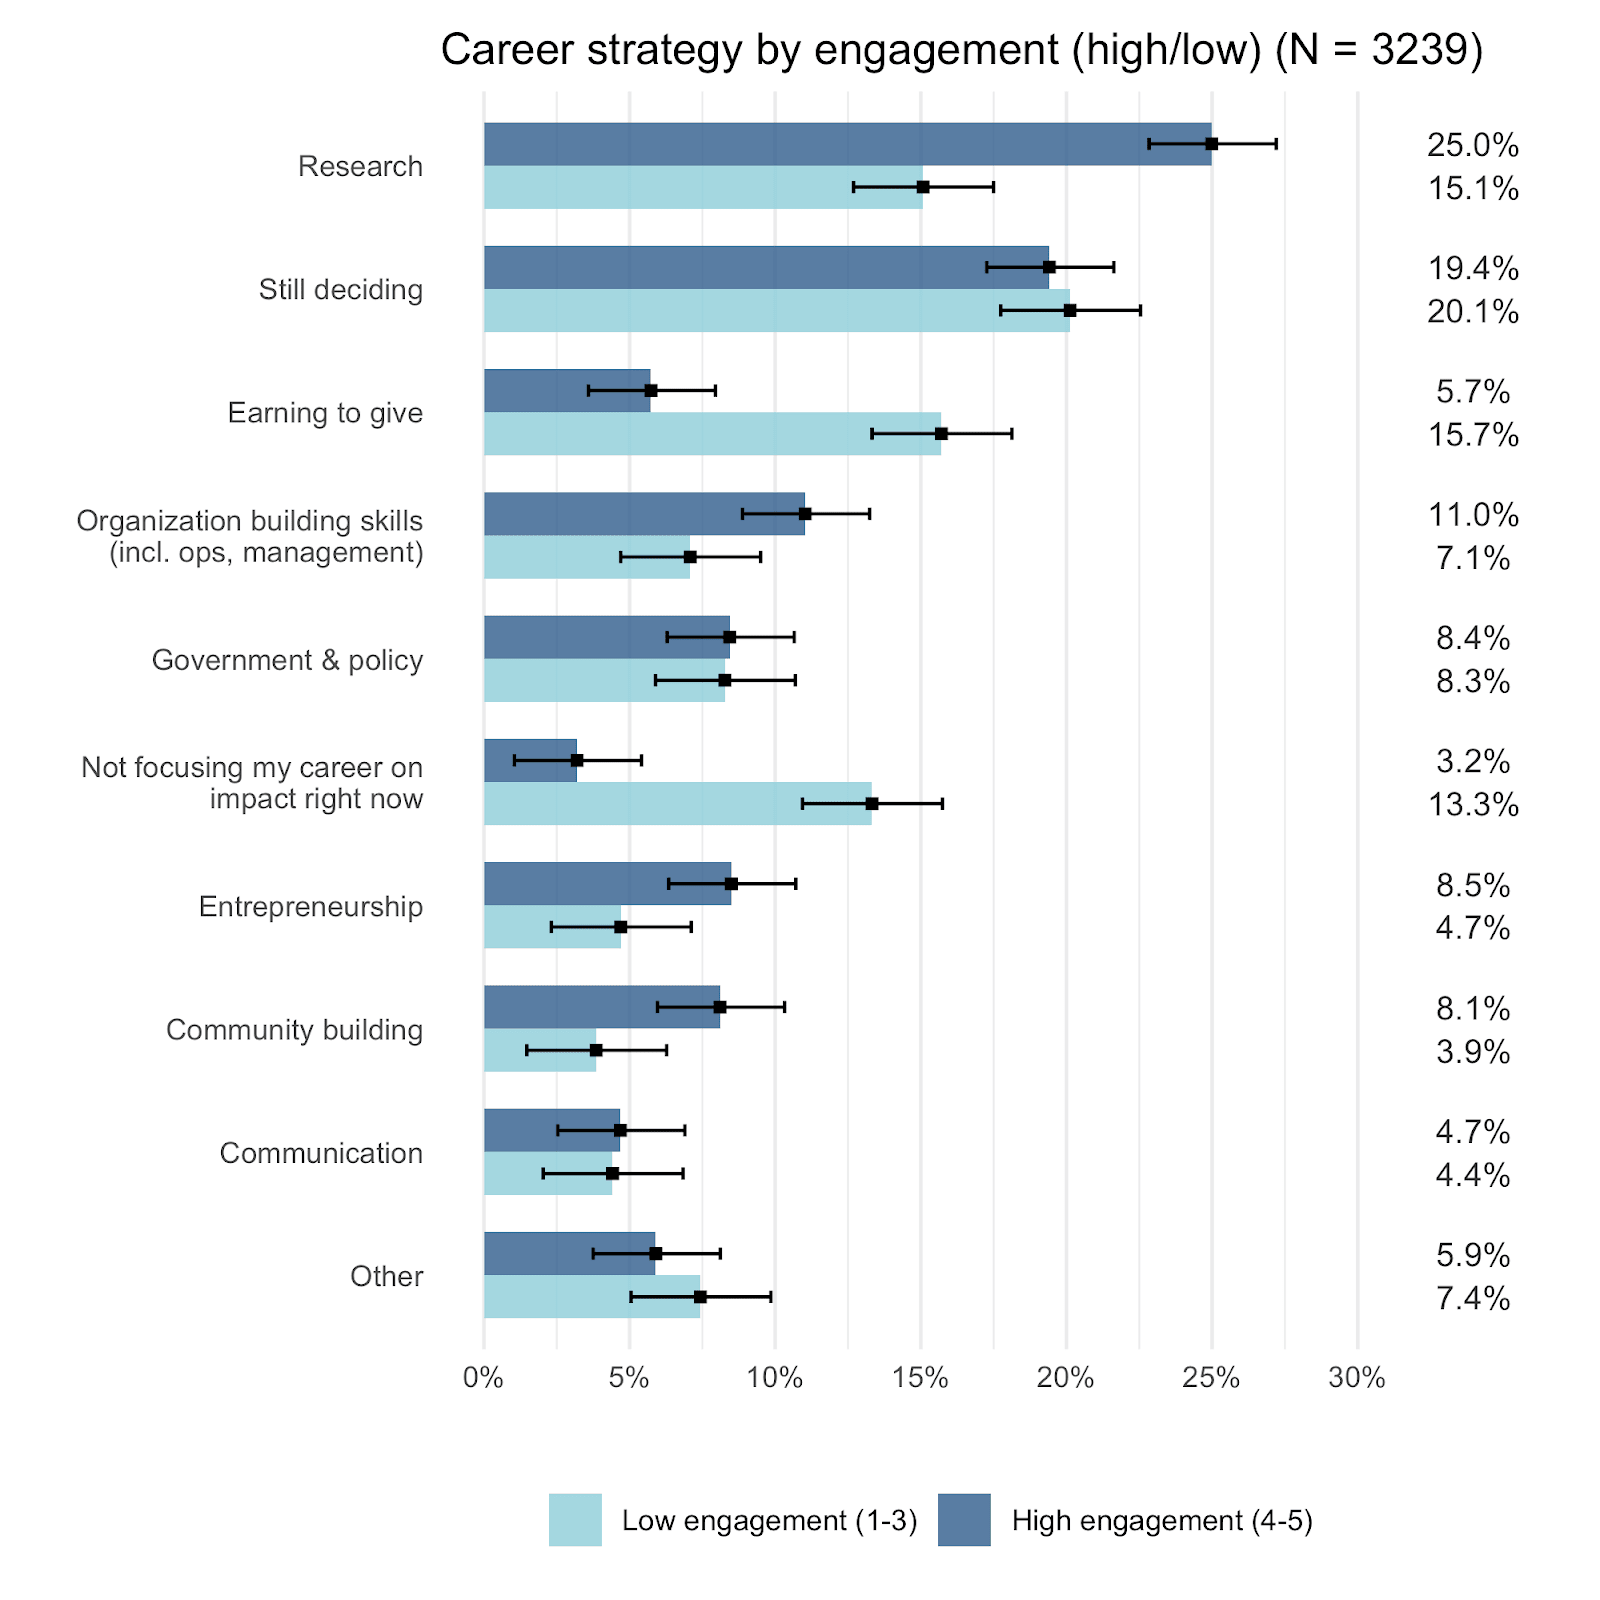
- Highly engaged EAs were much more likely to select research (25.0% vs 15.1%) and much less likely to select earning to give (5.7% vs 15.7%).
- Politics
- Respondents continue to be strongly left-leaning politically (76.6% vs 2.9% right-leaning).
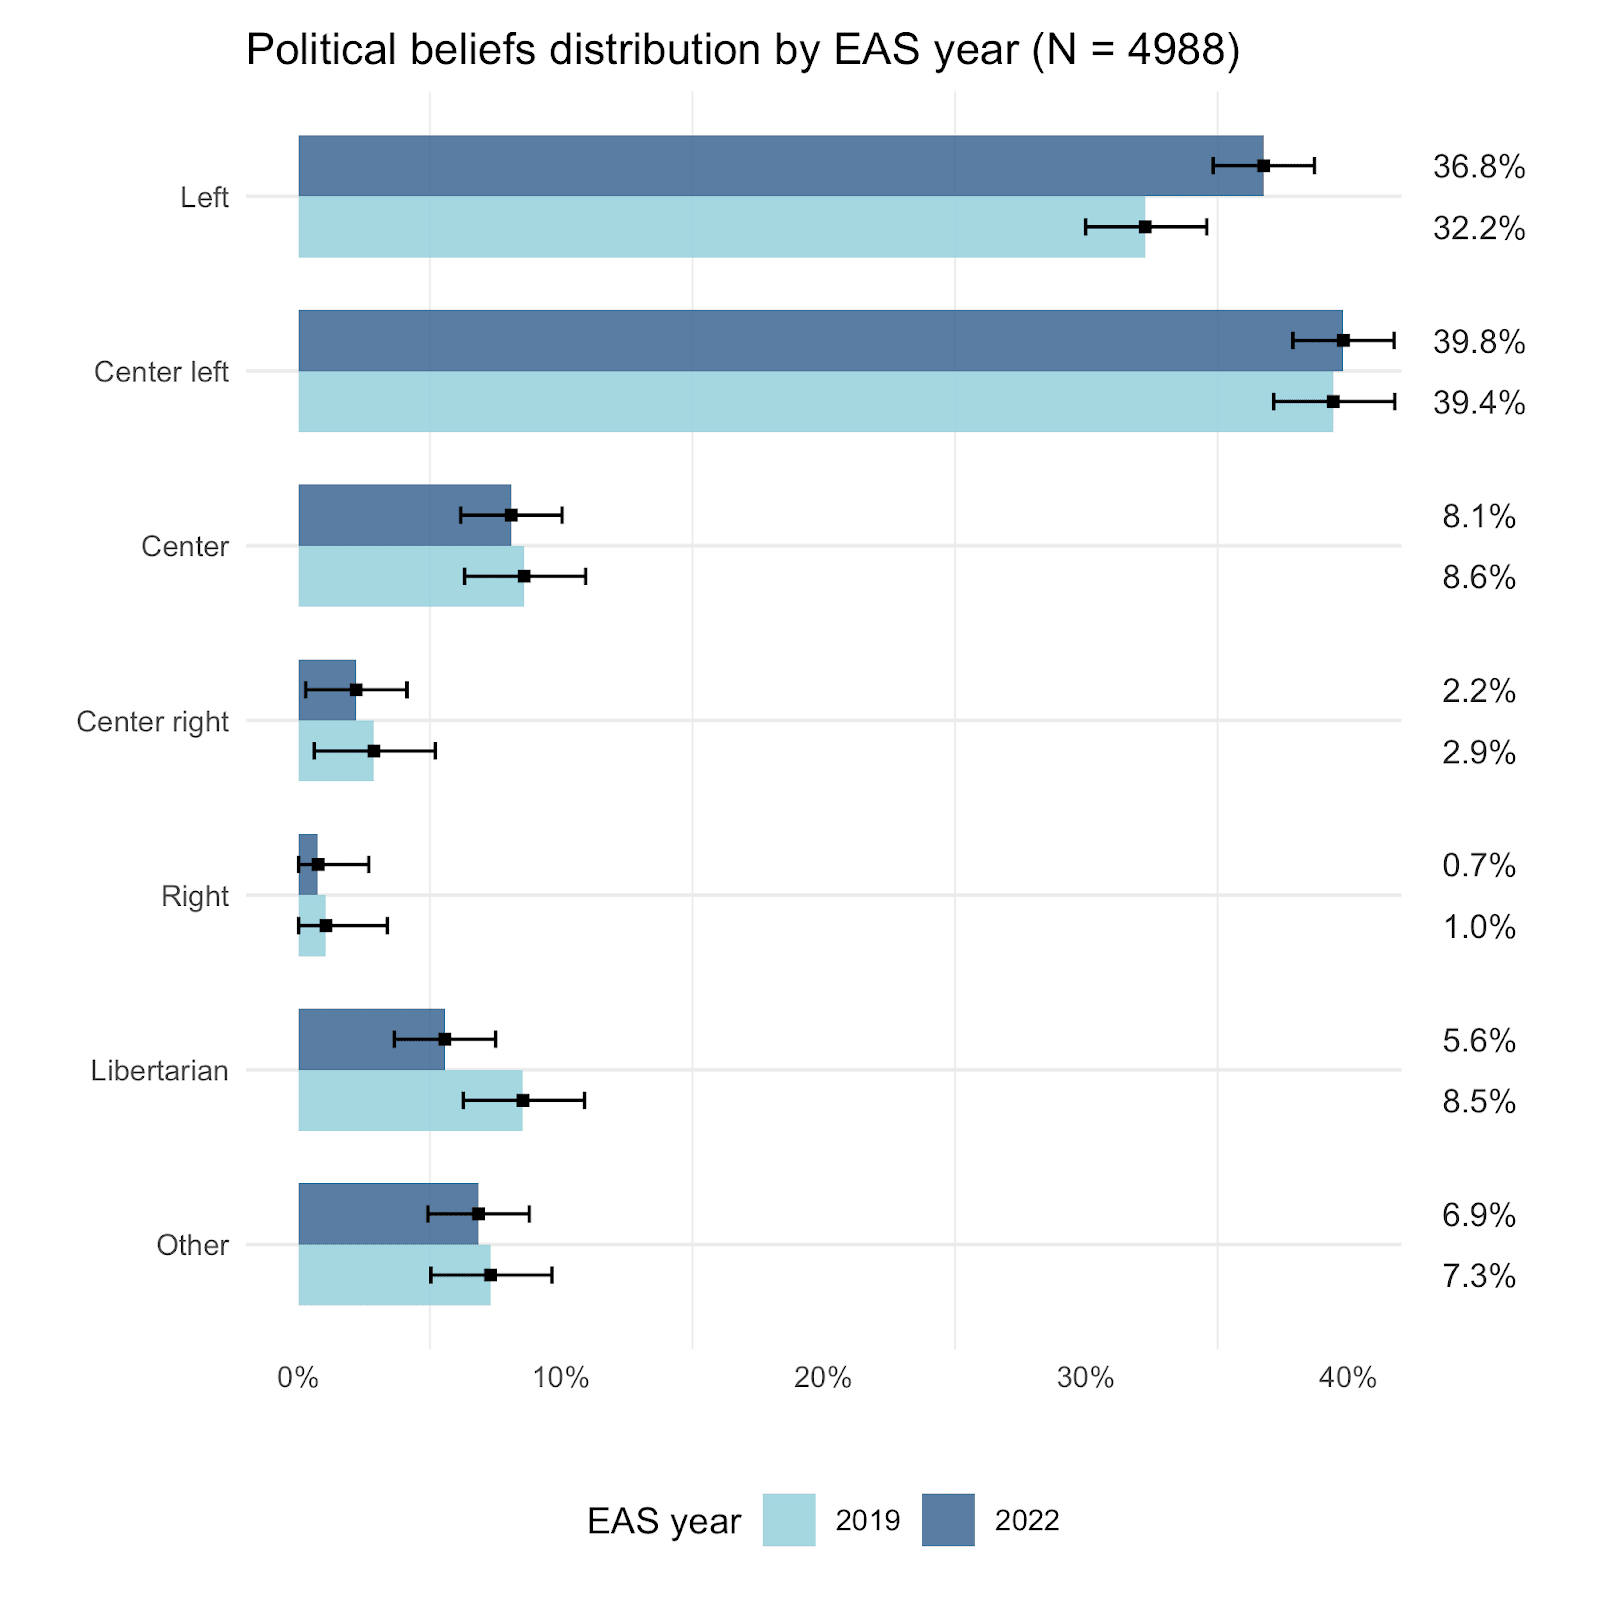
- Our 2022 sample was slightly more left-leaning than in 2019.
- Religion
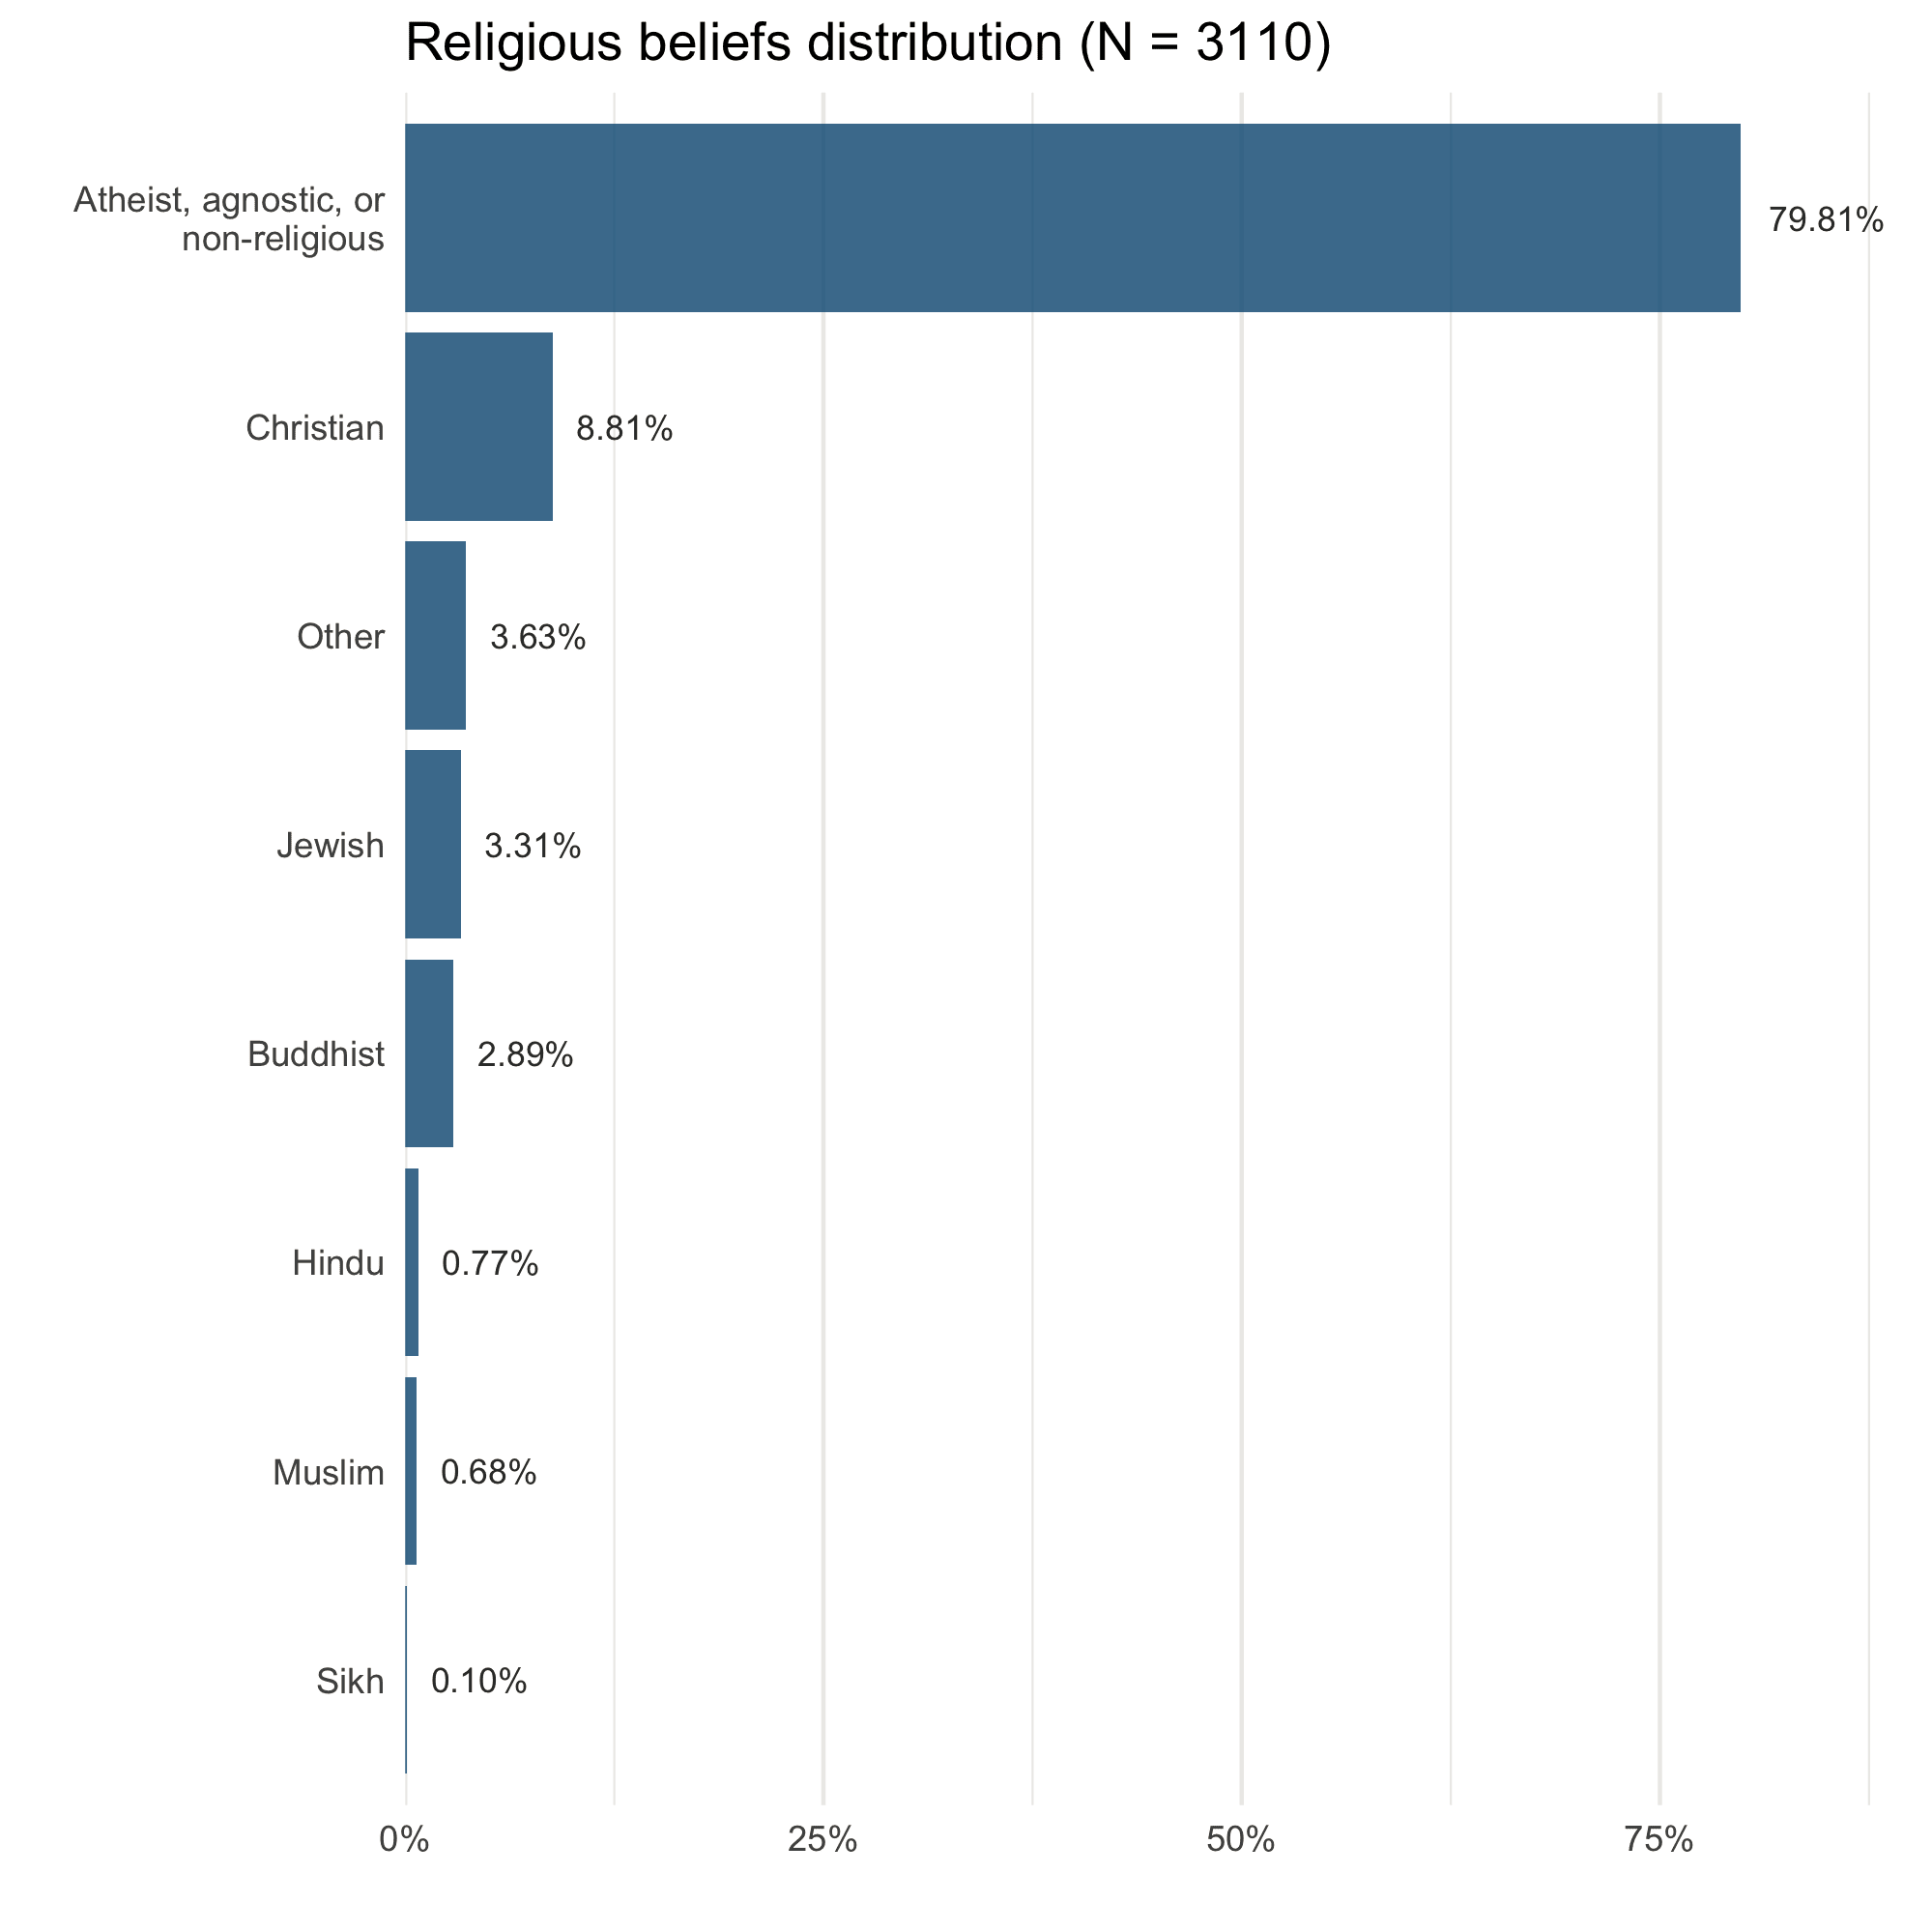
- A large majority of respondents (79.81%) were atheist, agnostic or non-religious (similar to 2019).
Introduction
3567 respondents completed the 2022 EA Survey.
A recurring observation in previous surveys is that the community is relatively lacking in demographic diversity on the dimensions of gender, age, race/ethnicity, and nationality. In this report, we examine the demographic composition of the community, how it has changed over time, and how this is related to different outcomes.
In future posts in this series we will examine differences in experiences of and satisfaction with the community (see posts from 2019 and 2020), and explore the geography of the EA community.
In a forthcoming follow-up survey, we will also be examining experiences related to gender and community satisfaction in more detail.
Basic Demographics
Gender
The percentage of women has slightly increased since 2020 (26.5% to 29.3%), while the percentage of men has slightly decreased (70.5% to 66.2%).[1]
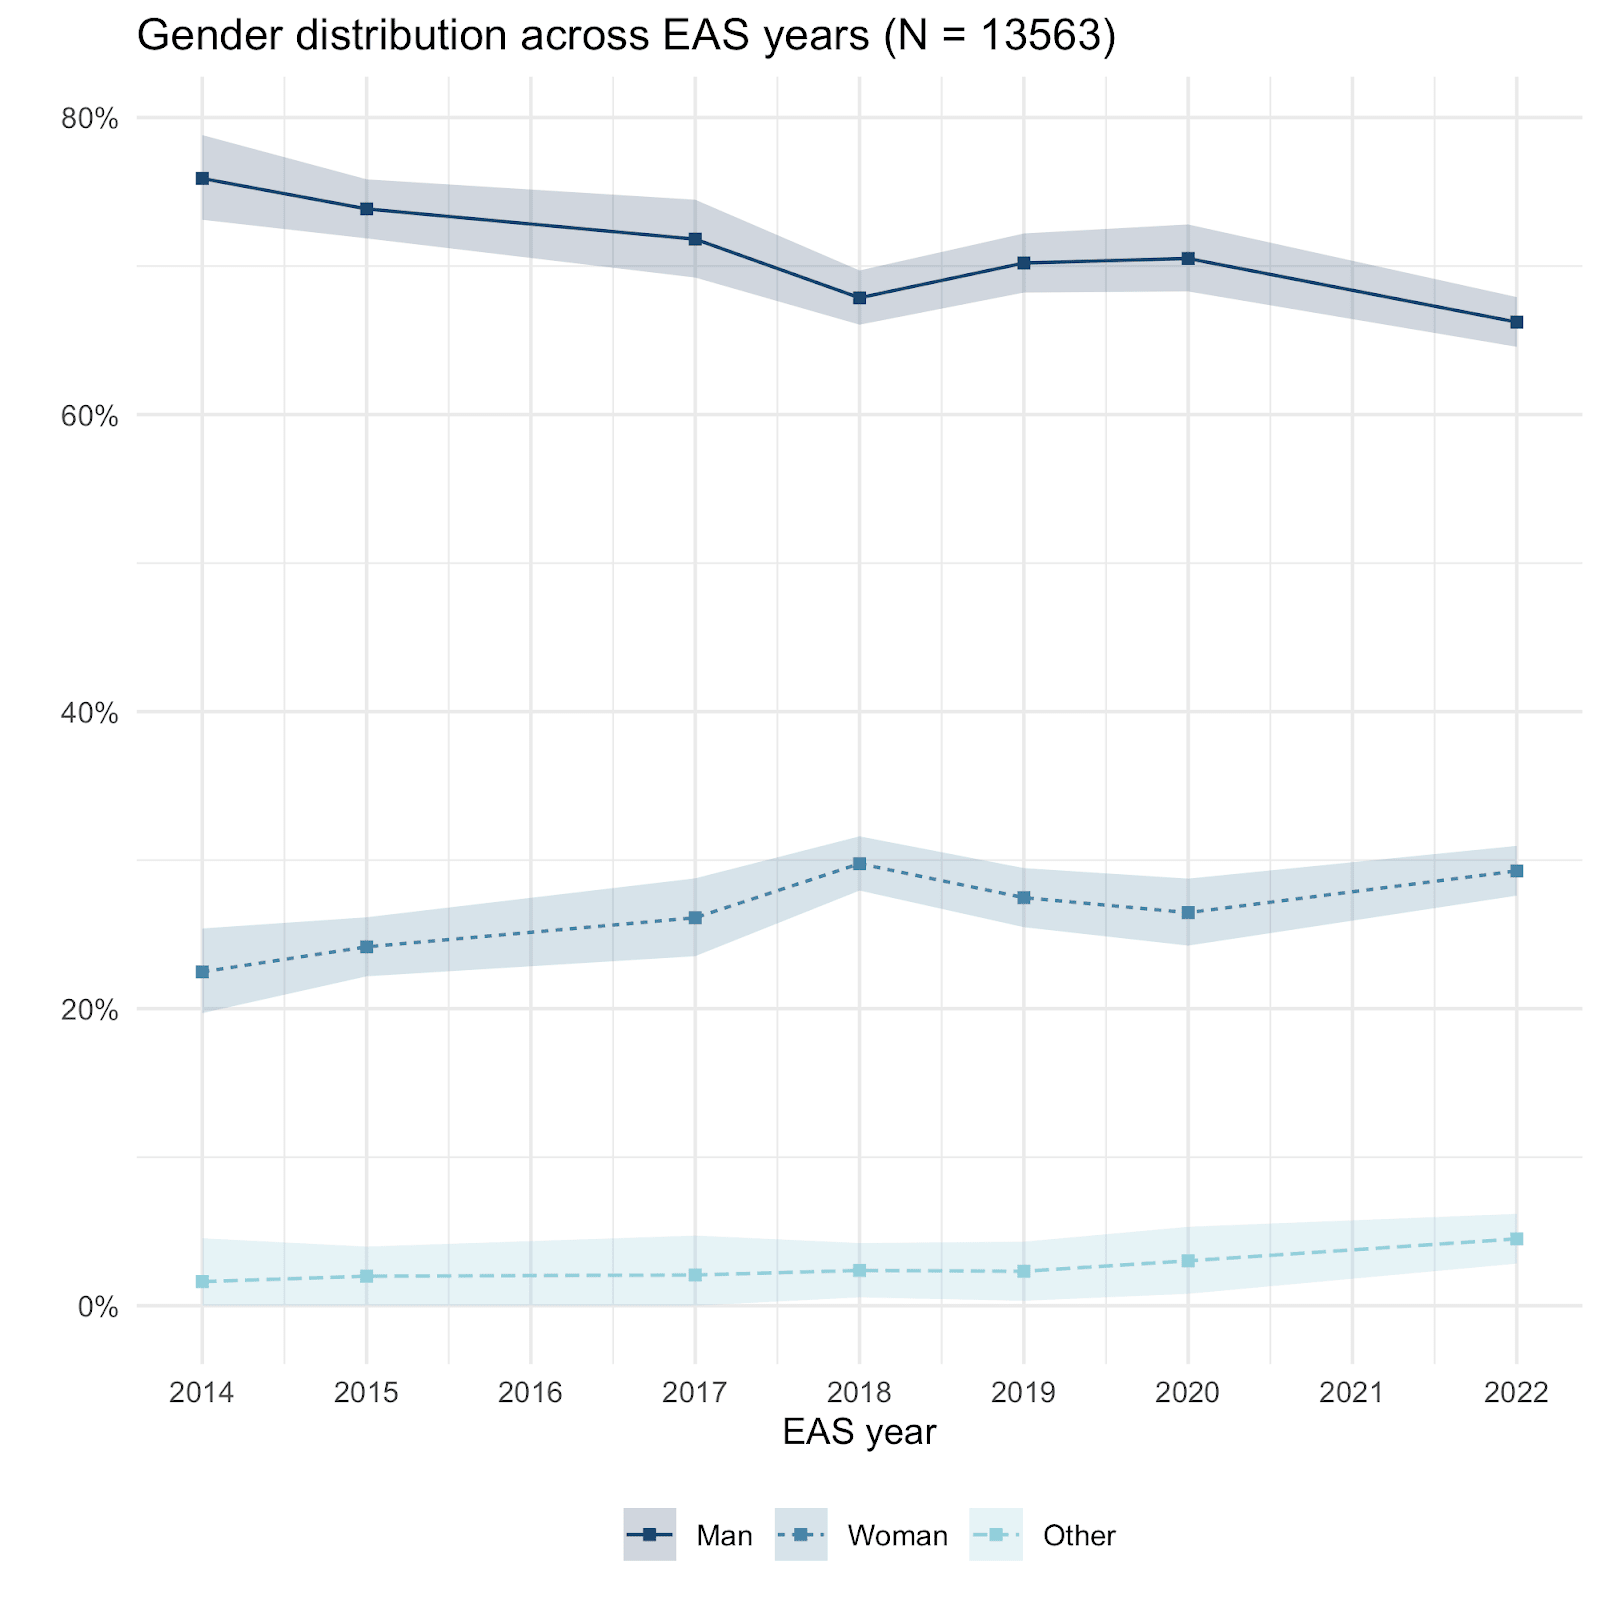
Gender across survey years
Looking across different survey years, we can see that there is now a higher percentage of women in our sample than in the earliest years. In the earliest EA Surveys, we saw just over 75% men, whereas in the most recent survey, we see just over 65%.
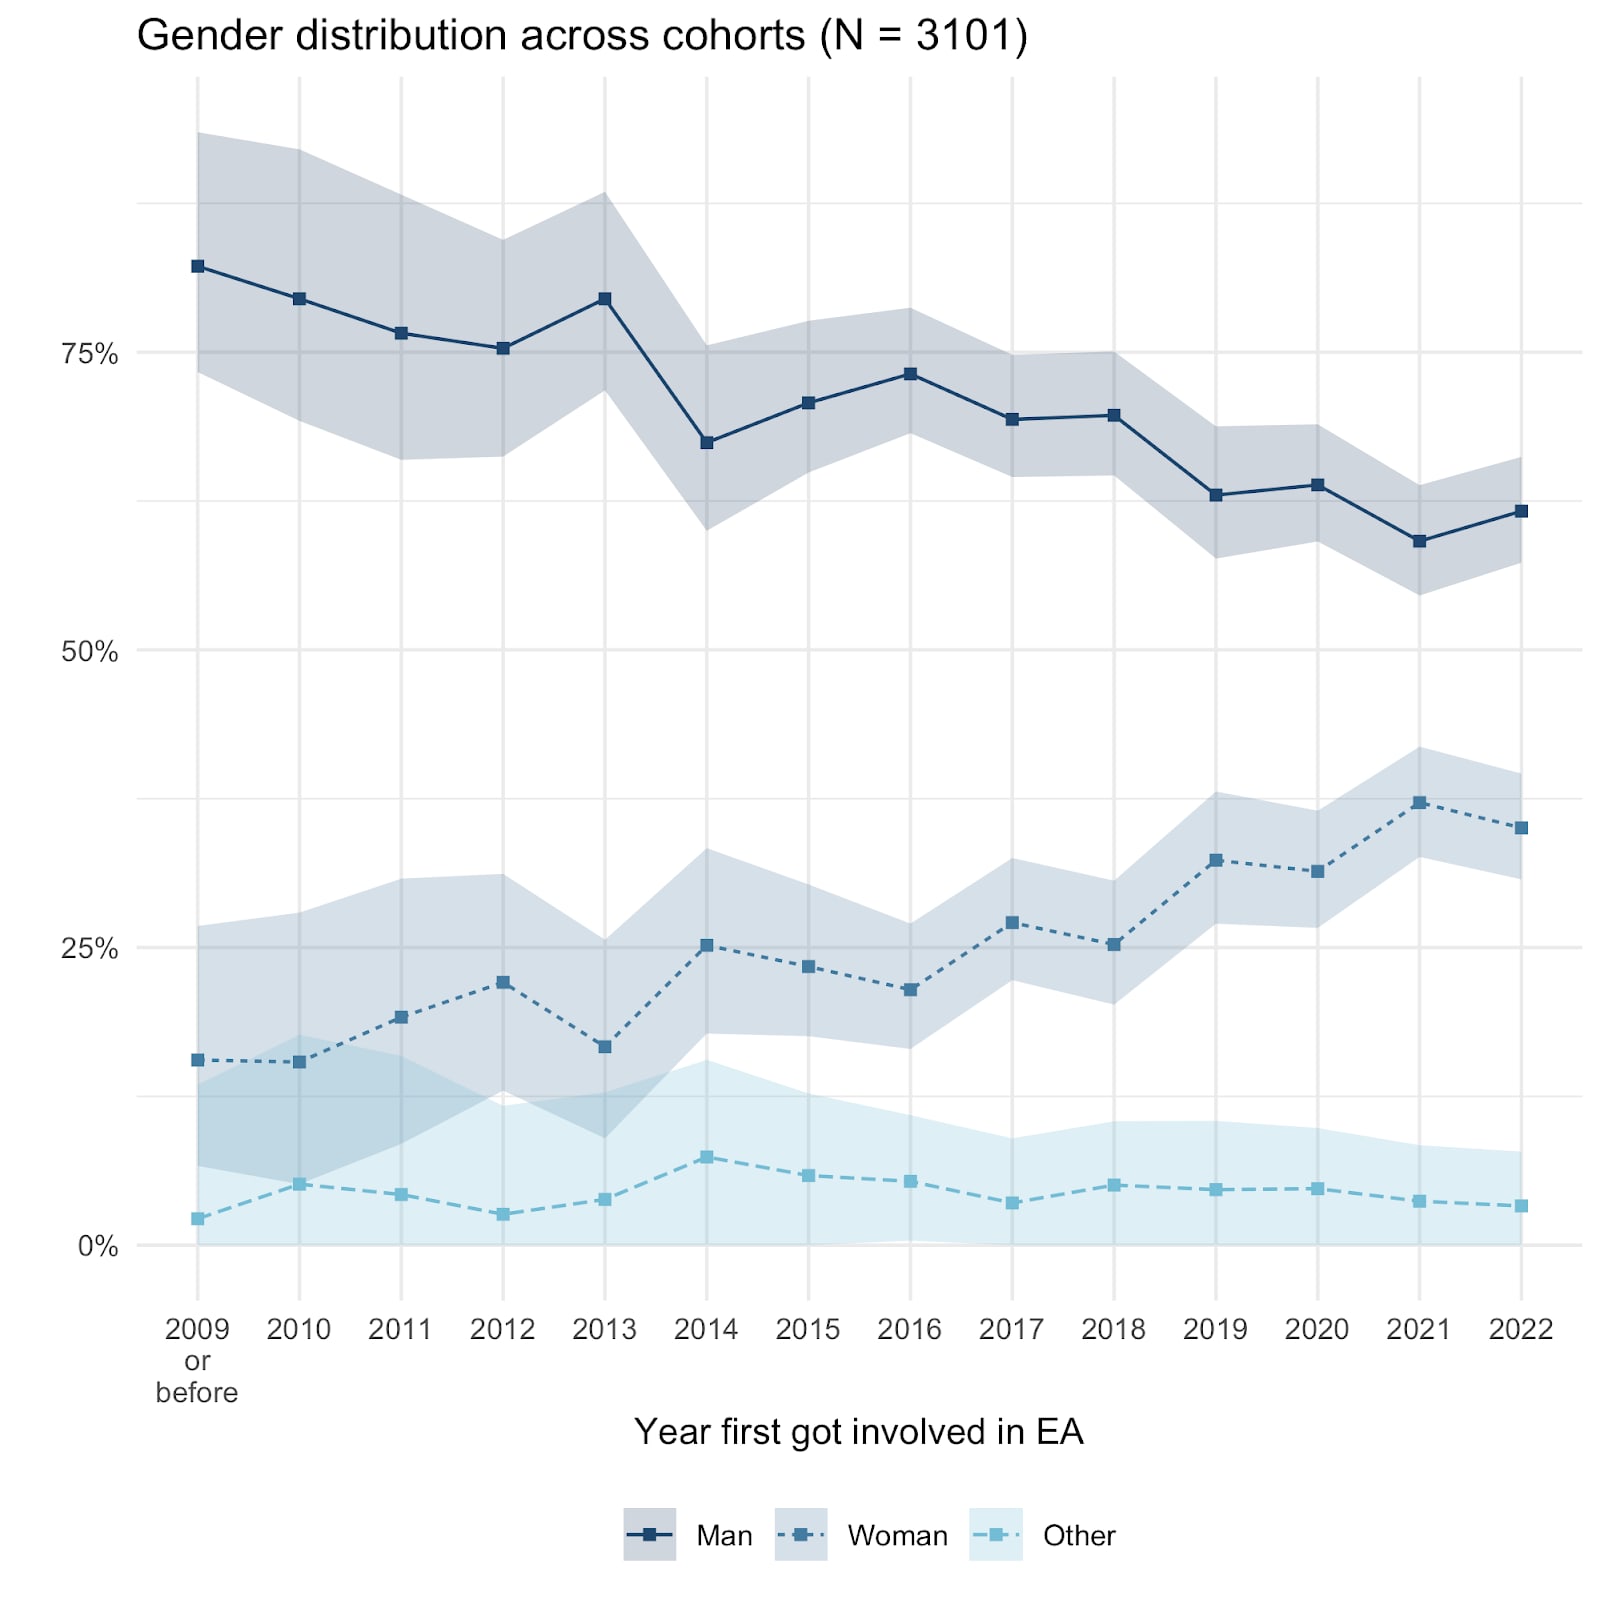
Gender across cohorts
Looking across cohorts (EAs who reported first getting involved in a given year), we see that more recent cohorts contain more women than earlier cohorts. This is compatible with either/both increased recruitment of women (or decreased recruitment of men) or disproportionate attrition of women over time (see below for more analysis on this).[2]
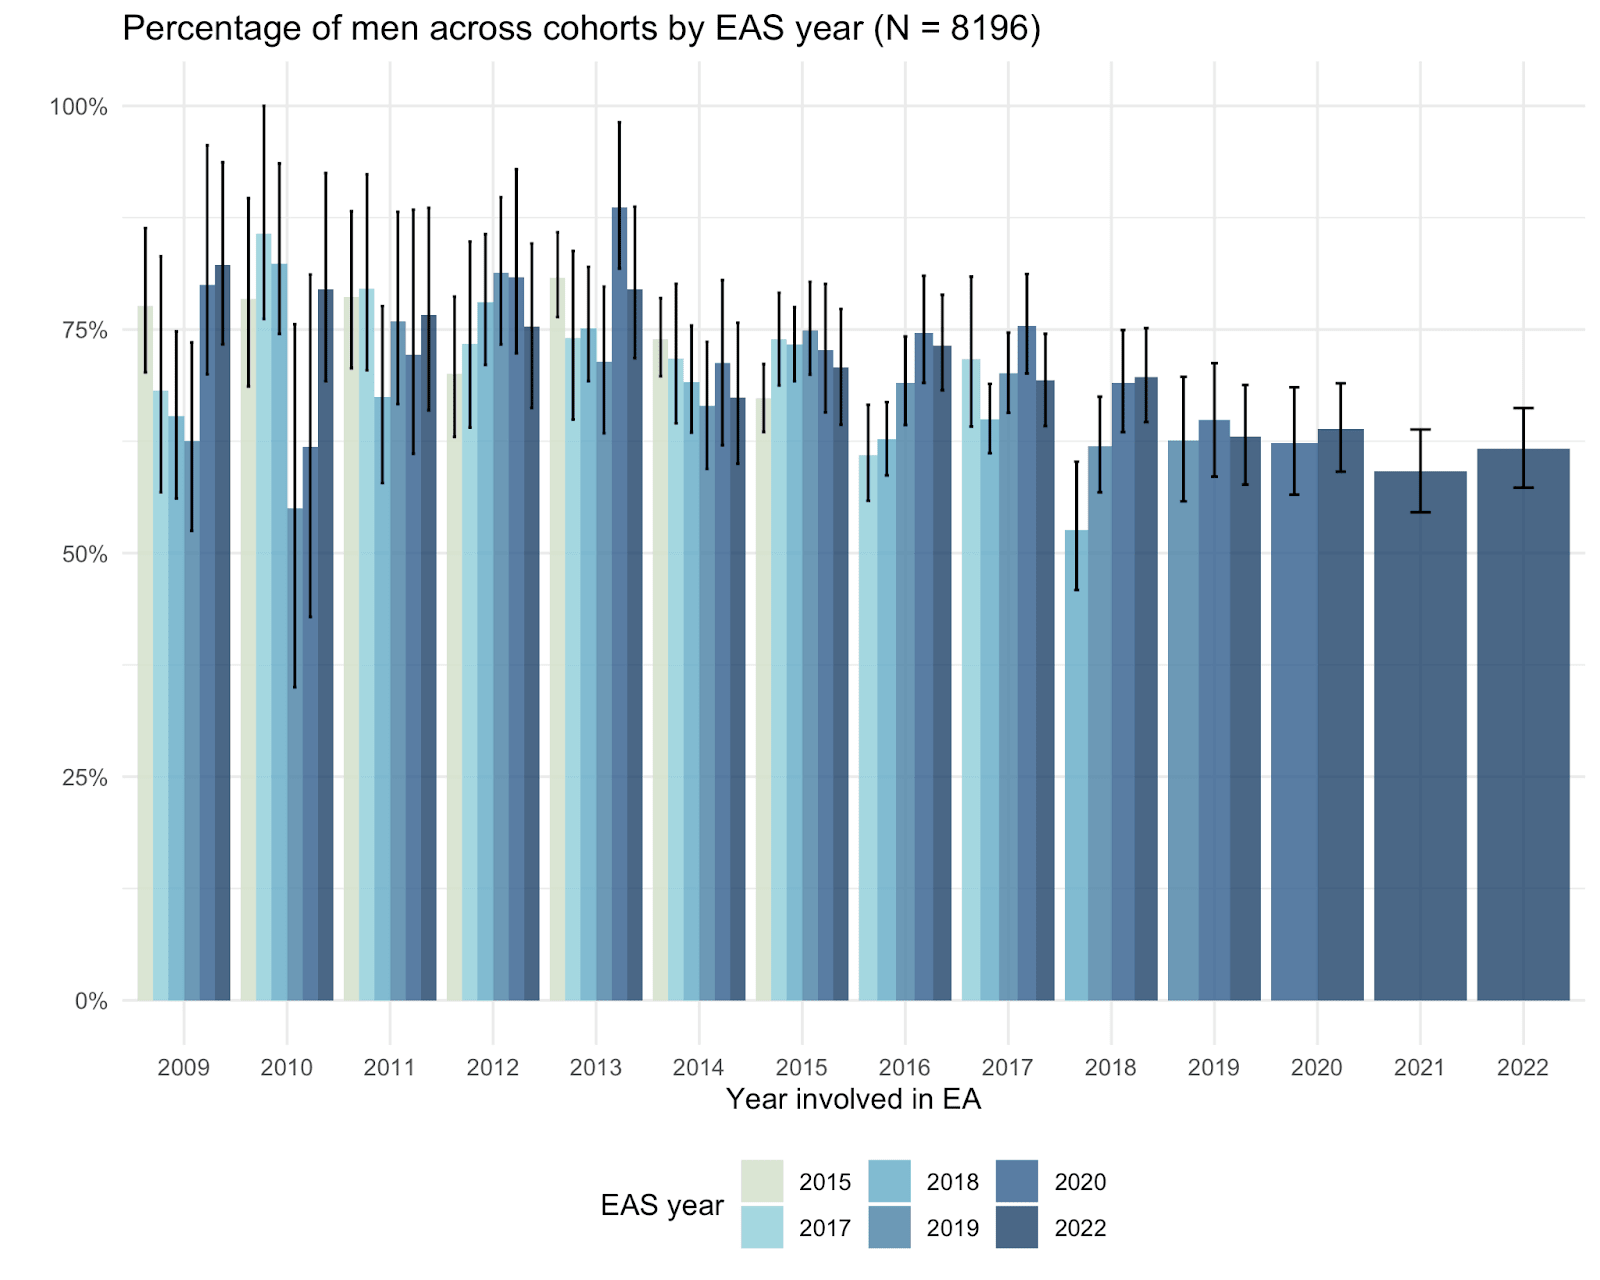
Gender across cohort by year
We can also look at the gender composition of different cohorts (years people joined EA) within surveys across different years.
This shows us the same pattern across cohorts as mentioned above within previous years’ surveys (i.e. there are more women and fewer men in more recent cohorts).
However, it also allows us to compare cohorts across different surveys. This could potentially point to signs of differential attrition. If, for example, non-male respondents were more likely to drop out of EA than men, then within cohorts we should see an increase in the percentage of men, i.e. the line for 2020 would be lower than the line for 2022 and so on.
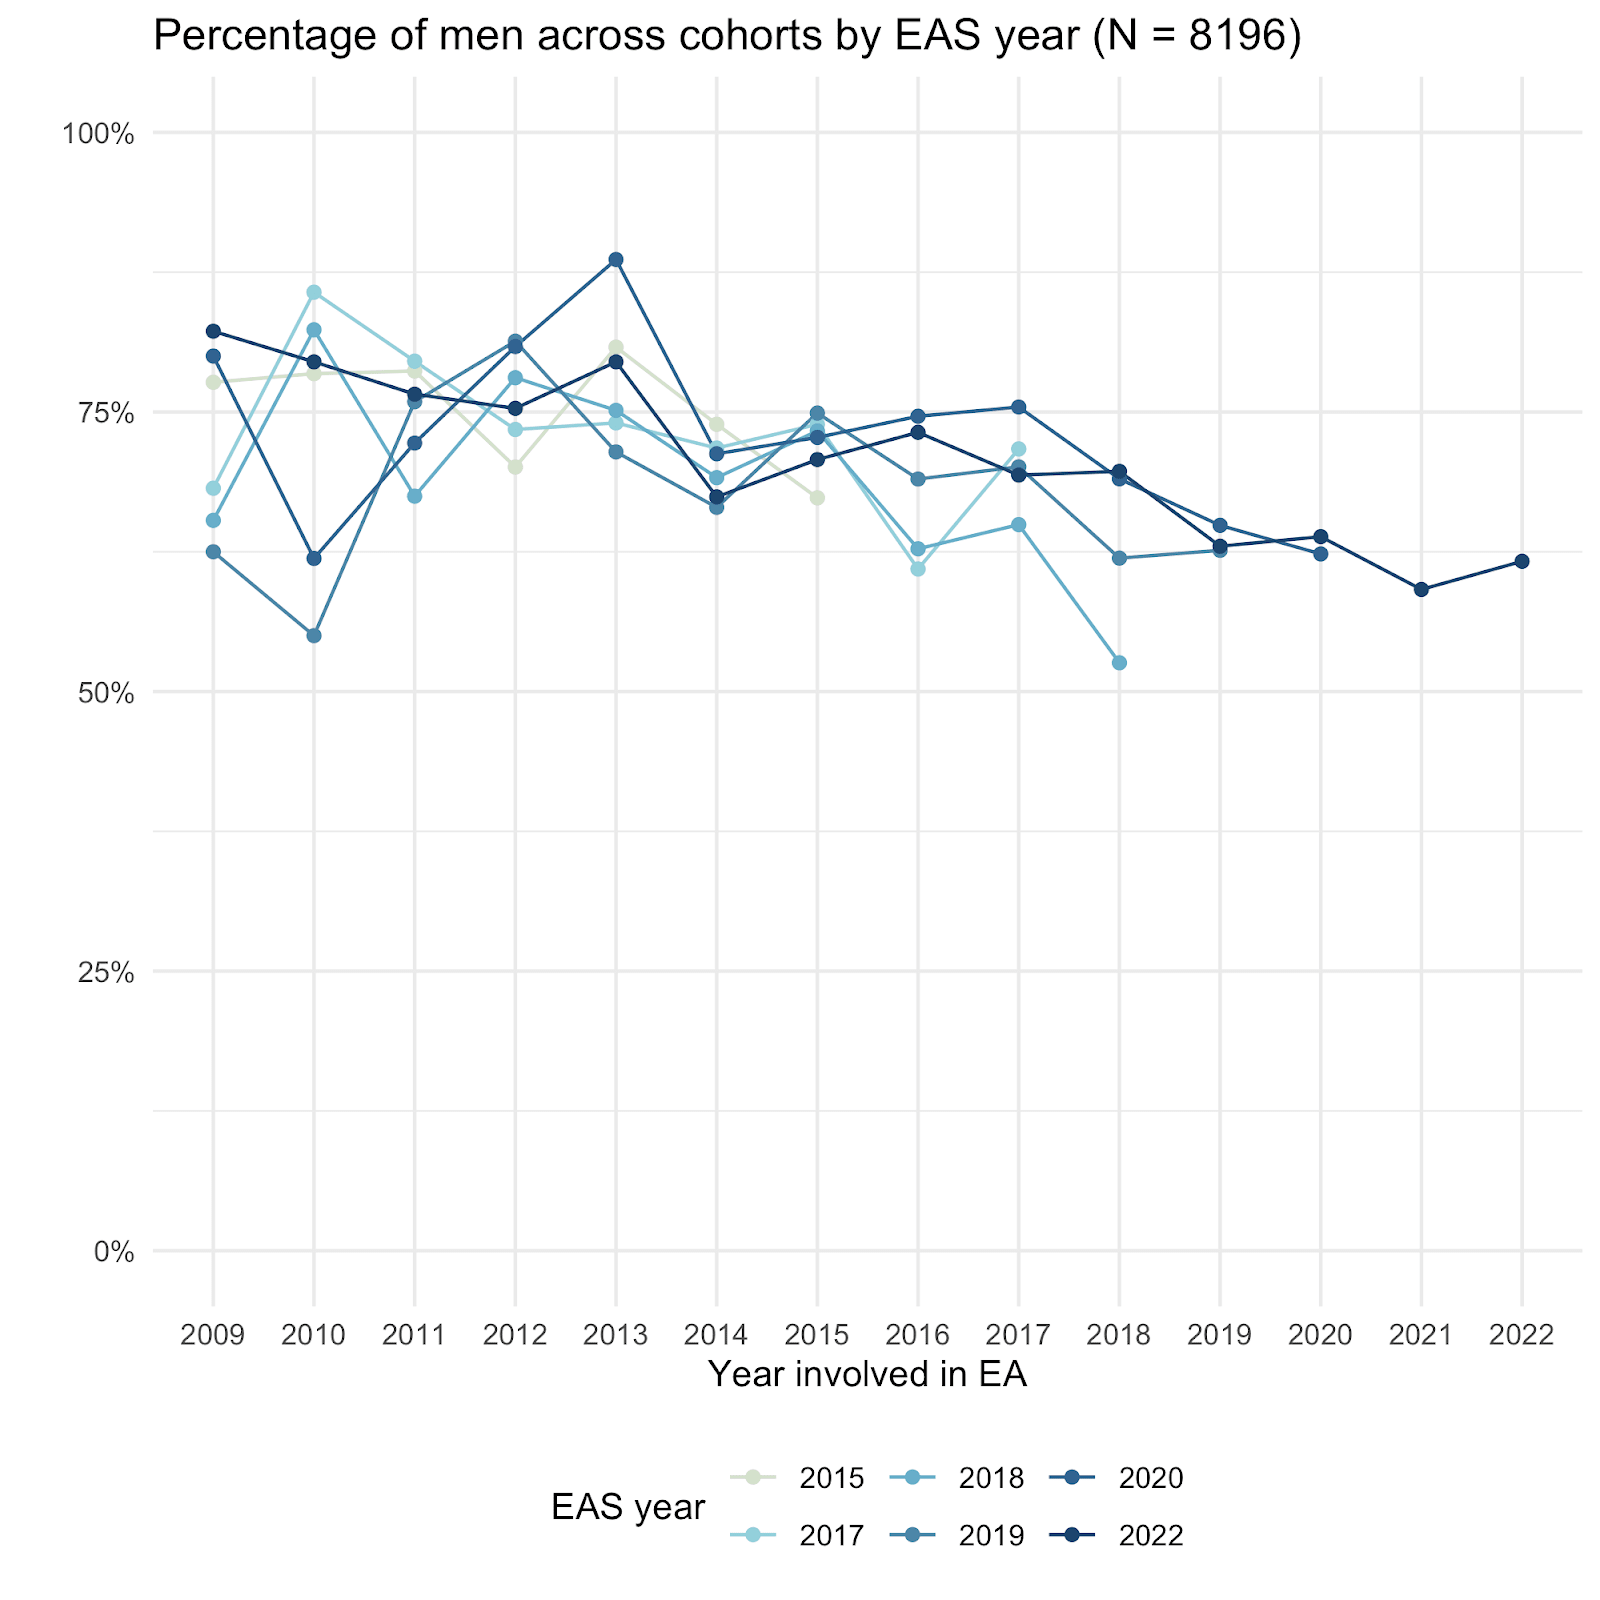
It may be tempting to see signs of a gap between earlier and later surveys in the more recent cohorts on the right hand side (the cohorts on the left hand sides are particularly noisy due to smaller numbers of respondents). However, examining the differences between cohorts in more detail in the plot below, there seems no consistent or significant trend in this direction.
Race/ethnicity
Our sample remains majority white, with relatively little variation among the other subgroups compared to previous years.[3]
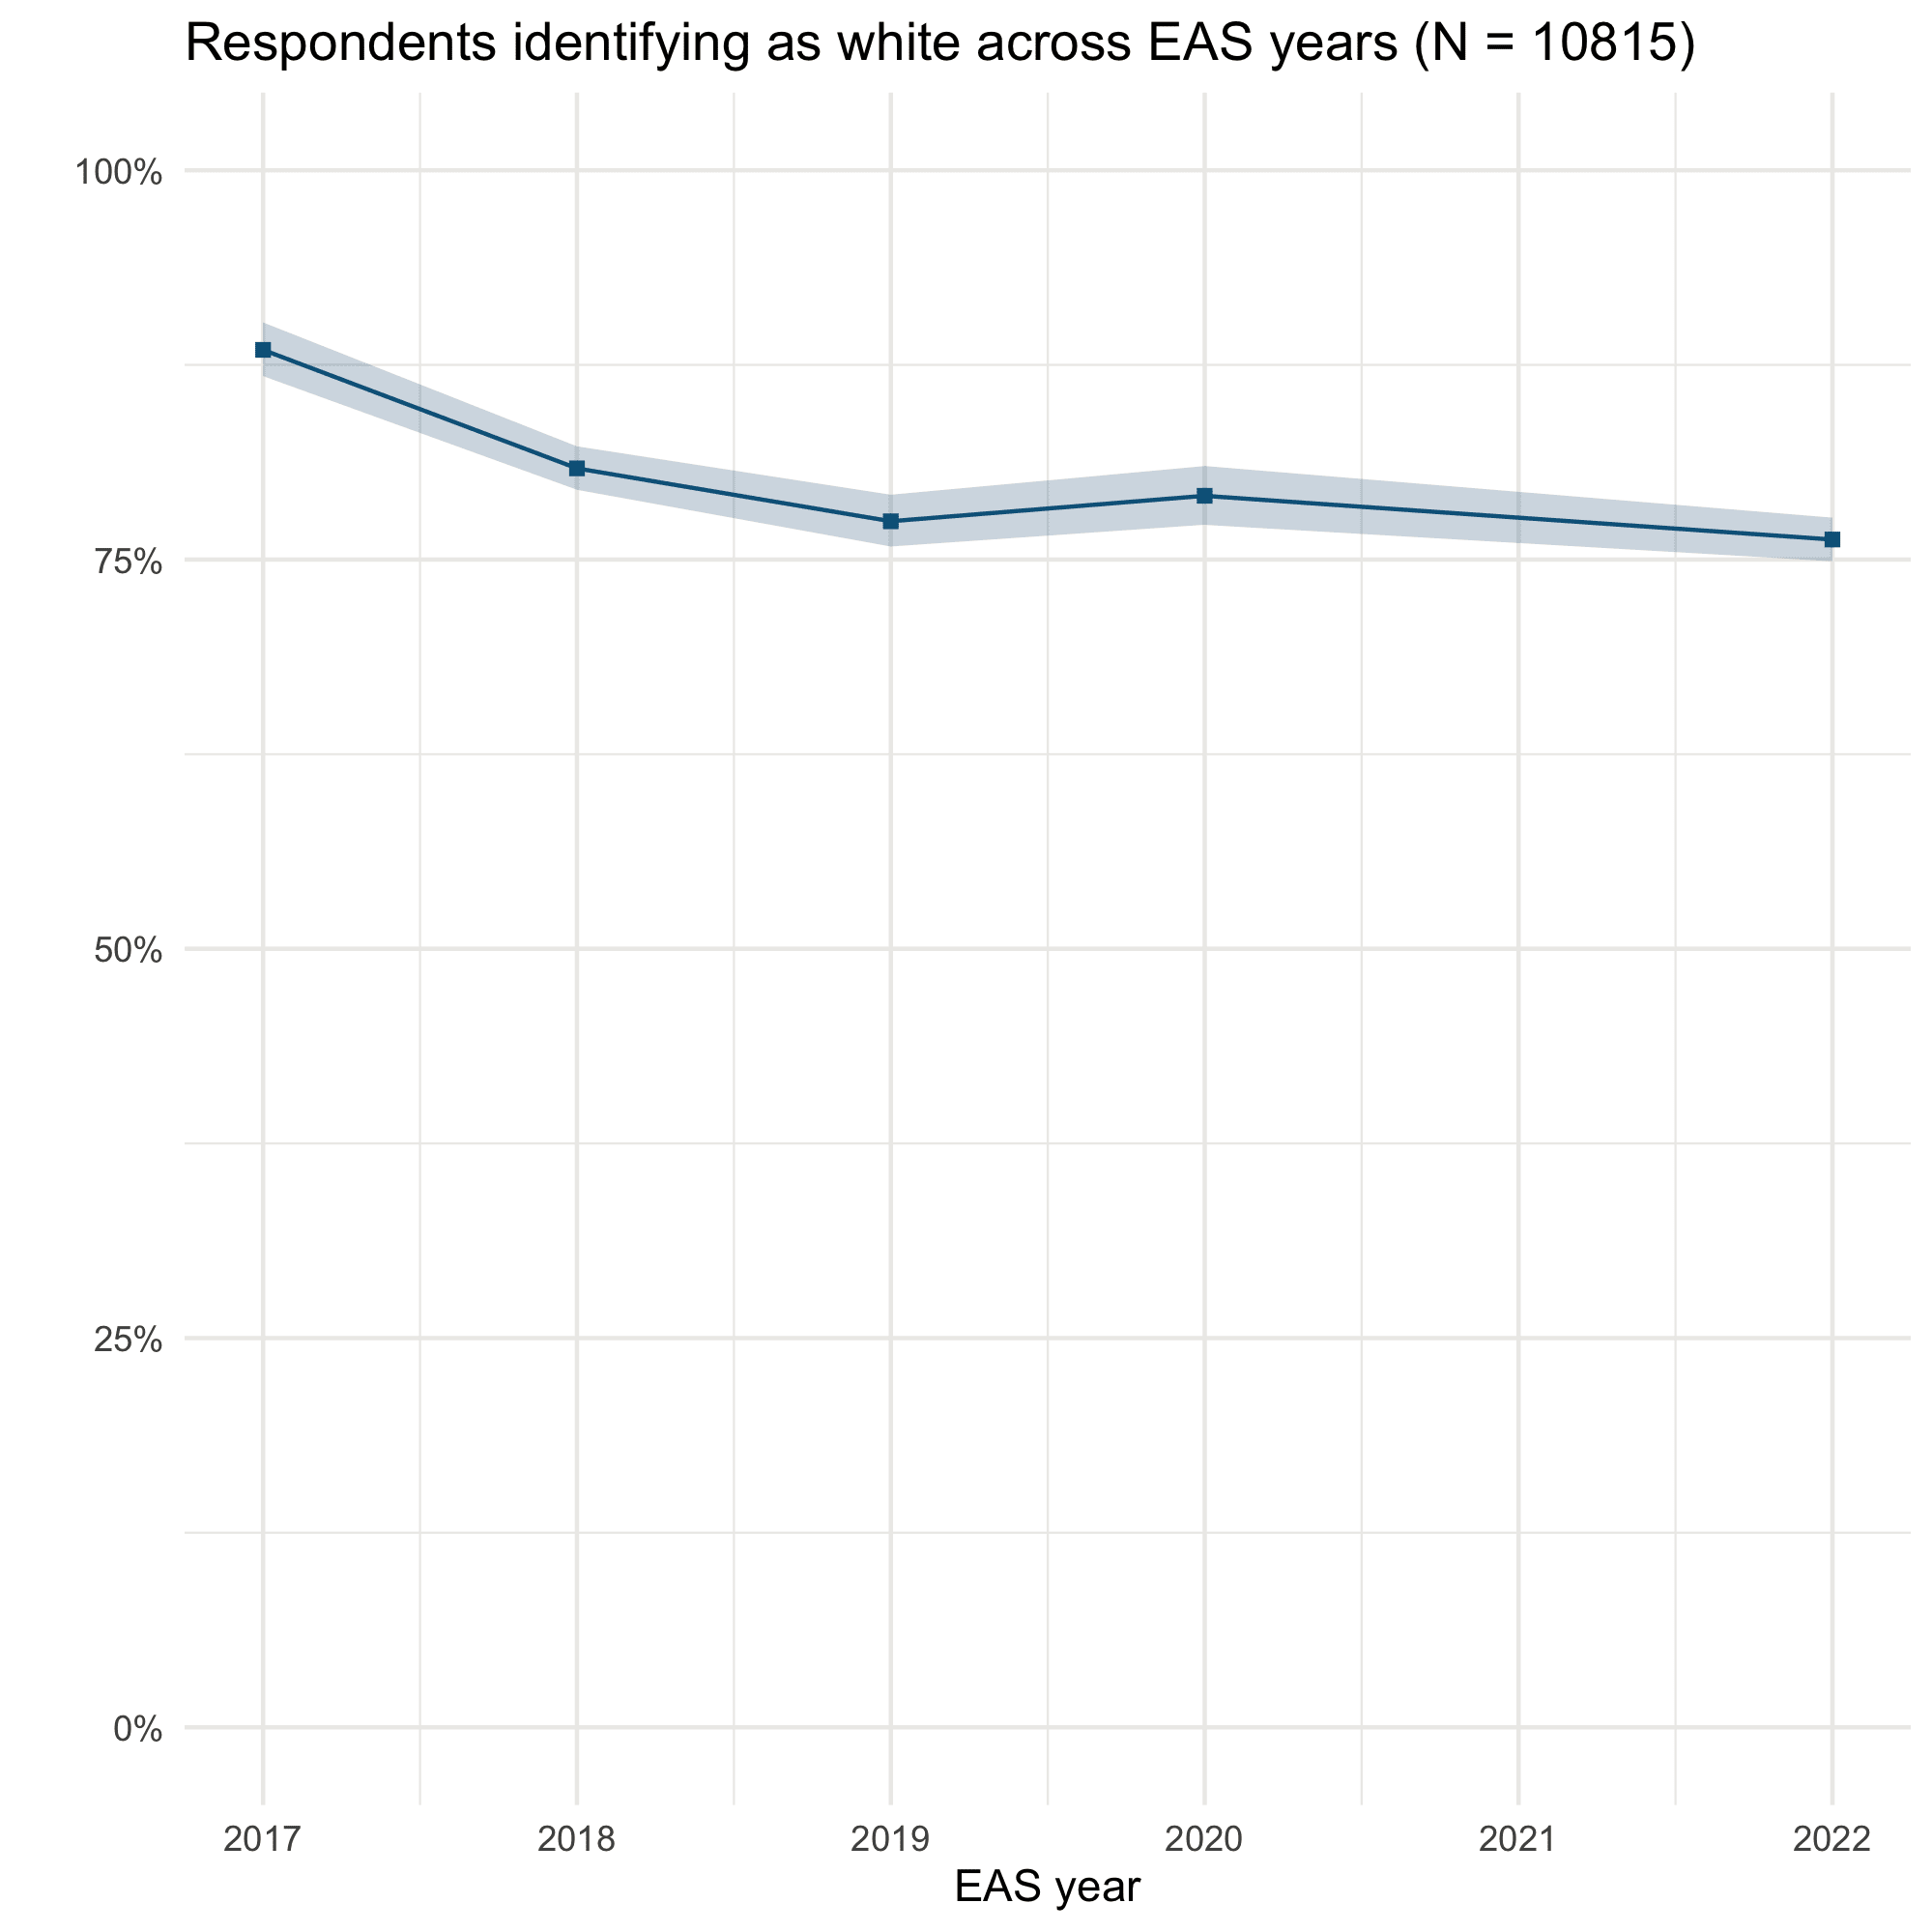
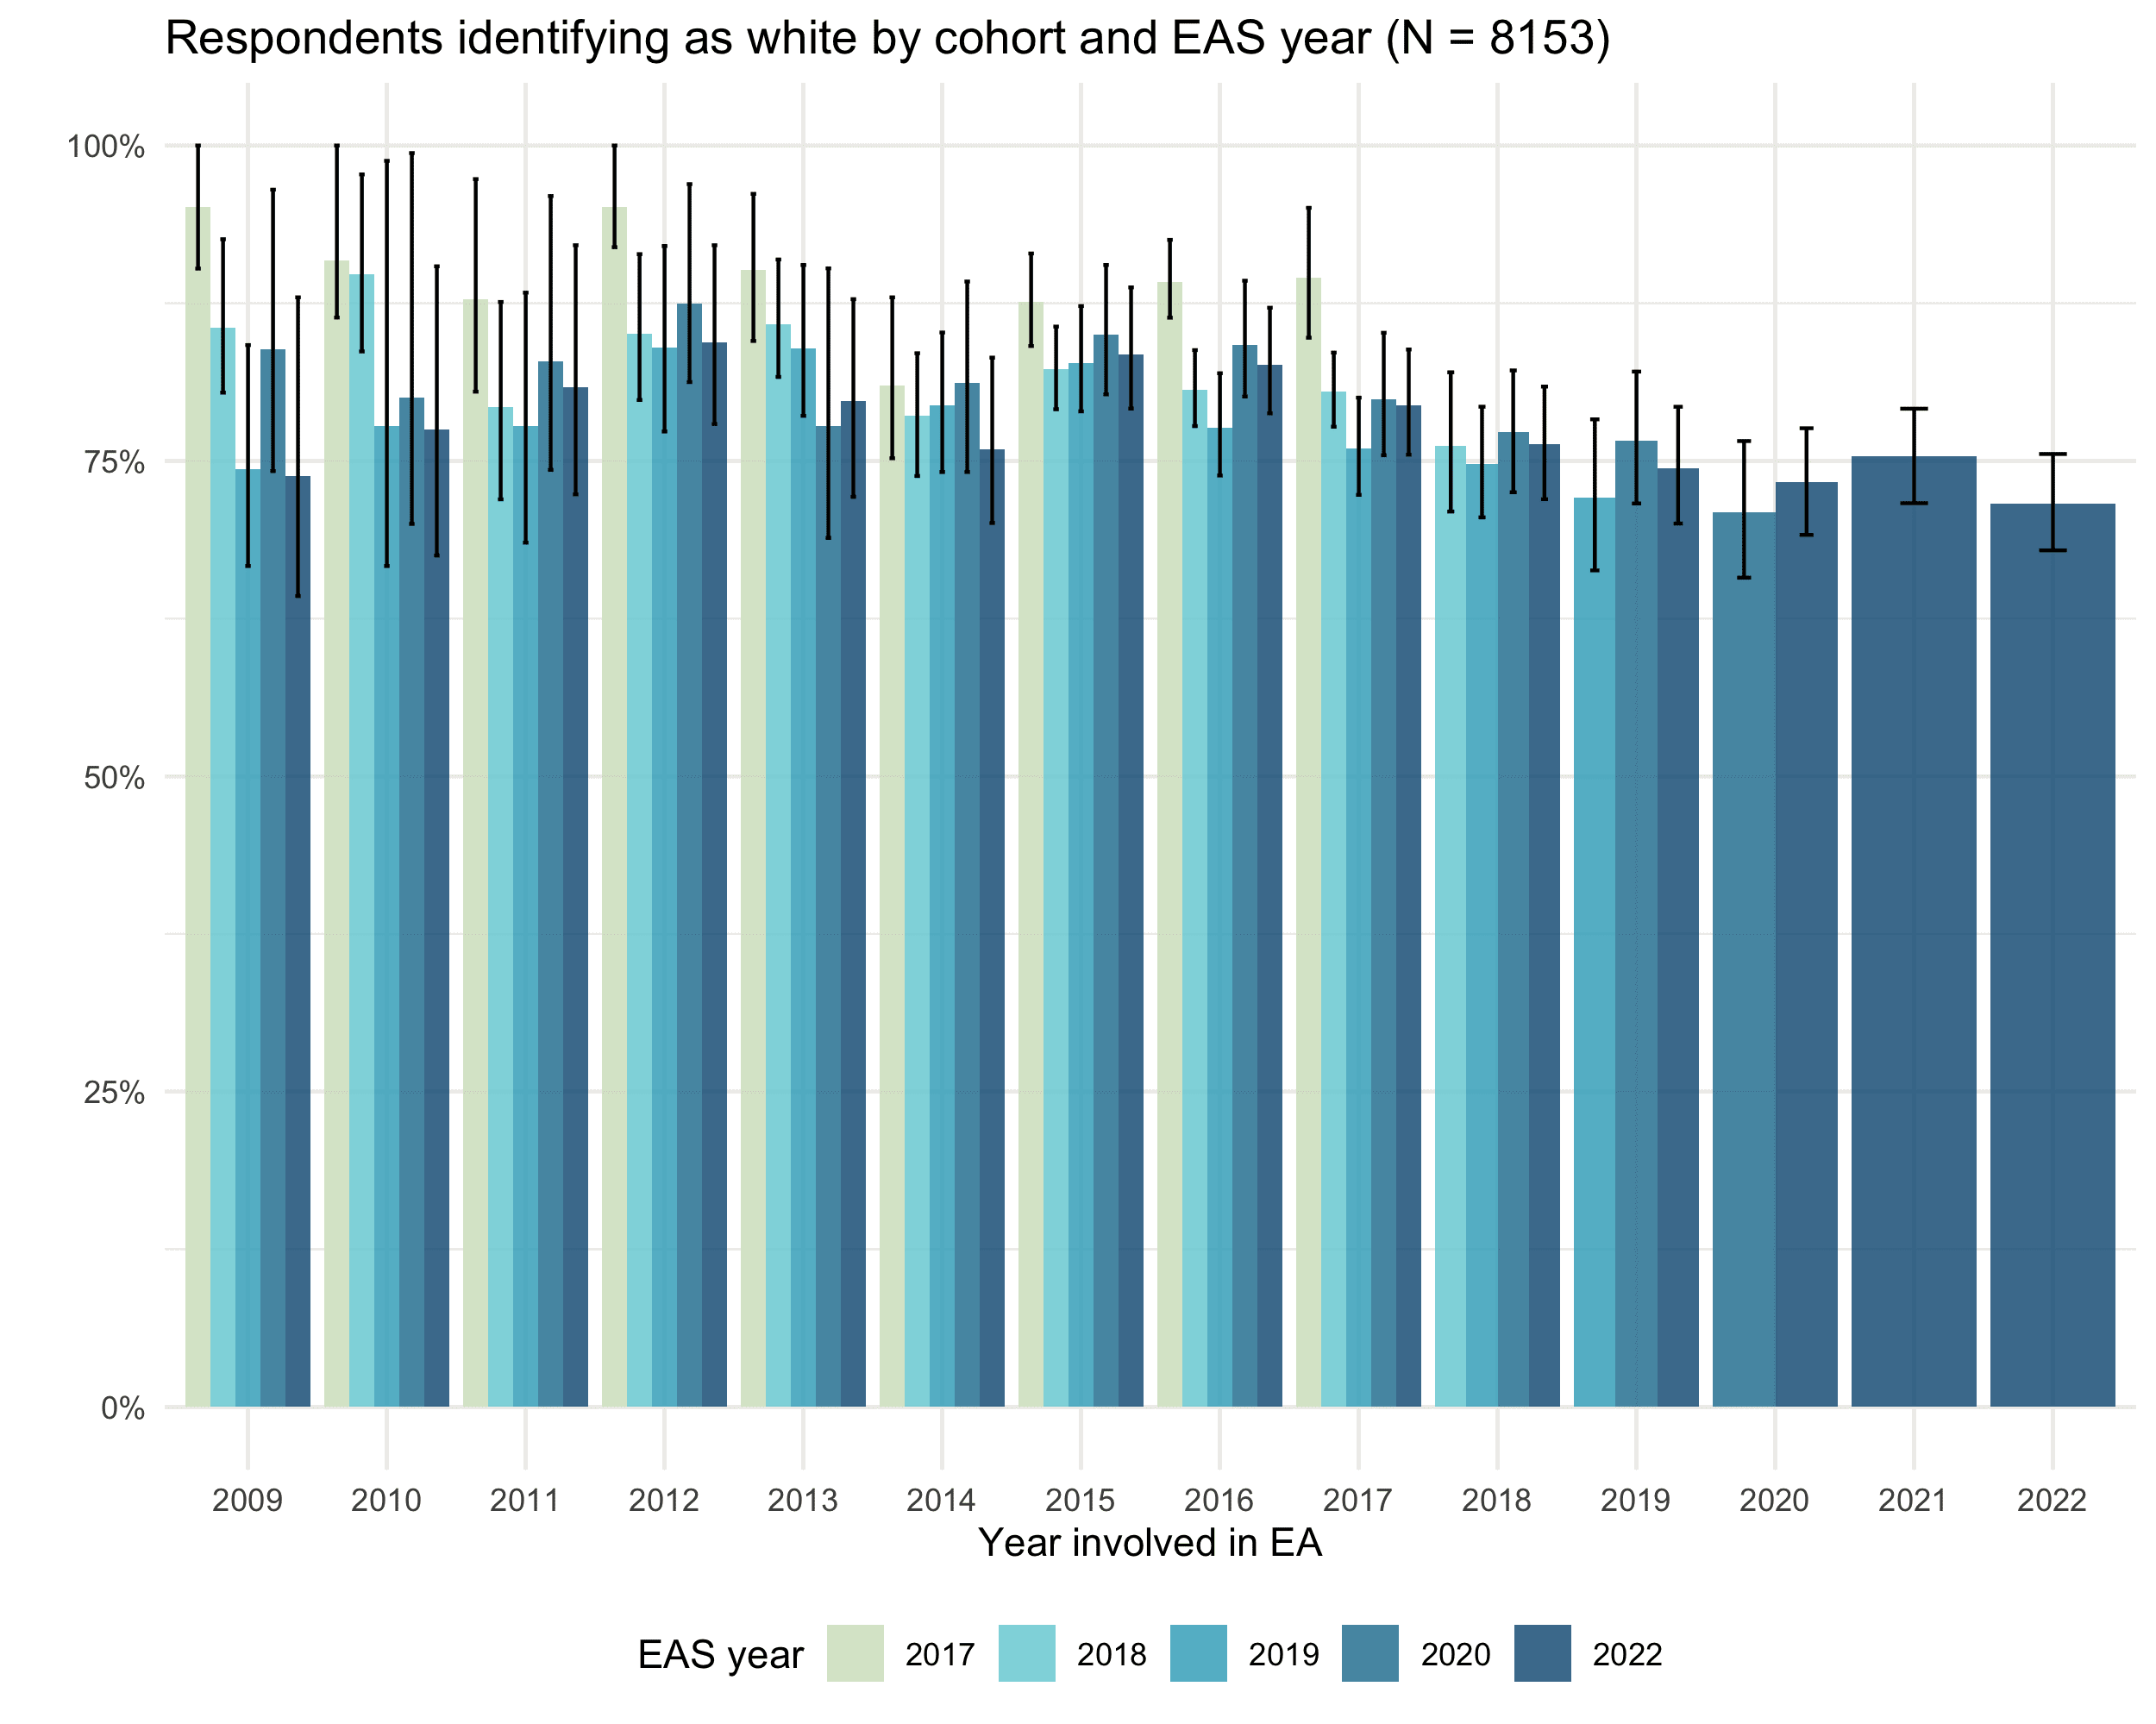
Race/ethnicity by year
We observe a slight decrease in the proportion of respondents identifying as white compared to the earliest years, though the percentages are relatively flat after 2017-2019. As in previous years, in our forthcoming post in this series, we will highlight positive and negative experiences of the community across different groups within the community.
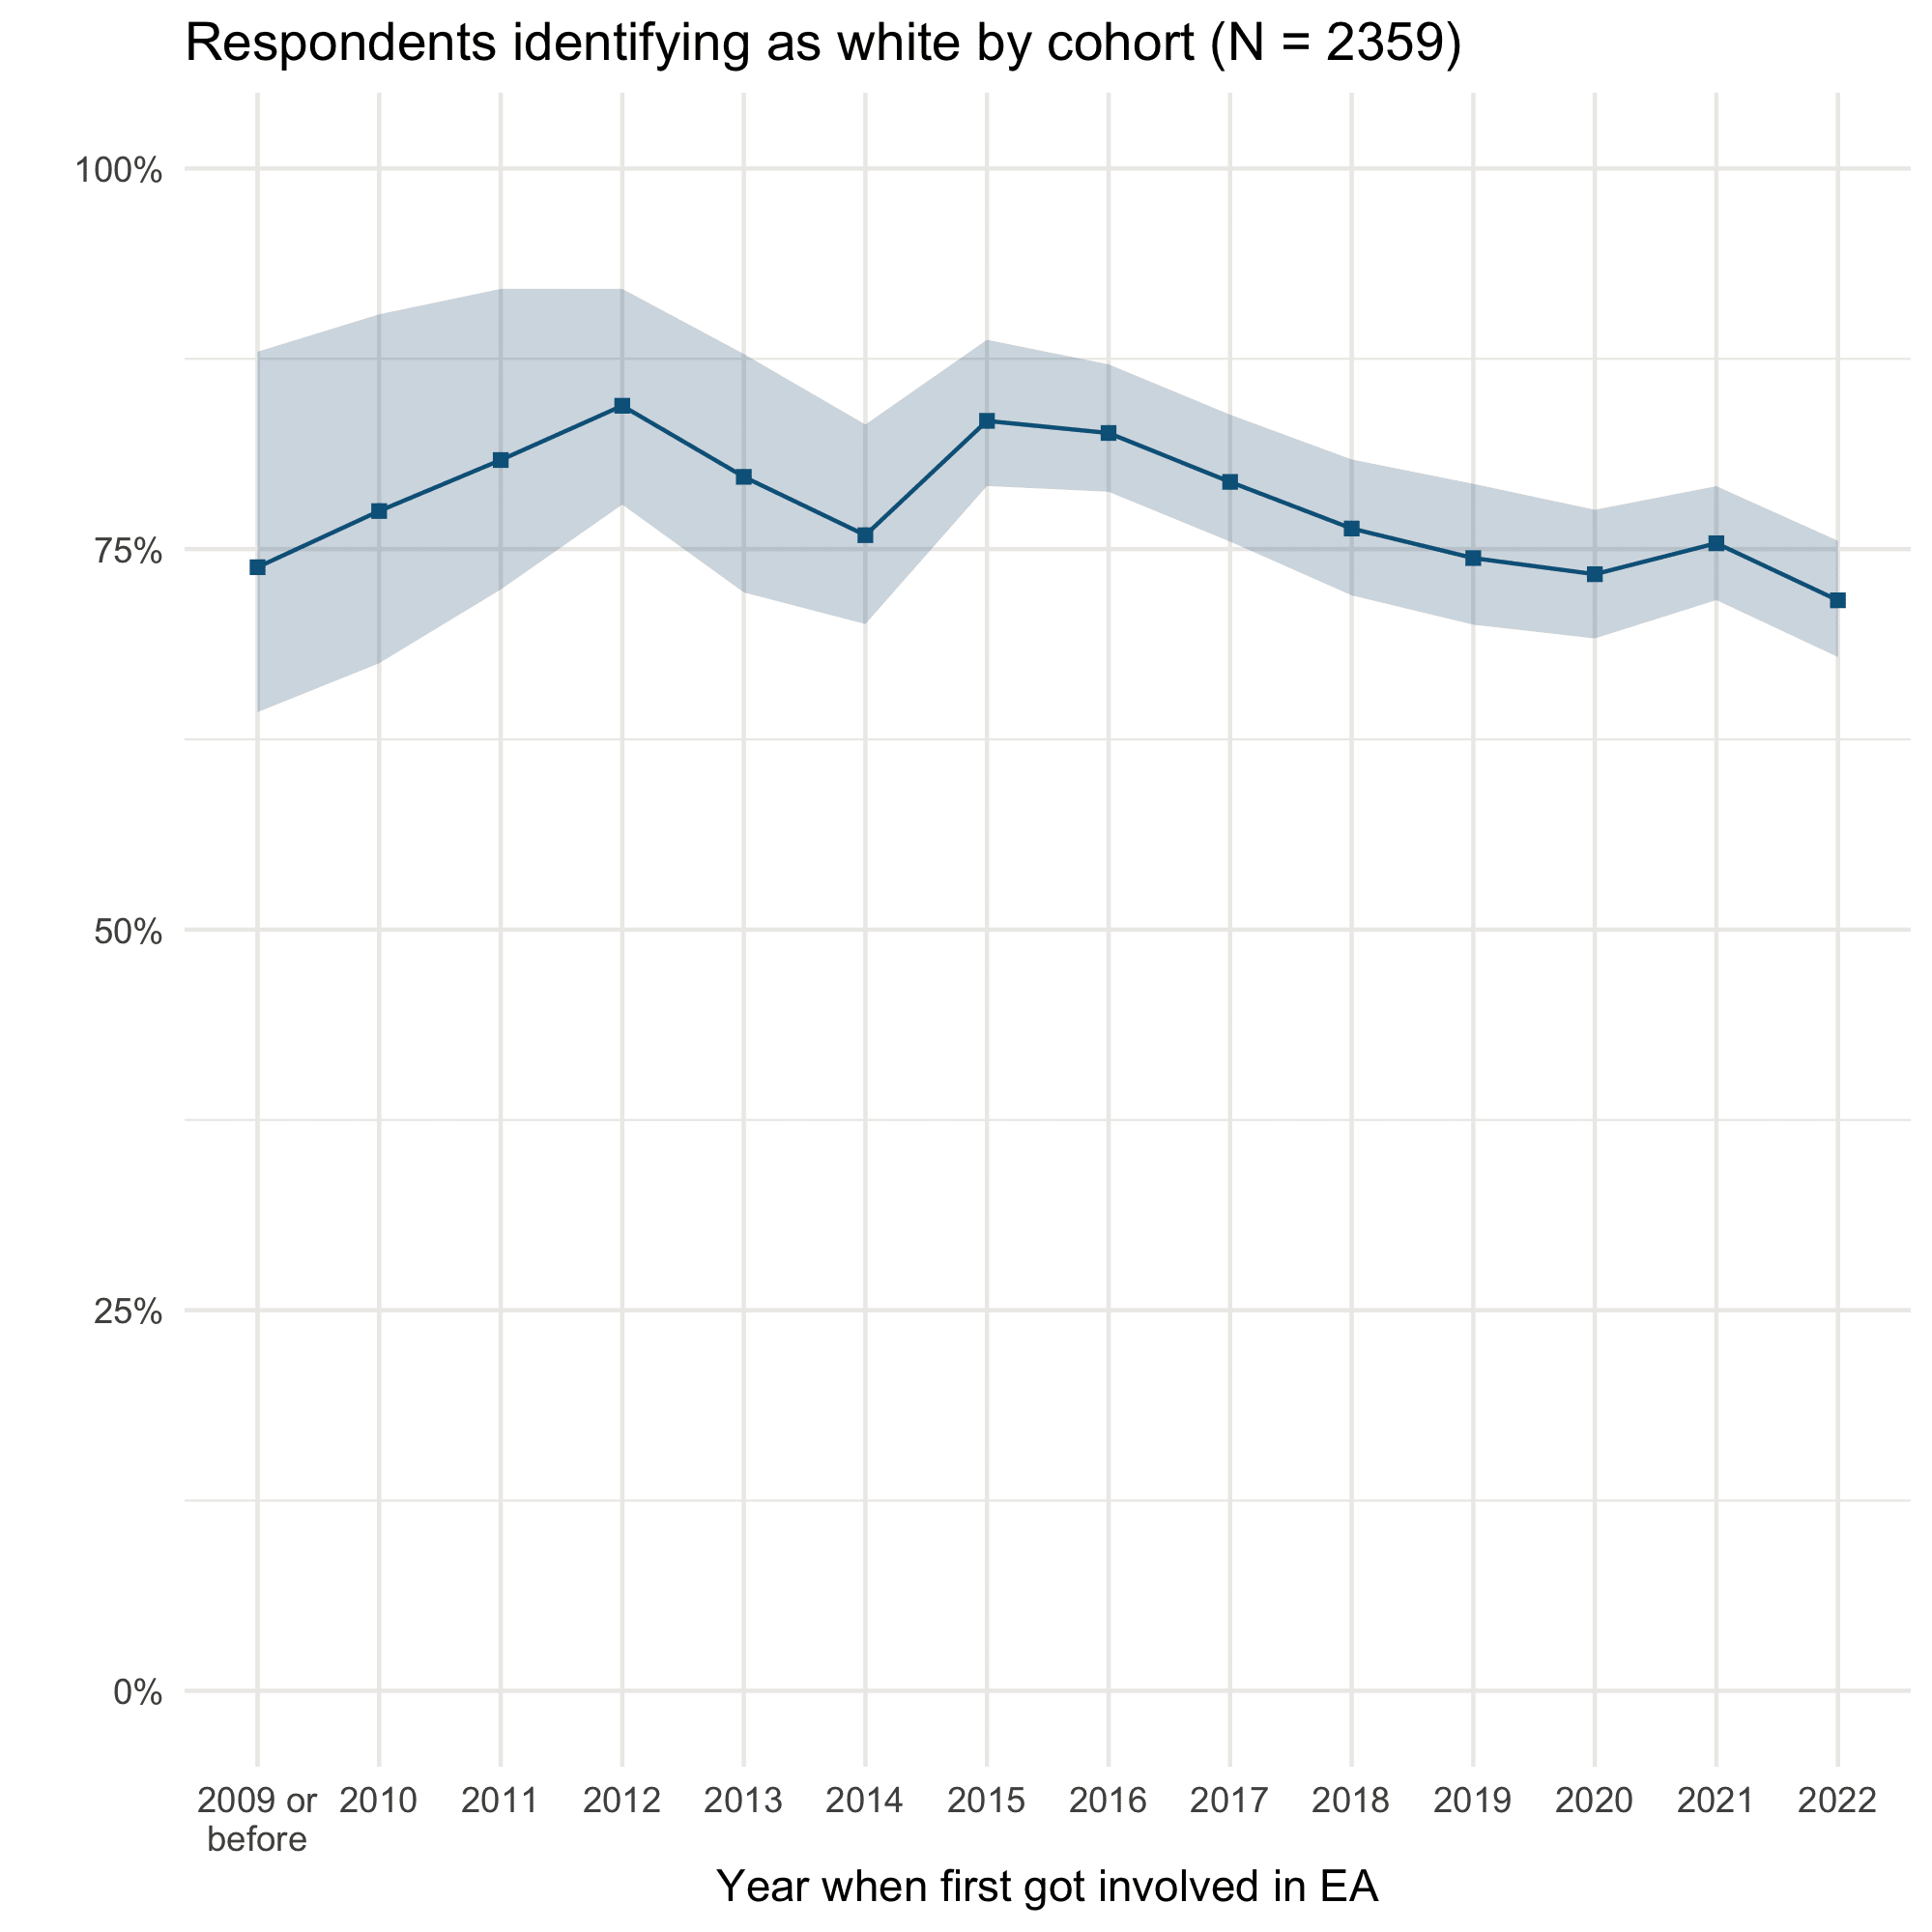
Race/ethnicity across cohorts
The trend across cohorts is less clear for race/ethnicity than for gender, however, there appears to be a slight reduction in the percentage of white respondents among those who joined EA more recently. As noted above, this is compatible either with increasing recruitment of non-white respondents in these cohorts or with higher attrition of non-white respondents.
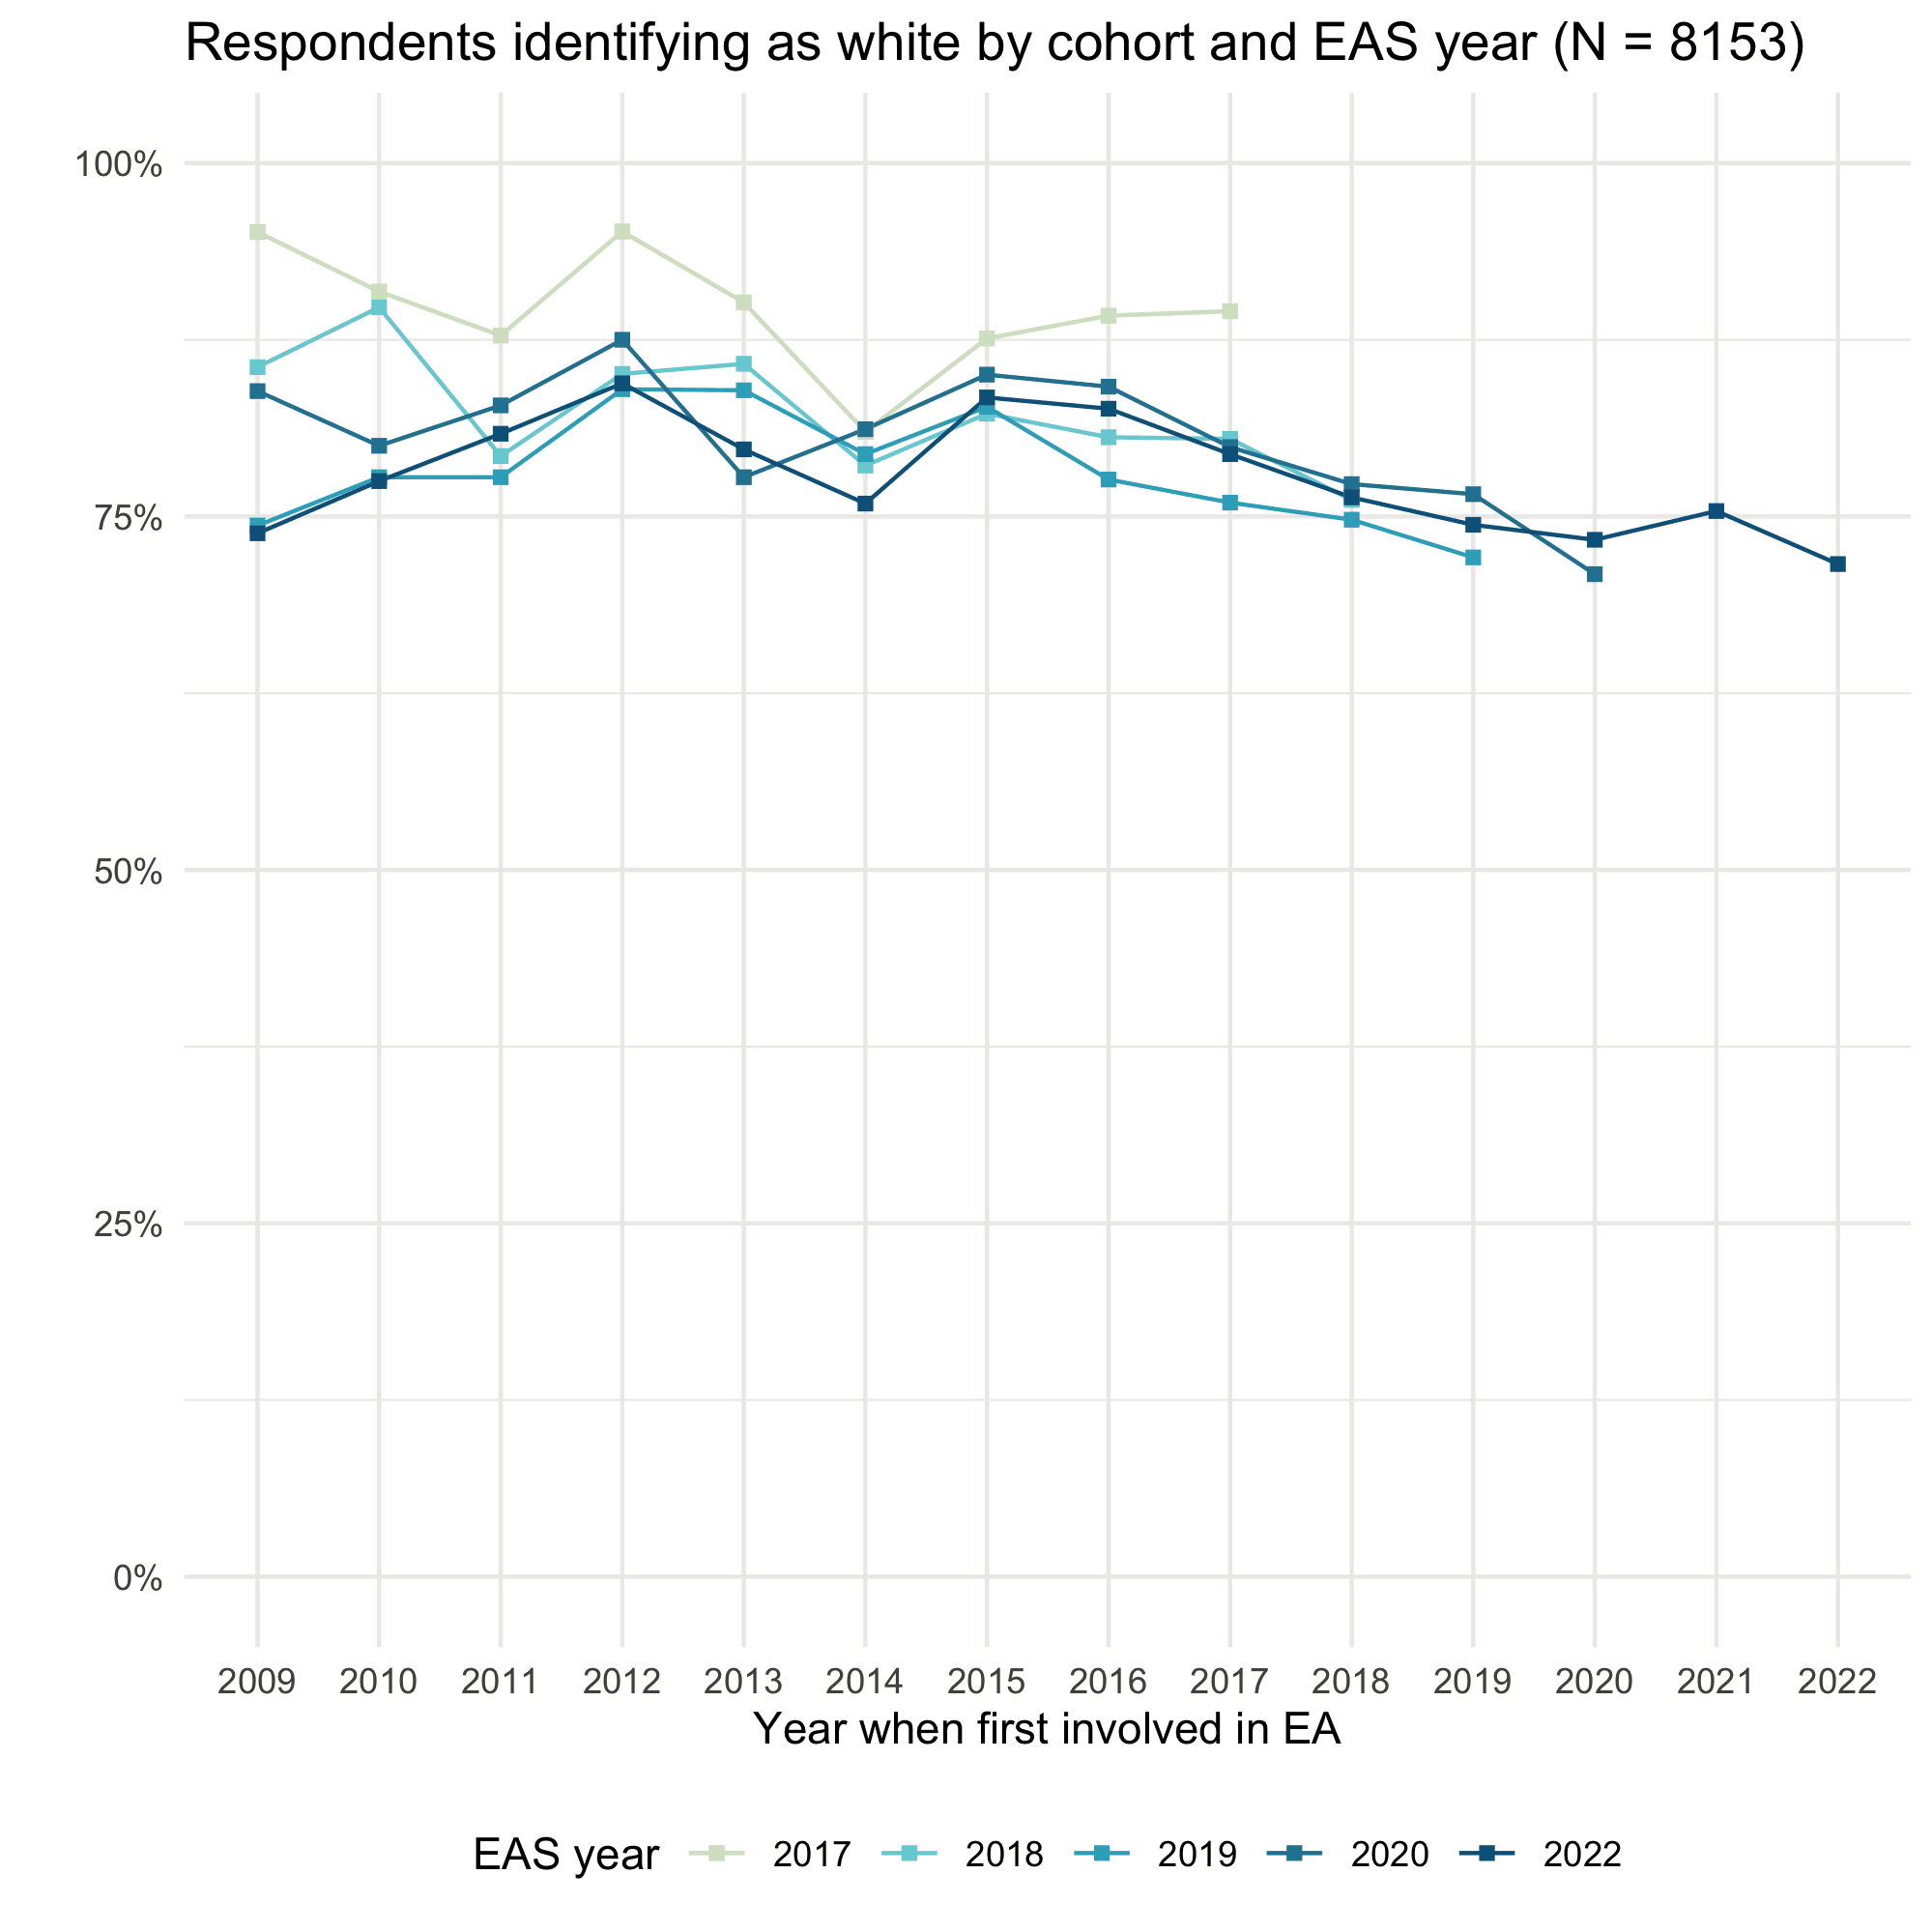
Race/ethnicity by cohort by year
Comparing each cohort across survey years, we see relatively little difference in the percentage of white respondents (this is confirmed by examining the second plot below) and no significant differences aside from EAS 2017 (the earliest survey analysed here) having more white respondents.
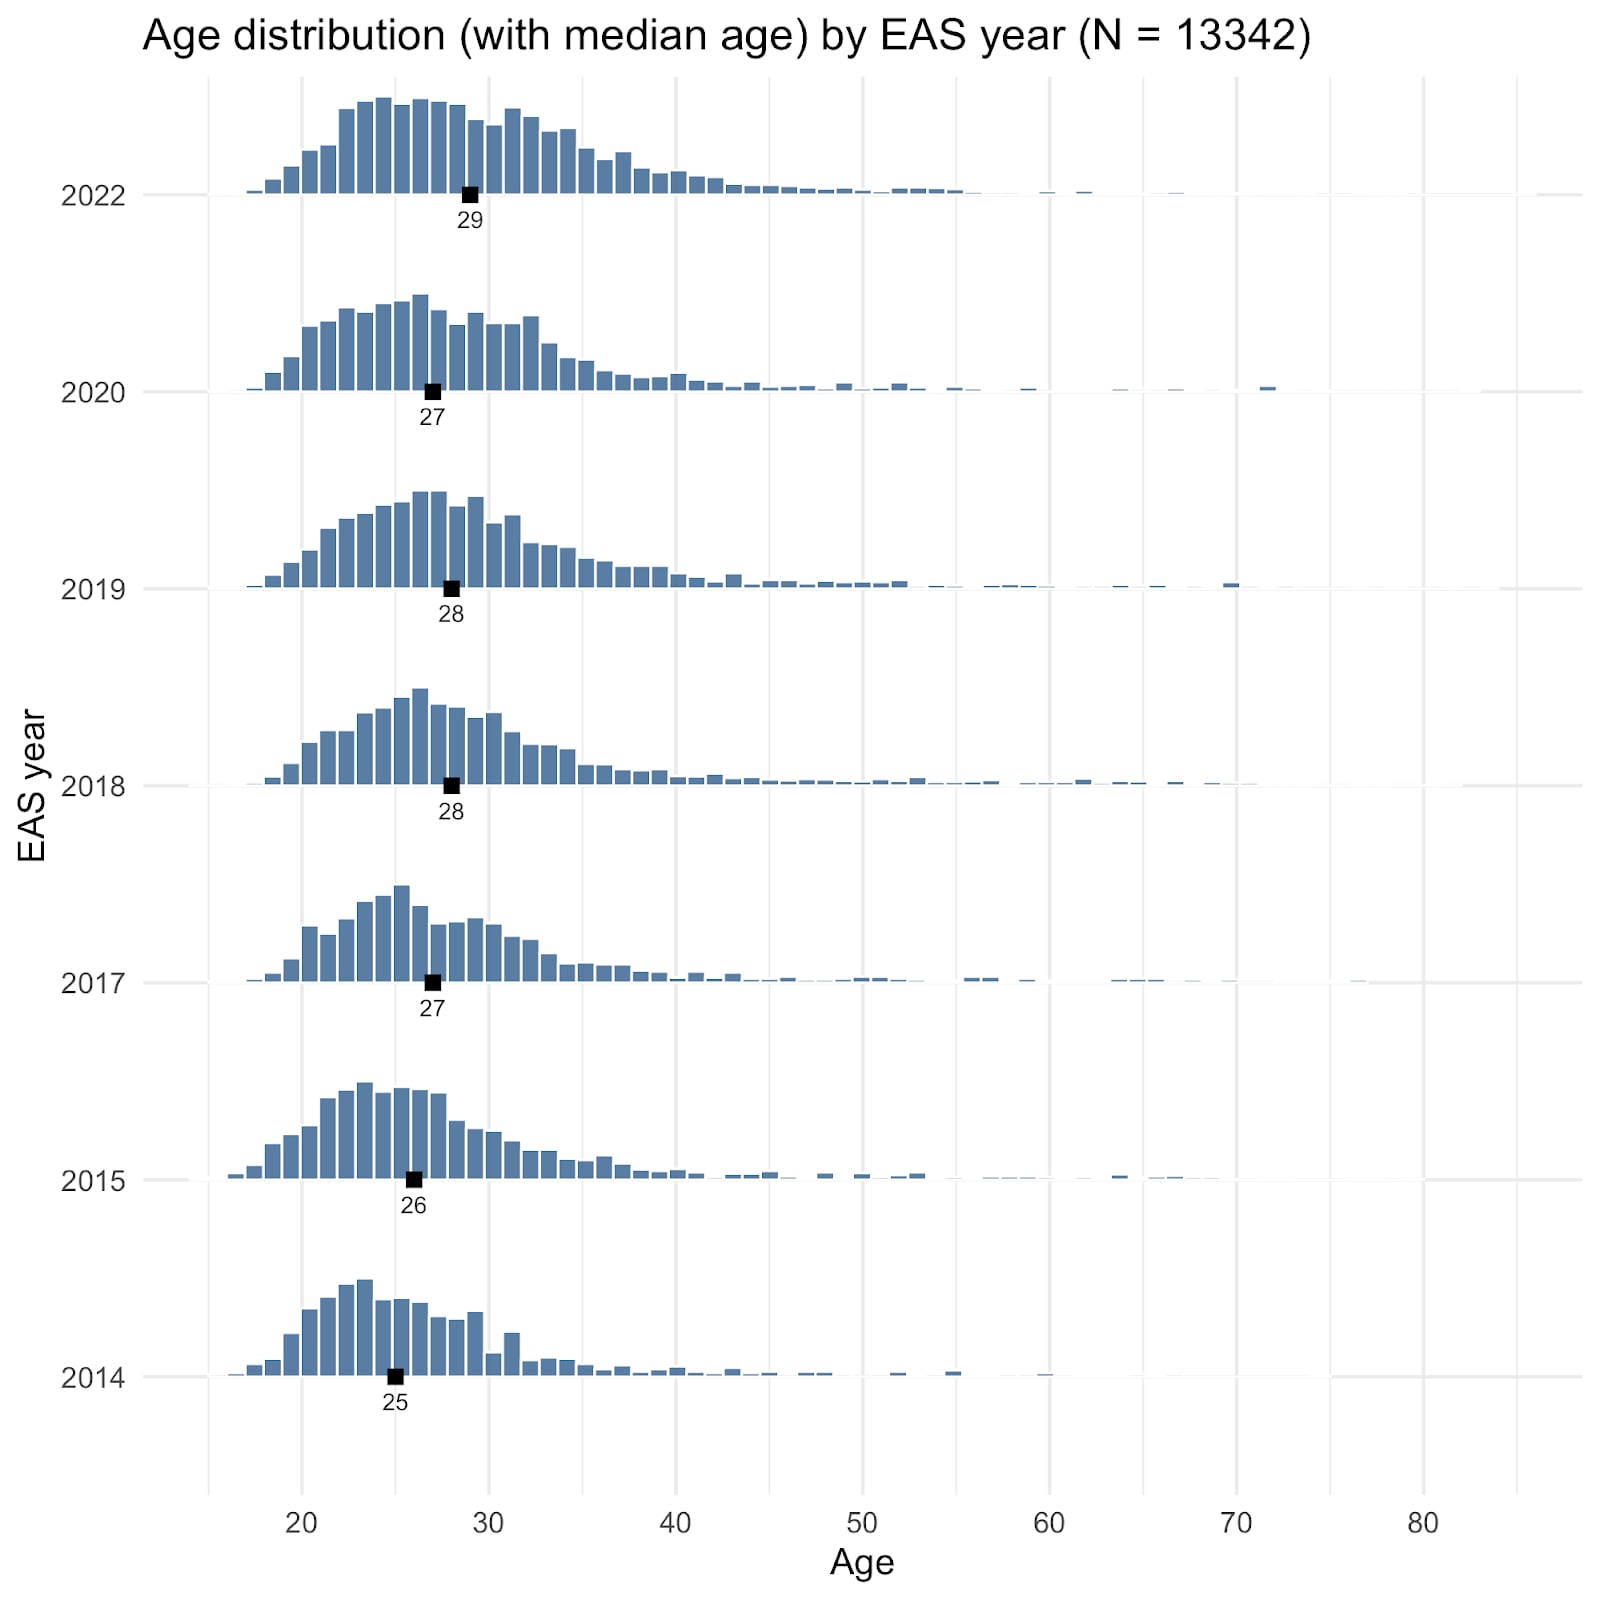
Age
The age of respondents remains disproportionately young, though, as shown in the section below, the average age is increasing with time (reaching 29 in 2022 up from 25 in 2014).
Changes in age over time
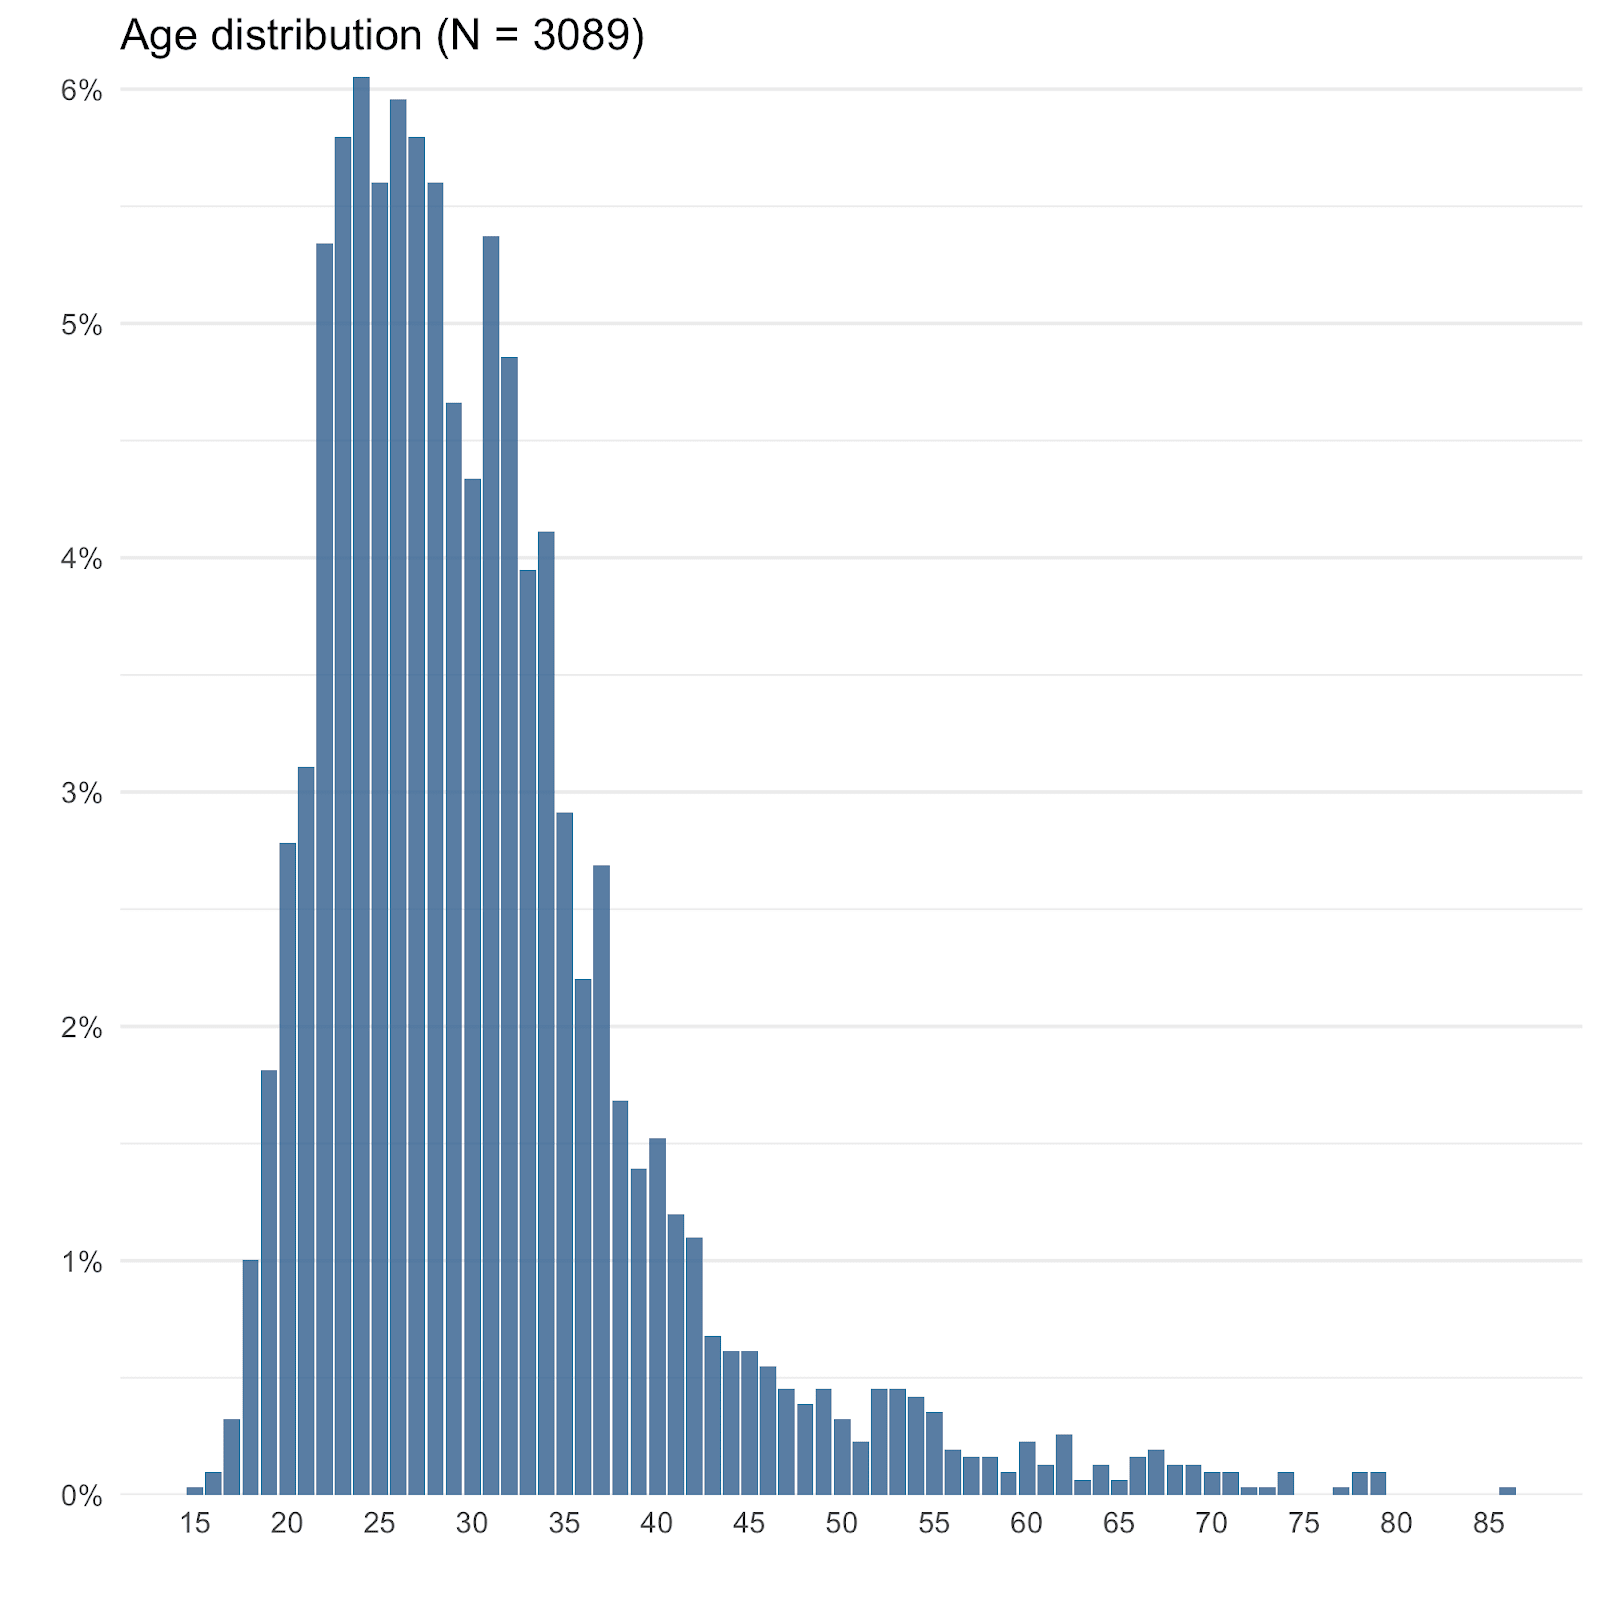
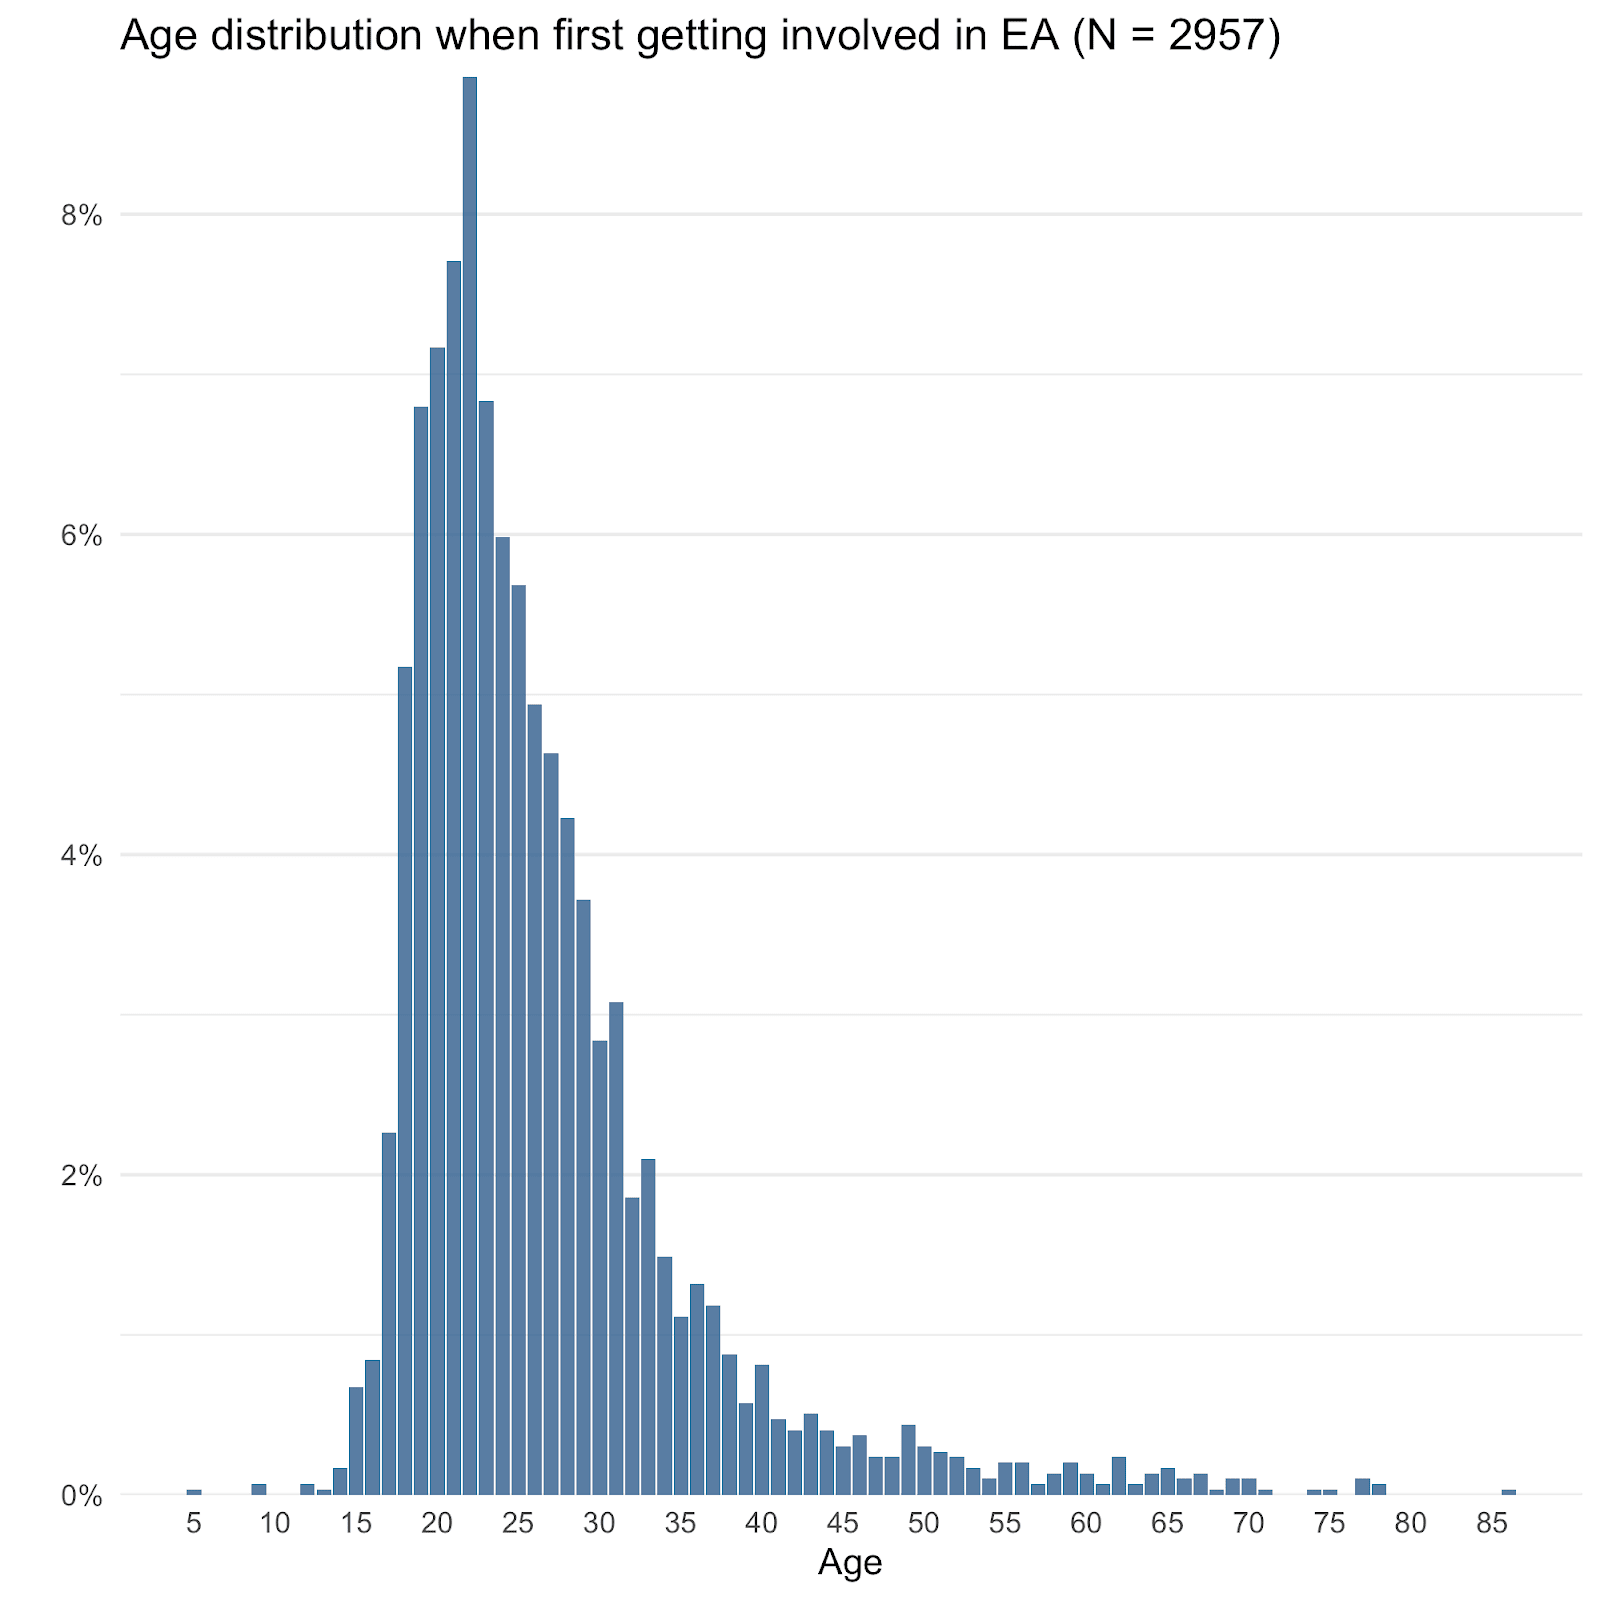
Age when first getting involved in EA
The median age when respondents reported first getting involved in EA was 24 (with a slightly higher mean of 26.49).
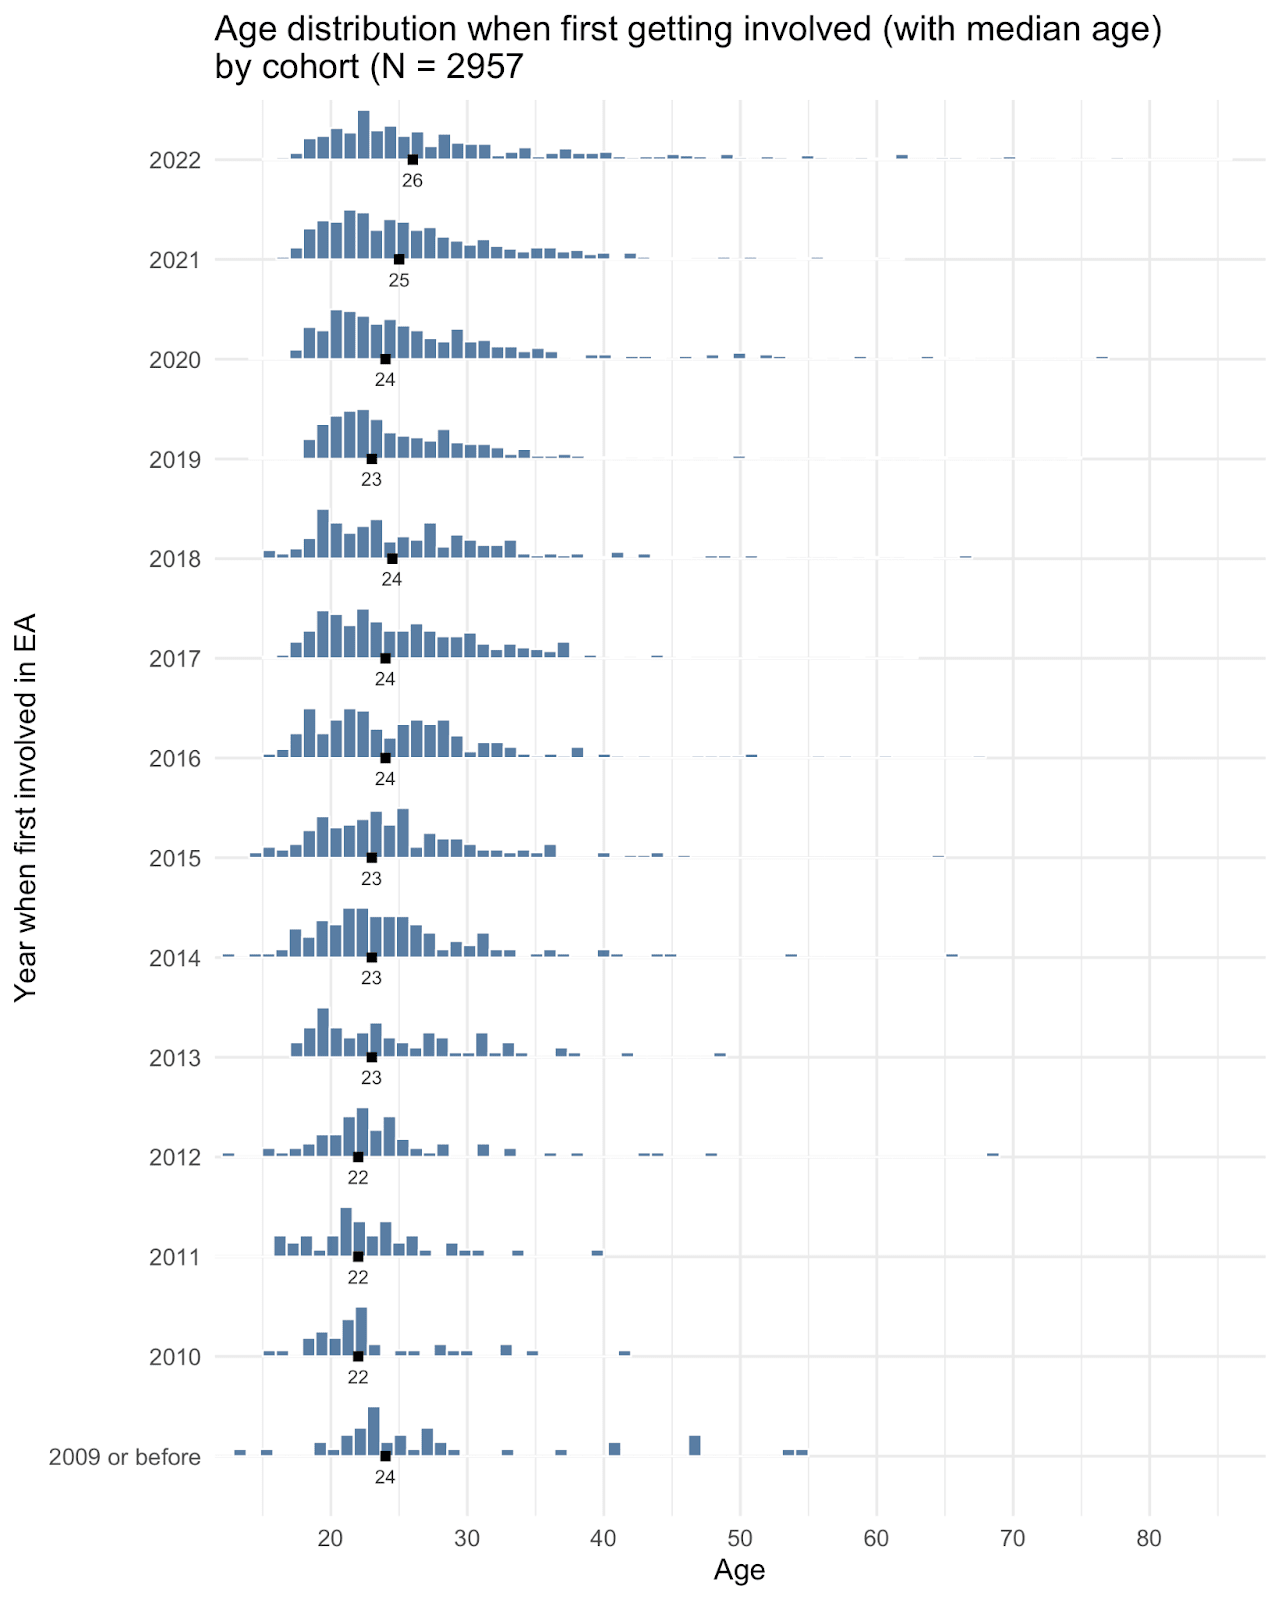
Age of first getting involved by cohort
The average age at which people first got involved in EA has also continued to increase (now at median 26). As we commented last year, this is somewhat older than the age of the typical college student (though a large minority (41.13%) of those who joined EA within the last year were students).
Careers and Education
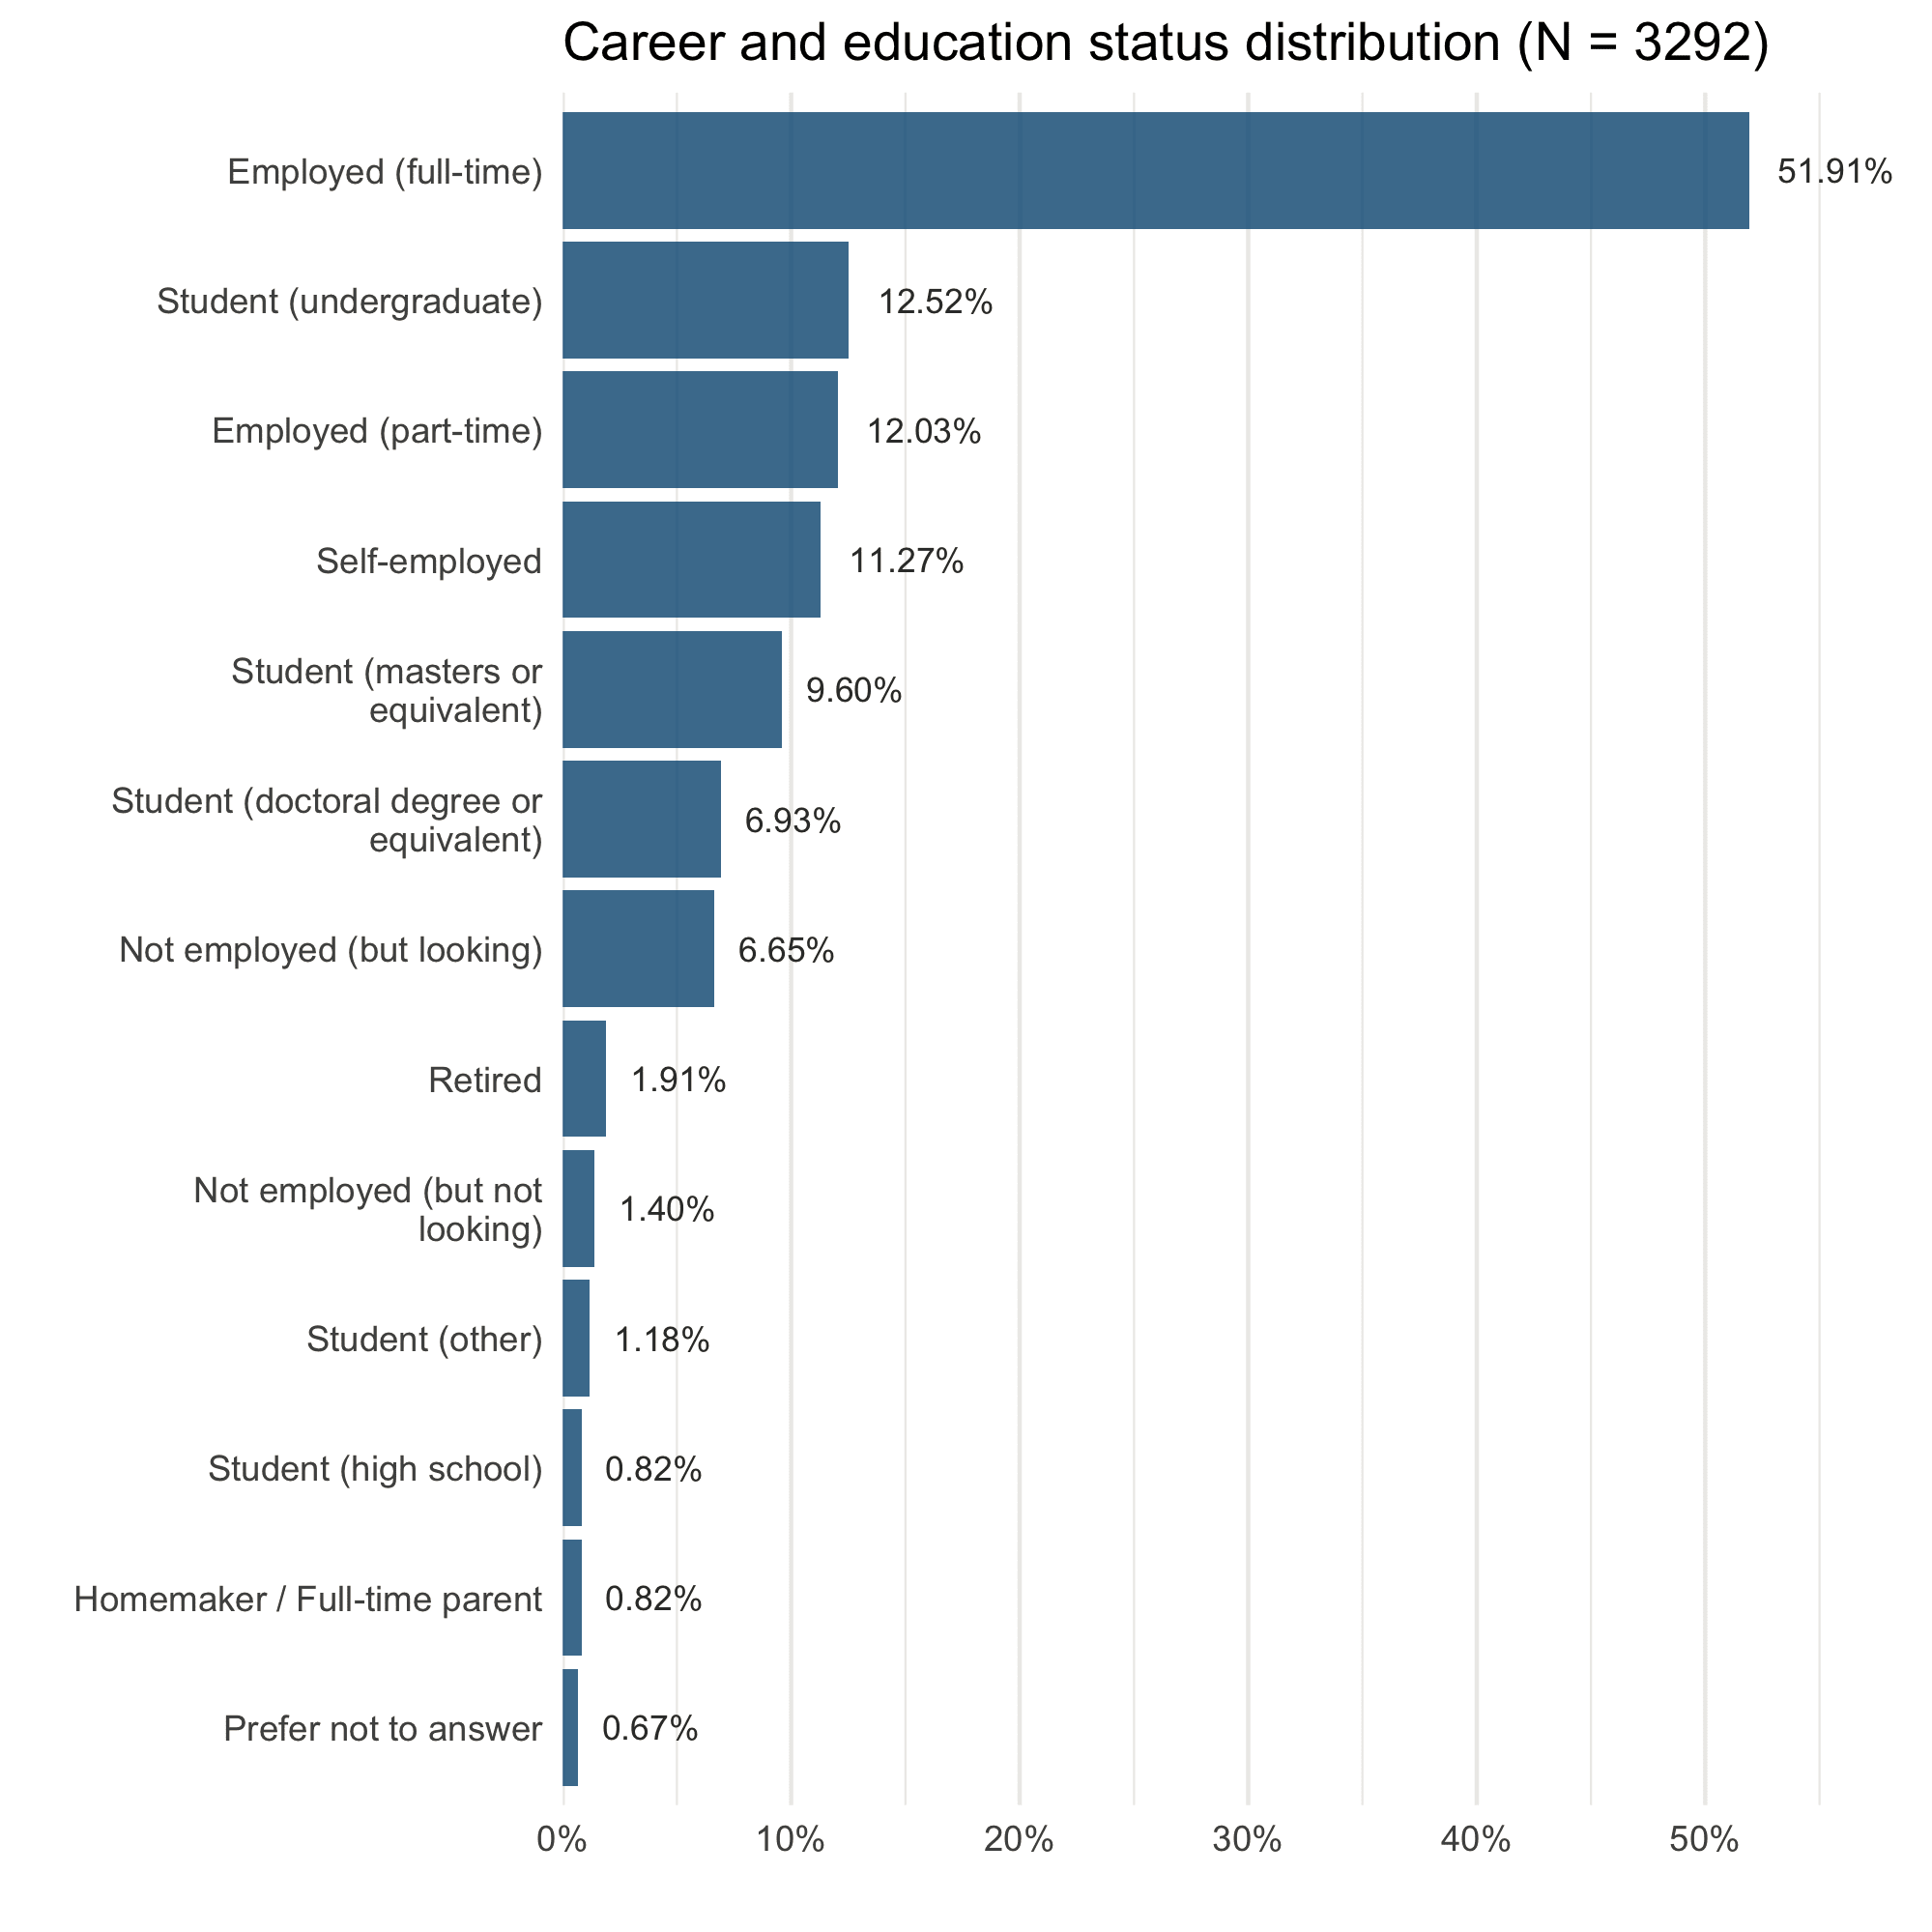
Employment/student status
Despite being composed of a relatively large number of students, a majority of respondents (just over half) are in full time employment.
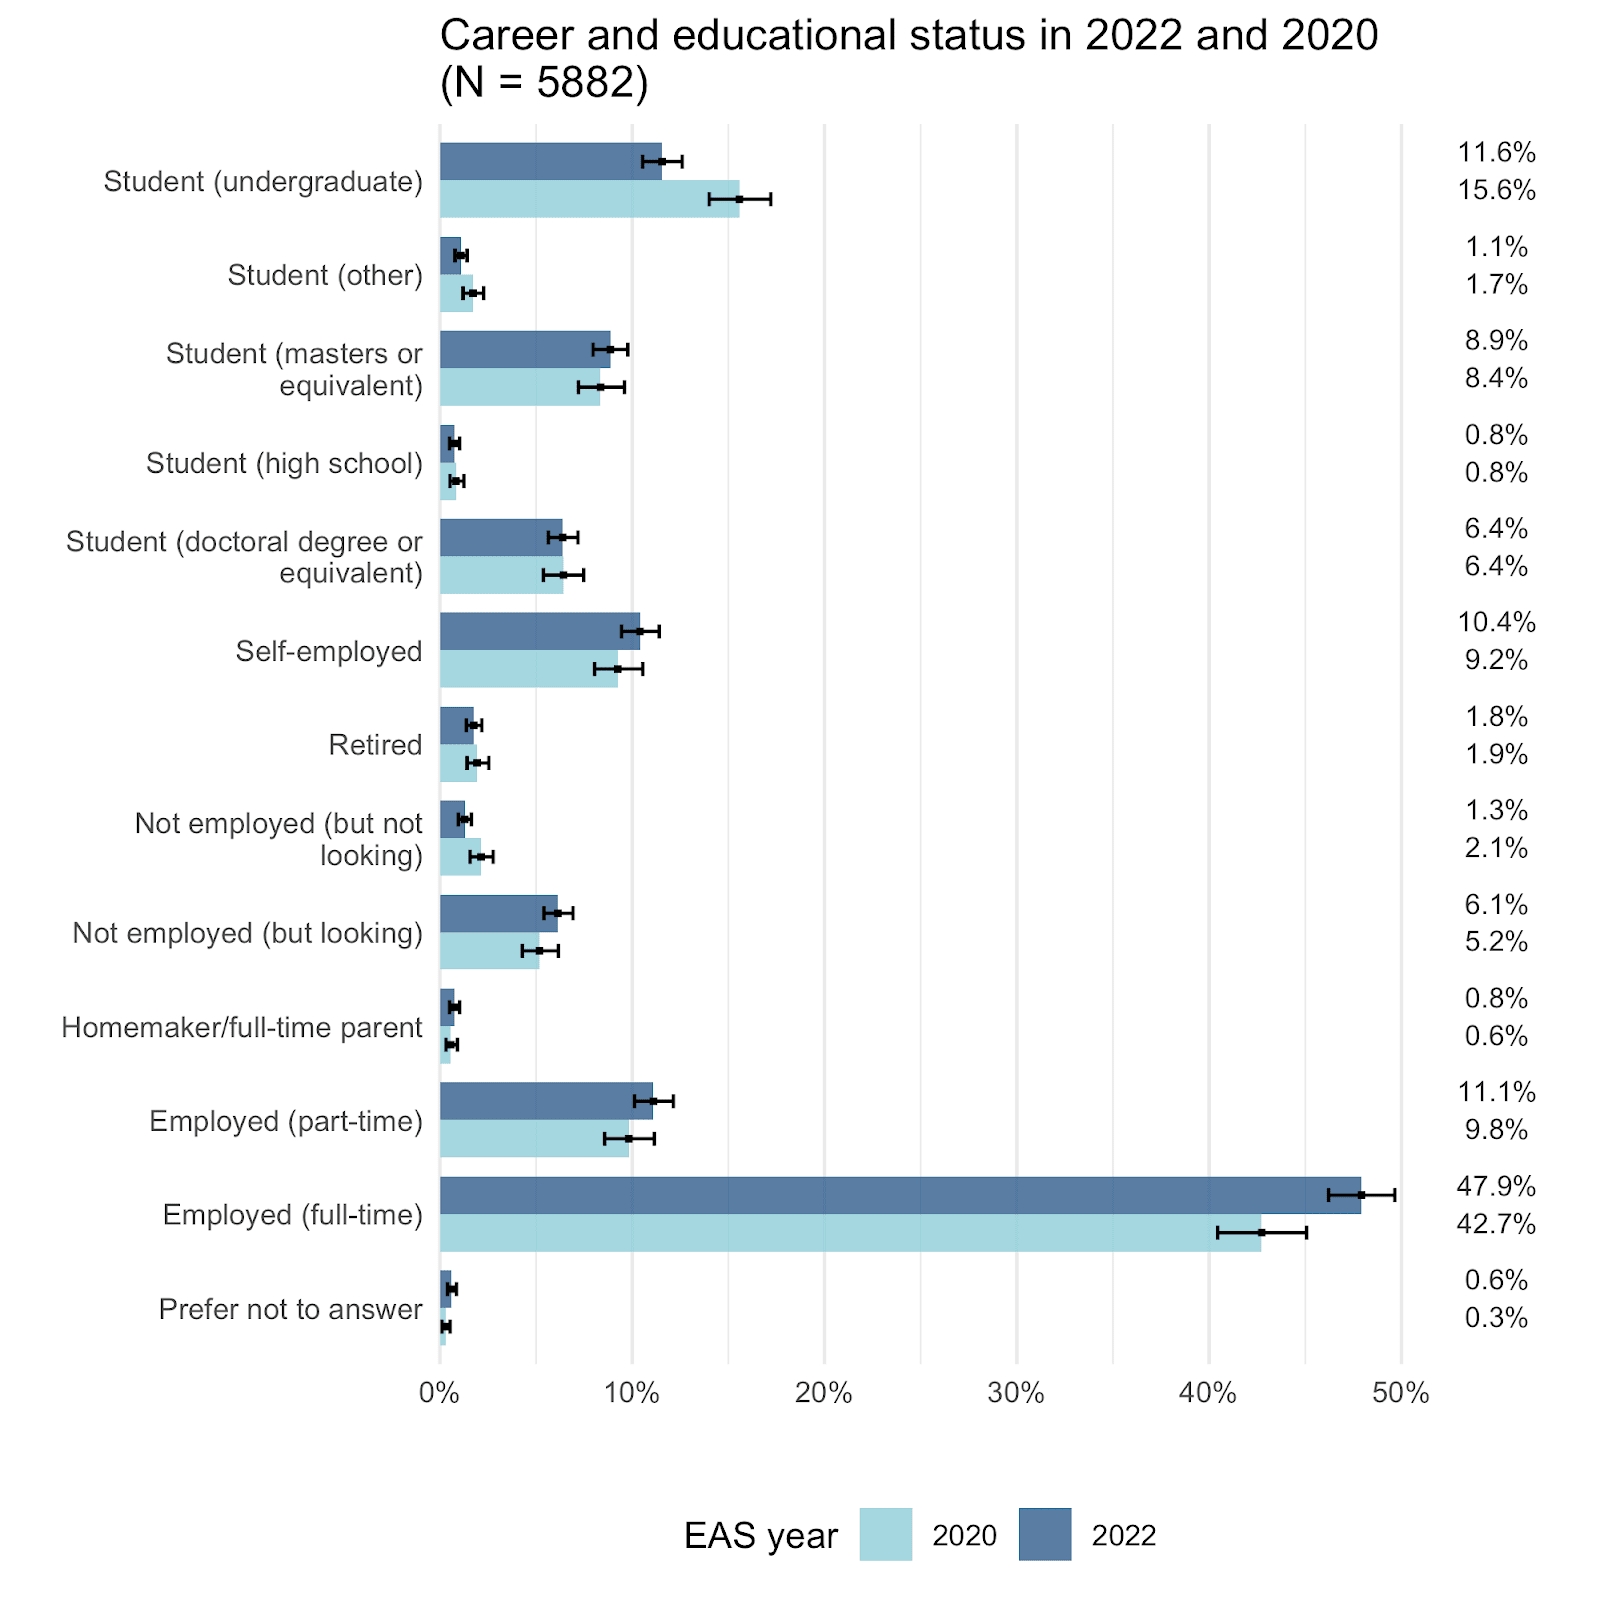
Employment/student status by year
Here we can only compare the results to those from EAS 2020 (so that the categories are comparable). We observe that the percentage of students in the movement has decreased and the percentage in employment has increased.
Career strategy
Perhaps unsurprisingly, the career area that is the focus for the largest number of EAs is research, although a large number are still deciding. However, it may still be striking that there are more than twice as many EAs interested in a career in research as in any one of earning to give, government and policy, entrepreneurship or community building.
Career strategy by gender
These results show significant differences in the proportions of respondents of different genders following career paths in research and organization building, with more men in the former and fewer men in the latter.
Career strategy by race/ethnicity
We observe no statistically significant differences in career paths of white and non-white respondents.
Career strategy by engagement level
There were large differences in the career strategy of low/high engagement EAs.[5] Many more highly engaged EAs were focused on research and community building, while many more less engaged EAs were focusing on earning to give or not focusing their career on impact right now.
University
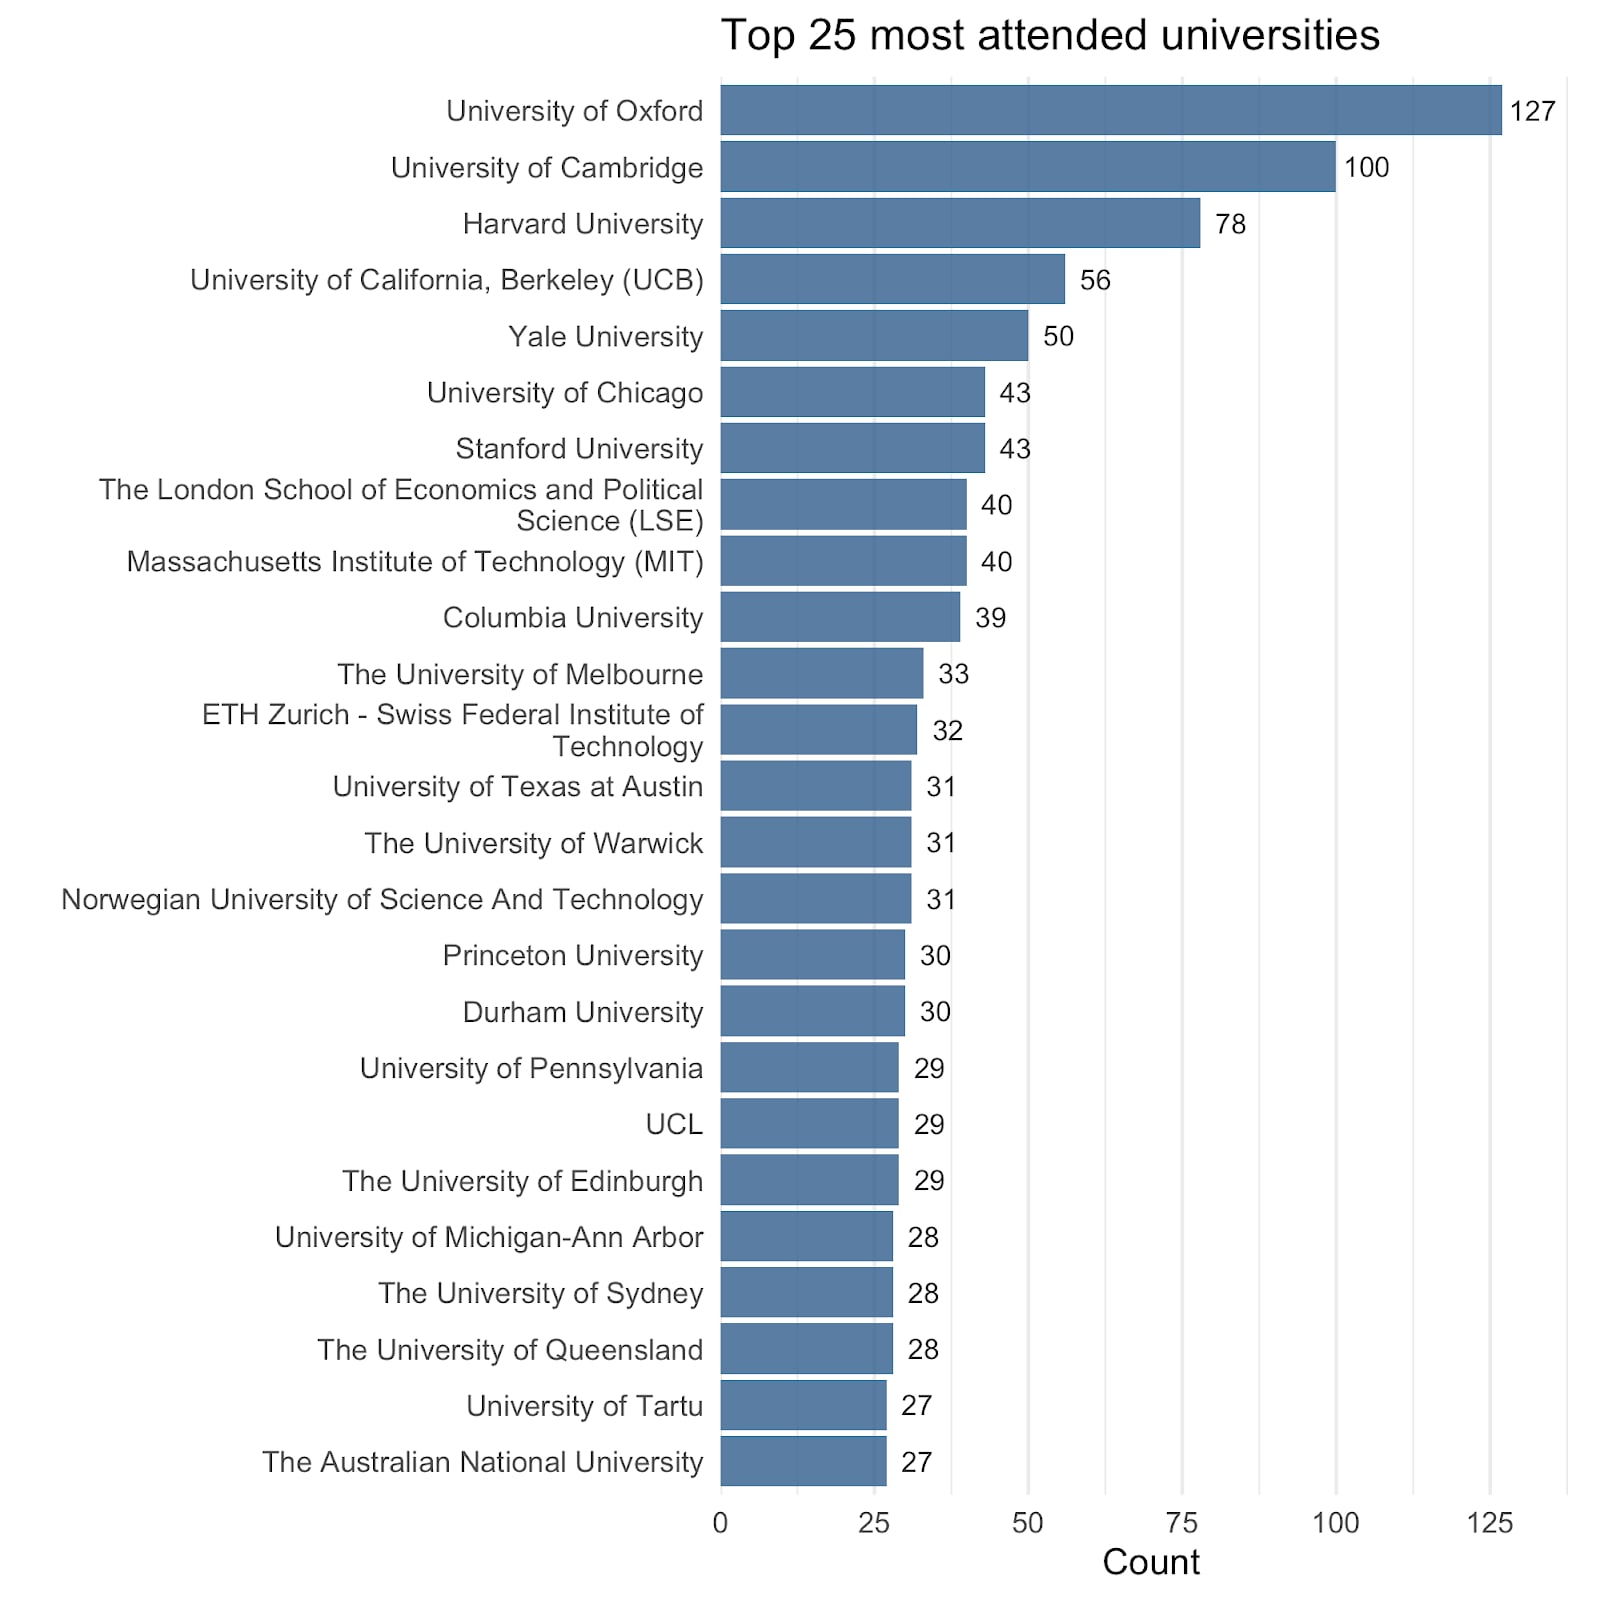
A disproportionate number of EAs attend highly (QS) ranked universities. This first plot shows the number of EAs having attended the most commonly attended universities in our sample which are mostly quite highly ranked.
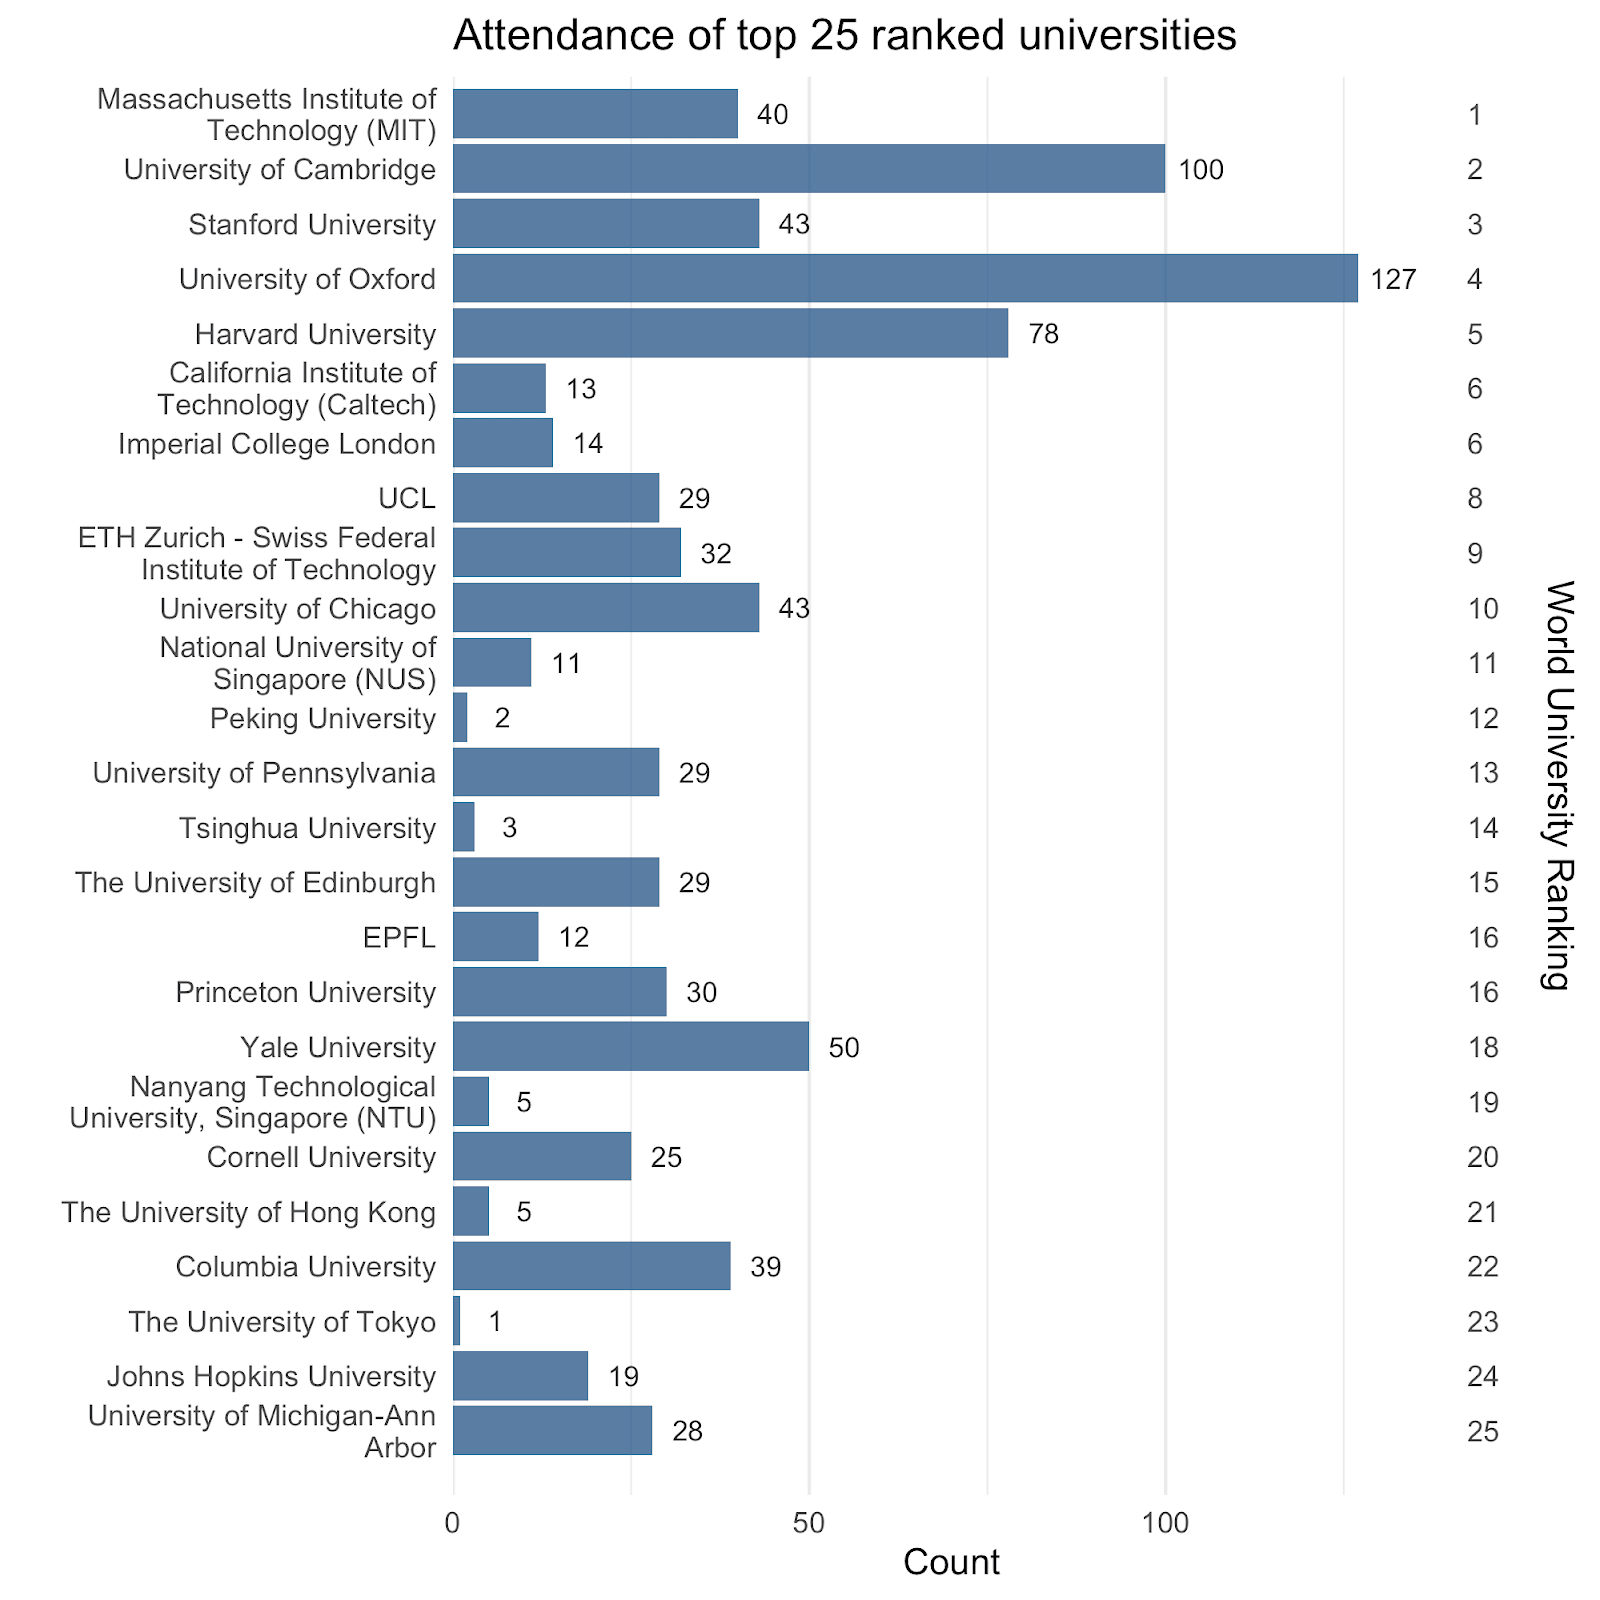
This second plot shows the number of EAs attending the top 25 ranked universities. Notably a number of the globally top-ranked universities which have low numbers of EAs are not in majority English-speaking countries.
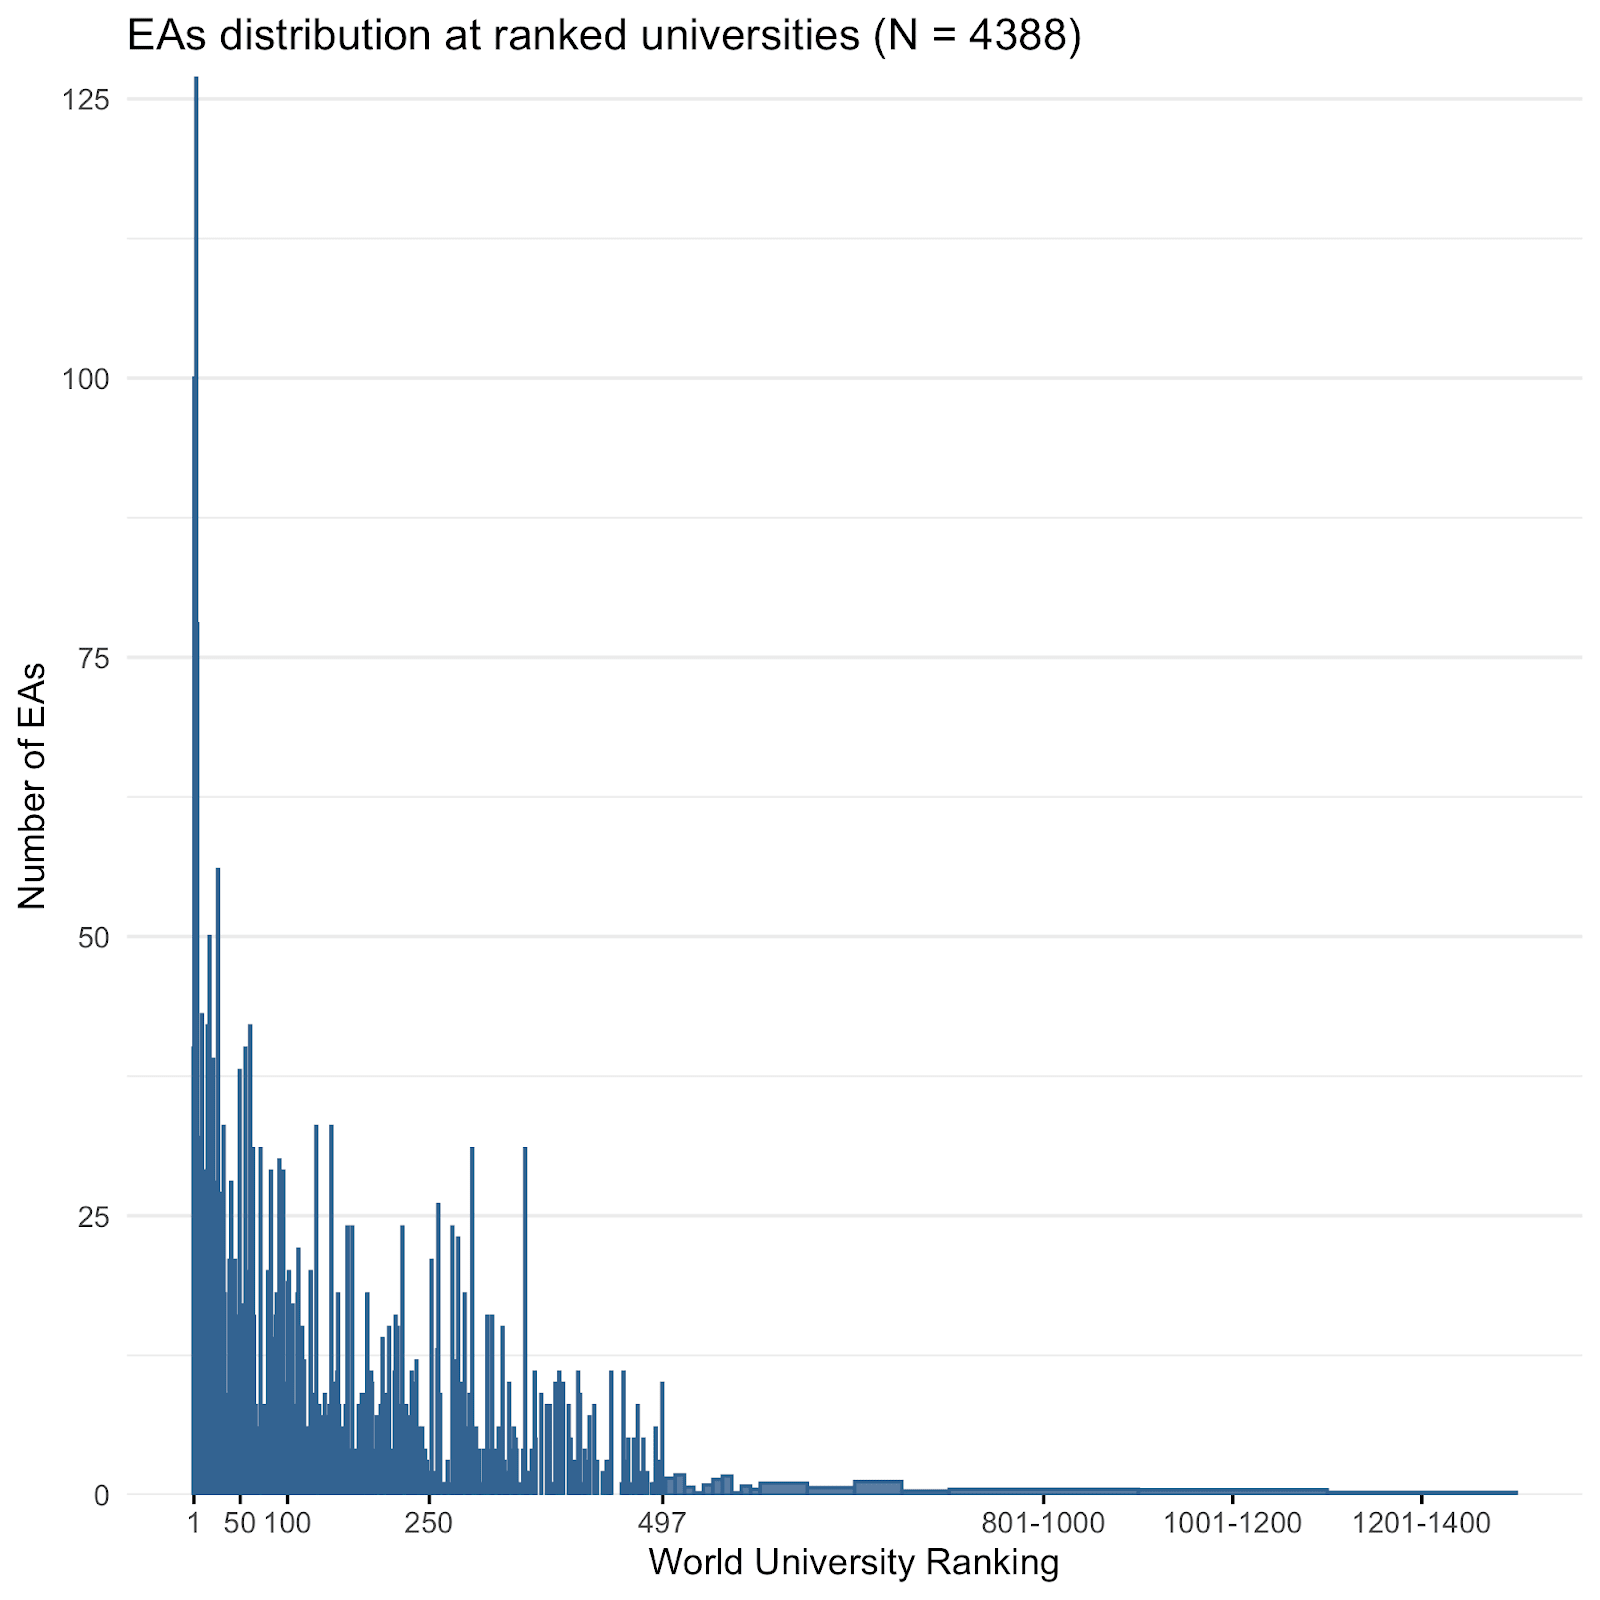
This final plot shows the number of EAs having attended each university plotted in order of university ranking, showing a clear general trend towards more EAs at higher ranked universities.
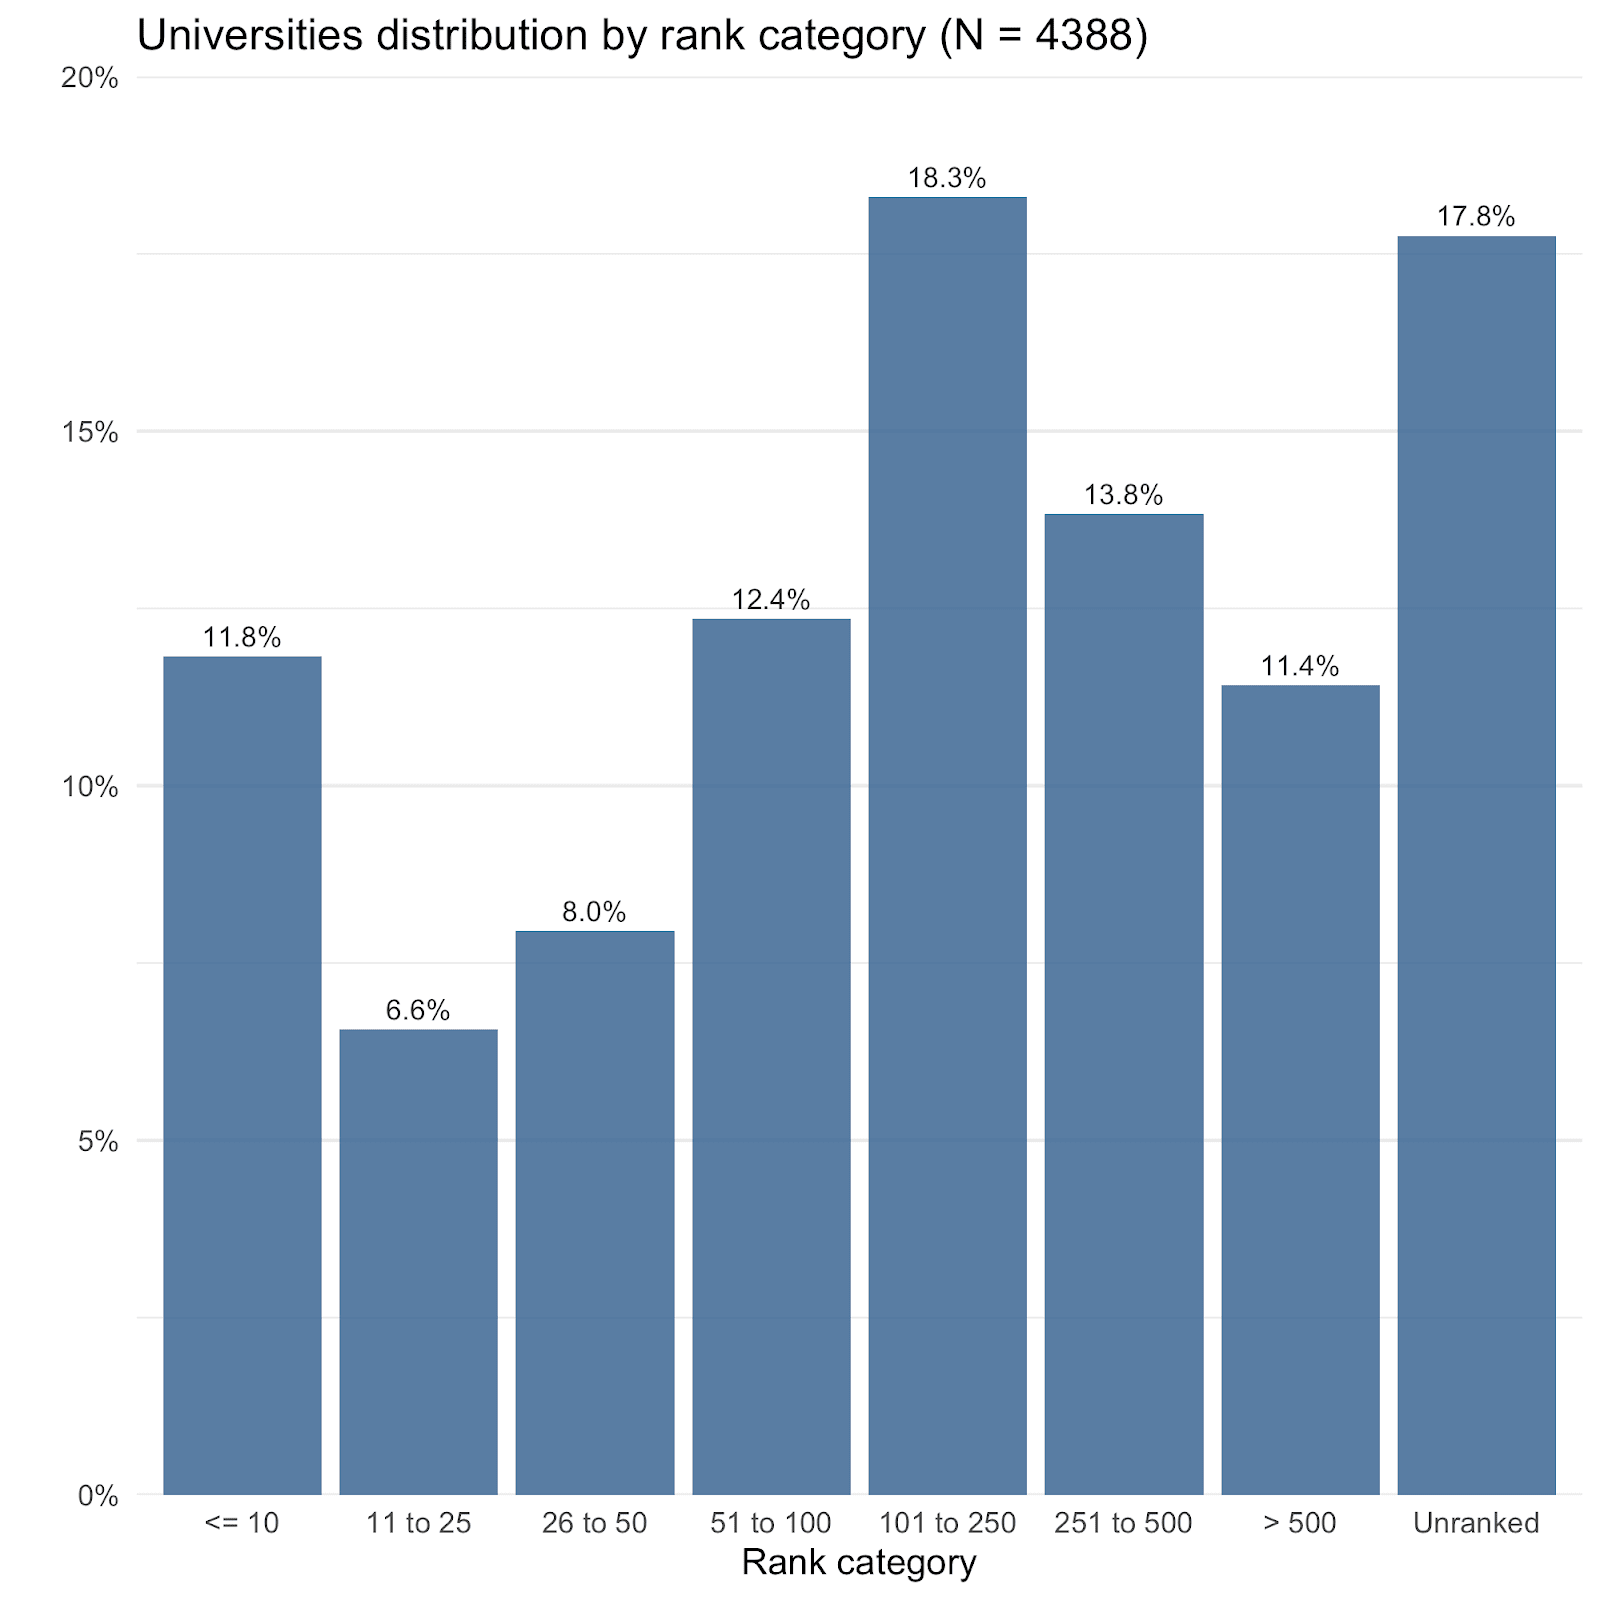
Finally, we show the number of EAs having attended universities of different ranks in broader bins. We can see that, though the EA community does have a disproportionate number of members who have attended highly ranked universities, this is far from a majority. While 11.8% have attended top 10 universities, 18.4% have attended top 25 ranked universities and 38% have attended top 100 ranked universities globally, 61.3% attend universities ranked outside the global top 250.
Beliefs
Politics
2022 is the first year that we have included politics and religion in the EA Survey, since 2019, after skipping them to save space.
The EA community remains majority left-leaning (76.8%) with very small numbers of respondents identifying as right-leaning (2.9%).
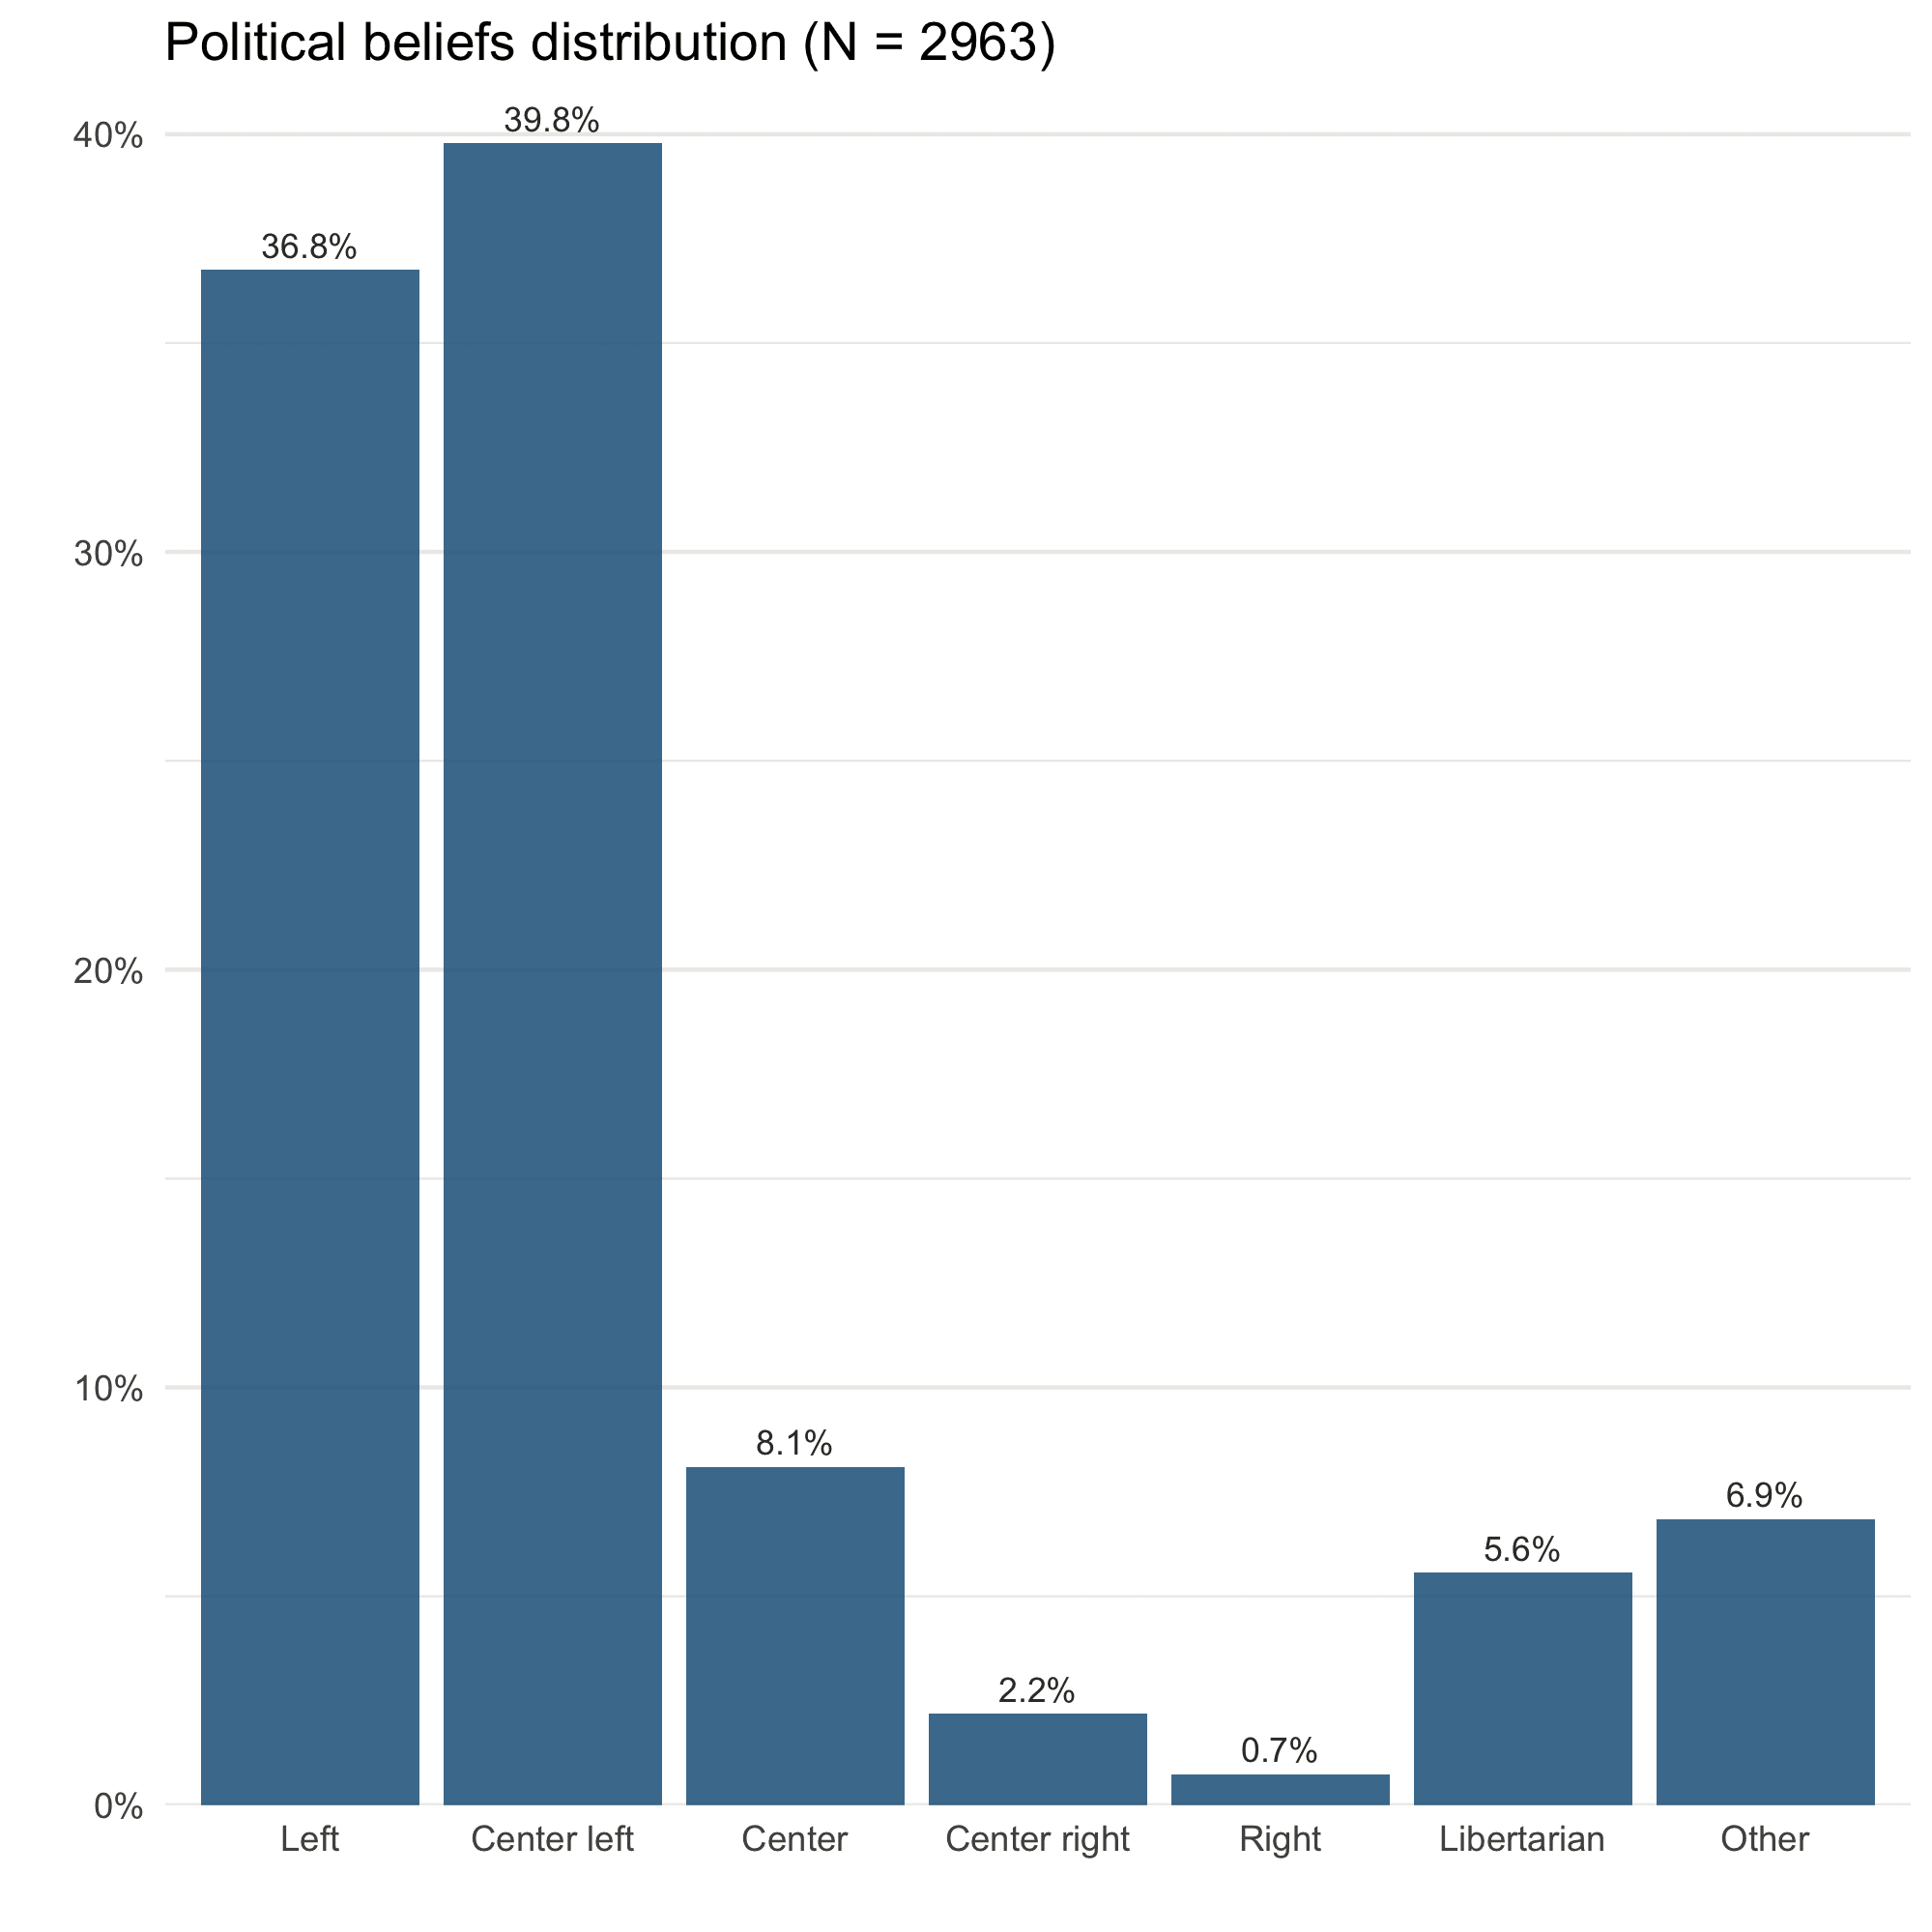
The political composition of the EA movement has changed little since 2019, though is slightly more left-leaning.
Politics by year
Religion
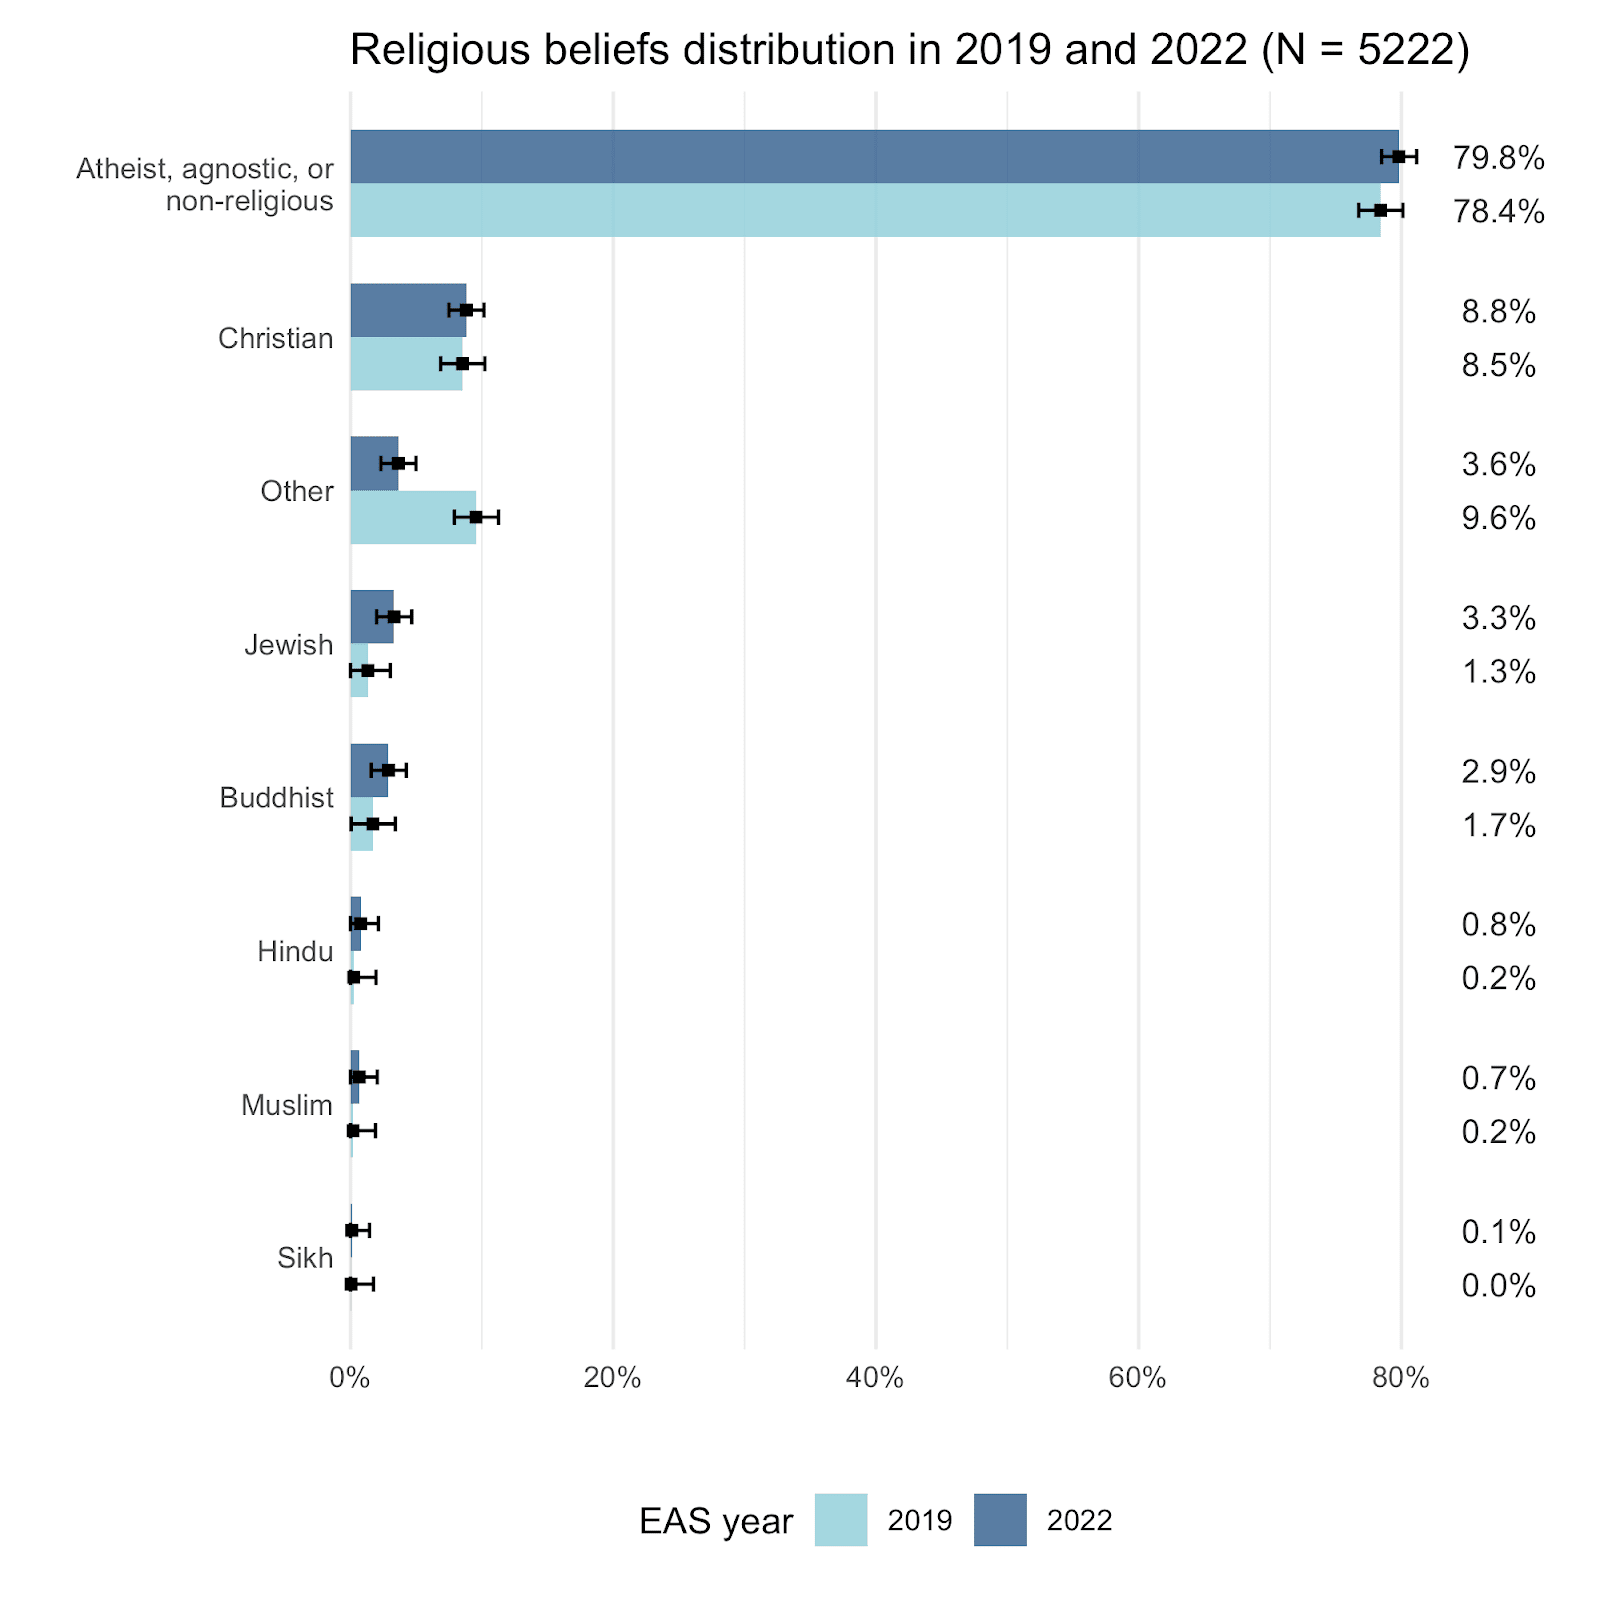
Our sample remains highly atheist, agnostic or non-religious and this has not changed significantly since 2019.
Religion by year
Edits
We changed a number of plots (as described in the comments) for greater clarity and consistency and updated the plots for race/ethnicity to correct an unrelated error.
Acknowledgments

This post was written by Willem Sleegers and David Moss. We would also like to thank Rachel Norman and Peter Wildeford for comments.
- ^
The gender question was based on self-selection from categories listed in the plot below, with an option to self-describe. As Slade et al (2020) note, there are advantages and disadvantages to employing fixed categories for respondents to select from and to exclusively providing an open comment box to allow respondents to write in their own identification. The latter approach provides maximum freedom for respondents to provide the answer they see fit. However, providing an open comment box also means that analysis of these responses will be determined by the researchers’ own categorization of these responses into fixed categories which the respondents will be unable to access. Providing fixed categories upfront, in contrast, has the advantage of transparency, with respondents knowing how their answers will be categorized. Here, we opted to allow a ‘self-describe’ option, but do not attempt to reclassify these responses into other categories (as in previous years, this category accounts for a very small number of responses, and many of the responses would be very hard to re-classify).
As there are very few responses in either the ‘Non-binary’ or ‘Prefer to self-describe’ categories, when analyzing group differences, we simply analyzed differences between respondents who selected ‘Man’ and those who selected anything other than ‘Man’, as the low number of respondents in the other categories would preclude meaningful analysis. Although this approach means that we cannot assess differences between those who selected ‘Woman’, ‘Non-binary’ or a self-description, this seems like a practically useful categorisation, given that the EA community is predominantly male and given that prior community-building efforts have focused on both women and non-binary people under-represented groups. We opted to include those who selected ‘Prefer to self-describe’ in the ‘selected something other than “Man”’ category in order to avoid simply excluding these respondents. It’s important to note that inclusion in the “Selected something other than “Man”” category does not necessarily mean that the respondent would not identify as a “Man” if they selected “Prefer to self-describe”. - ^
Suppose 50 men and 50 women join EA in 2018, 2019 and 2020. If 10 women and 5 men drop out each year, then when we survey the community in 2020, then we would observe relatively fewer women in 2018 and 2019 than in 2020.
- ^
Surveying race and ethnicity in a cross-cultural international context is fraught due to a number of theoretical complications (Roth, 2017). Not only do the specific categories utilized vary internationally, but whether these are understood as about race, ethnicity, nationality or some other superordinate category can itself vary (Morning, 2015). In this case, similar to the gender question, respondents were able to select multiple different categories out of a fixed list or to self-describe. The categories in this survey are designed to match those used by CEA in their surveys (which are based on the US/UK censuses). As with the gender analyses, for those analyses which look at differences between groups, due to the low number of non-white respondents, we combine these into a single category.
- ^
The one obvious exception is that there is a lower percentage of white respondents in EAS 2017 across most cohorts, compared to all later years. This pattern is compatible with differential attrition of non-white respondents between 2017 and 2018, and for no later years. That said, we think it is more likely explained by EAS 2017 being a strange outlier year. We’ve found EAS 2017 data to behave strangely compared to other survey years in a variety of cases e.g. here (note: this author was not involved in running EAS 2017. And it seems relatively unlikely that there would be a large difference in attrition between 2017 and 2018 and not for any year between 2018 and 2022.
- ^
We categorized as “high” engagement those who were 4-5/5 on this scale and “low” engagement, anyone who selected 1-3/5 on that scale.
David & Willem - thanks very much for compiling this useful data.
The most striking result to me is EA's very strong political skew towards the left, and away from the right:
If this was a demographic pattern (e.g. with respect to race, sex, class, etc), such a strong skew would be taken by many as prima facie evidence of active discrimination against people in the minority categories, and as something that urgently needs to be fixed. (For example, EA seems to devote a fair amount of attention to trying to equalize the male/female sex distribution, and to recruit non-white races).
When it comes to political views though, many EAs seem reluctant to accept the analogous inference, that EA discriminates against conservatives (or at least under-recruits and under-retains conservatives).
I've heard various EA rationales for why that inference isn't valid, such as (1) liberals are naturally more altruistic, so are more interested in Effective Altruism, (2) liberals are naturally more intelligent, rational, and open-minded, so are more interested in Rationalism, reason, and evidence applied to altruism, (3) liberals tend to be more atheist/agnostic, so are more interested in secular charities and policies, whereas religious conservatives are more focused on church charities, (4) liberals have a wider 'moral circle' than conservatives, who tend to focus more on family, tribe, and nation, (5) liberals tend to be more utilitarian, whereas conservatives are more virtue-ethical or deontological, etc.
There are some grains in truth in all these points. But, as someone in the center-right-libertarian category, I can imagine an alternative time-line in which EA was developed mostly by socially conservative libertarians who got fed up with lefty virtue-signaling and with well-intentioned but ineffective government policies. In such a time-line, we could have ended up with a strong conservative skew in EA political orientation, rather than liberal skew we currently see.
In both cases, I think the political skew should be considered a big problem -- maybe at least as big as an unbalanced sex ratio, an overly-white racial profile, or an overly-atheist attitude towards religion.
I'm curious what you all think about EA's extreme left-leaning political skew, and whether it represents a problem that needs some attention.
Thanks for the comment!
The question of what causes the disparity seems somewhat empirically tractable. For example, one could assess whether conservatives (in the broader population) are lower in EA-related attitudes (the challenge, of course, would be in developing valid measures which aren't implicitly coded as either liberal or conservative).
We could also test different framings of EA and examine how support for EA from conservatives/liberals varies in response to these different frames. It seems very plausible that interest in EA (from different groups) might vary dramatically across different frames. I think this research should be done for different demographic groups (e.g. gender, race, age), but it would also be tractable and relevant to examine the influence of political ideology. It's possible that different framings would be dramatically more successful in reaching different groups.
It would also be interesting to examine the effect of presenting people with a view of EA which highlights its diversity (or lack thereof) on relevant dimensions and see how far this changes interest in learning more or getting involved. For example, one could present a description of EA, (such as, an account of an EAG which includes vignettes about various EAs who are all prominently liberal or which includes a mix of conservatives) and see how far this changes levels of interest in EA.
Another alternative explanation (to conservatives being turned off by some factor), could be differences in exposure to EA. Our survey on how many people have heard of EA suggests that about twice as many Democrats as Republicans have encountered EA (for sex, the gap is around 3:2, which would imply 60% men, 40% women).
Presumably the question of whether a disparity is a problem that requires attention depends, at least in part, on the causal question, although, of course, one might be concerned about epistemic and other effects regardless.
David -- excellent suggestions. I agree that these are empirically tractable questions, and you outlined some good strategies for exploring them. I'm happy to collaborate with anyone who wants to push ahead with these ideas.
It's an artifact. What's really being measured here is EA's skew towards educated urban professionals, for whom identifying as "left" or "center left" is a signal of group membership. The actual dominant ideology is, broadly speaking, technocratic liberalism: the same cluster as "center-right" Rockefeller Republicans, "centrist" New Democrats, or "center-left" LibDems, but qualitatively different from the "center-right" CDU or "center-left" New Dealers.
Getting Christian conservatives to allocate their donations more effectively would be an extremely good thing but it will never ever happen under the aegis of EA. You would need a totally separate cultural infrastructure, built for (and probably by) communitarians instead of liberal universalists.
I have an intuition this is right, but why are those people picking "left" over "centre-left" then?
Edit: I mean not all of them are picking "left" obviously, but a considerable minority are.
At some point, the statistics can almost become self-fulfilling. Many (if not most) people prefer to be in spaces where a decent fraction of the people are like them, where they feel like people like them belong. If there are few people like them, they may get the impression that this isn't a space for them. "People like them" could refer to race, religion, politics, socioeconomic status, or any number of identity characteristics. Thus, at some point, I would expect to see lopsided statistics in categories like race, religion, politics, or SES mostly continue even if there was zero discrimination and the original causes for those lopsided statistics were no longer relevant. In other words, I wouldn't expect the statistics to change that much in those categories without taking special steps to improve representation.
For instance, I don't think the width of one's moral circle would significantly predict interest in AI safety since AI doom will just as equally harm one's "family, tribe, and nation." And it's plausible that conservatives (especially religious conservatives) would be overall more skeptical of AI, and big tech companies, than average.
A few other points:
I'd be cautious drawing conclusions based on one single question about a complex topic. I think different framings would paint a more nuanced picture.
For example "left" has different meanings in different countries. I often hear US Democrats described as left. As a Dutch person where we often have 10+ political parties to choose from, that's crazy. The current Republican Party is a far-right party. Democrats cover the whole rest of the spectrum.
I still think EA would be left-leaning though. But an EA-inspired political party would look very different from left-wing parties.
Also, in the spirit of inclusion: using "liberals" to describe leftists is very US-centric language
I do think EA's wide moral circle is key to why it doesn‘t attract conservatives (how many liberals / socialists / libertarians vs conservatives would choose to give to a more cost-effective charity abroad to people of a different ethnicity, instead of prioritising their local community?)
I would guess that libertarians are overrepresented in EA relative to how popular libertarianism is, but conservatives are very underrepresented.
I think it's important for EA to make more active efforts to engage with conservatives given that crudely, conservatives are in government about 50% of the time, and conservative governments can definitely be convinced to adopt specific policies which benefit foreigners, future generations and animals, especially since conservatives often form alliances with libertarians.
CEA reached out to me once about this to solicit suggestions, but I think in practice it is quite hard for a left wing organization to actually take any concrete steps to stop prioritizing left wing people, and never heard any follow-up.
Larks - yes, it is hard for any organization that has a strong political leaning to develop more self-awareness about that leaning, to understand why it might be create some problems in cause area assessment and movement-building, and to develop a realistic strategy for outreach and reform that tries to balance out its partisanship.
I guess one strategy might be to frame this as a matter of understanding barriers to achieving more widespread adoption of EA values and priorities. The kinds of objections and concerns that conservatives might have about animal welfare, global public health, global poverty, and X risks might be quite different from the objections and concerns that liberals might typically have.
For example, in terms of geopolitics, conservatives might often have a more positive-sum view of economic growth, but a more zero-sum view of nation-state rivalries (and a more negative view of 'global coordination' through institutions such as the United Nations). This might lead to a view of global poverty issues that prioritize promoting the rule of law, efficient markets, and entrepreneurship in poor countries, rather than reallocation of existing resources (eg direct cash transfers). It might also lead to more concern about arms races between nation-states with regard to X risks (e.g. AI, nuclear weapons), and to a profound skepticism about the effectiveness of government regulation or global coordination.
Thus, if conservatives hear EAs making arguments about these issues, without understanding the conservative mind-set at all, they might be turned off from EA as talent, as donors, and as advocates -- when they might have actually contributed significantly.
And sometimes the re-branding could even be fairly thin. For instance, World Vision is a major NGO popular among American evangelical Christians; presumably their marketing pitches have been tested against their donor base which has significant conservative elements. IIRC, one of the classic pitches in their holiday gift catalog: your donation will purchase these chickens for a poor family, which will not only produce eggs for consumption but allow them to sell some of the eggs in the marketplace to generate income. In a certain light, that sounds like an indirect cash transfer program that is more legible to some conservatives because it partially bypasses their concern that one-time redistribution programs improve short-term welfare only. Receptiveness to this kind of value proposition might signal openness to indirect cash transfer programs with a better EV, like deworming.
Jason -- great example. A lot of it's in the framing!
World Vision being a Christian charity I think dominates these other effects unfortunately.
Definitely not recommending World Vision itself. But if you could get more American evangelical Christians to support bednet distribution by creating a new AMF-esque organization with (e.g.) Bible verses featured in its promotional materials and sewn in tags on its bednets, then I would probably be in favor of that. The Bible verses would not make the bednets less effective.
A reason why the political orientation gap might be less worrying than it appears at first sight is that it probably stems partly from the overwhelmingly young bent of EA. Young people from many countries (and perhaps especially in the countries where EA has greater presence) tend to be more left leaning than the general population.
This might be another reason to try onboarding older people to EA more relative to the pool of new members, but if you thought that would involve significant costs (e.g. having less young talented EAs because less community building resources were directed towards that demographic), then perhaps in equilibrium we should have a somewhat skewed distribution of political orientations.
I agree this may stem partly from EA's very strong age skew, but I don't think this can explain a very large part of the difference.
Within the US, Gen Z are 17% Republican, 31% Democrat (52% Independent), while Millenials are 21% Republican - 27% Democrat (52% Independent). This is, even among the younger group, only a ~2:1 skew, whereas US EAs are 77% left-leaning and 2.1% right-leaning (a ~37:1 skew). Granted, the young Independents may also be mostly left-leaning, which would increase the disparity in the general population. Of course, this is looking at party affiliation rather than left-right politics, but I think it plausible (based, in part, on LW/SSC/ACX data) that even right-leaning EAs are non-Republican voting, so the results may be more skewed than this.
Looking at ideology, US 18-29 year olds are around 23% Conservative, 34% Liberal (41% Moderate), which is also significantly more balanced.
Of course, there is also the education gap (with EAs being disproportionately highly educated), but among college graduates we still see only 31% conservative, 20% liberal, and 27% conservative vs 36% liberal for postgraduates.
One could also argue that elite colleges specifically are even more left-leaning. But, as we note, although the EA community is skewed towards elite colleges, a very large percentage of respondents are not from particularly highly ranked colleges (though this is likely less so looking purely within the US), so it does not seem like this could also explain a large part of the difference.
It's also worth bearing in mind that in some of these cases the explanation of the difference may flow in the reverse direction: e.g. it could be that features of the EA community make it more appealing to political liberals which cause it to attract more young people, rather than vice versa.
Thanks for putting numbers to my argument! I was expecting a greater proportion of left-leaning individuals among the college educated, so this was a useful update.
Alejandro - I think you're right that the leftward skew is partly explained by the youth-skew in the EA age distribution, plus the commonly observed correlation between age and conservatism. I also agree that more active recruitment of older people could help balance this out somewhat. (I've critiqued EA's implicit ageism a number of times in EA Forum comments).
What do you mean by 'CB resources' though? Not familiar with the term.
Oh, sorry. I'll expand the abbreviation in the original comment. It's 'Community Building resources'.
OK! Thanks for the explanation.
are you sure this isn’t just a function of the definition of highly engaged?
No, I think it it probably is partly explained by that.
For context for other readers: the highest level of engagement on the engagement scale is defined as "I am heavily involved in the effective altruism community, perhaps helping to lead an EA group or working at an EA-aligned organization. I make heavy use of the principles of effective altruism when I make decisions about my career or charitable donations." The next highest category of engagement ("I’ve engaged extensively with effective altruism content (e.g. attending an EA Global conference, applying for career coaching, or organizing an EA meetup). I often consider the principles of effective altruism when I make decisions about my career or charitable donations.") is also included in the "high engagement" group, when we apply a binary division between high and low engagement).
The definition of the highest level of engagement may skew against people who are earning to give, even if they are highly engaged (in the ordinary sense of the term), and donating a lot, because it includes the specific example of "perhaps helping to lead an EA group or working at an EA-aligned organization" (even though a high-donating earn-to-giver could judge that they counted as highly engaged anyway, they might think that the category doesn't best fit them).
That said, I would expect most engaged, high-donating earning-to-givers to fit at least the second highest category, which would still count them as "highly engaged" in our binary analyses. Note that the next category down (the highest category in the "low engagement" binary division) is quite a lot weaker "I’ve engaged with multiple articles, videos, podcasts, discussions, or events on effective altruism (e.g. subscribing to the 80,000 Hours podcast or attending regular events at a local group). I sometimes consider the principles of effective altruism when I make decisions about my career or charitable donations."
Given that, I don't expect these definitions to dramatically skew results related to earning-to-give, so long as we're using the binary division, but the use of these specific examples is probably a part of the issue.
The engagement scale (which we didn't design ourselves, it was a requested question from 2019 onwards) definitely has some undesirable features. It's double or triple-barrelled (i.e. it asks people about multiple distinct dimensions in parallel (e.g. how far and/or how often you consider EA principles and about different actions you could take)). And the characterisations of the different levels of the different dimensions are not clearly hierarchical and seem to jump between different dimensions (e.g. levels 2-4 specify engagement with different content, level 5 refers to engagement in groups or EA orgs). The ideal way to design the measures would be to have each measure specifying a distinct dimension (e.g. self-identified engagement, degree or frequency of considering EA principles, and engagement in different activities) and have each of these dimensions unambigiously hierarchical, and then see how these different dimensions are associated.
That said, I think the scale mostly works passably well for most purposes. When we examine the association between the self-report scale and different concrete measures and between different concrete measures themselves (2019, 2020), we find a fairly high level of consilience between different measures. So people who are less/more engaged on the scale are also less/more likely to engage in a suite of different activities. Granted, this is still a certain kind of EA engagement (namely engagement with EA content and activities), and so won't capture some cases of people who are very dedicated and do high value work (e.g. perhaps a high powered policy maker or donor); but most cases where people have "engaged extensively" with EA content, should still be captured as high engagement, regardless of their current activities.
Should redefine engagement in terms of total $ donated to charity in the last year and see how the stats look.
Thanks. I agree this is interesting to look at.
Since we didn't gather donation data this year, in order to keep the survey shorter, we have to go back to data from earlier survey years.
In EAS 2020, we asked about current career (rather than career strategy). This is obviously appreciably different (and more vulnerable to just reflecting the fact that people in different current careers can afford to donate different amounts, rather than reflecting the different groups), but here are the results:
Here we can see that high donors are much more likely to be in for-profit (earning to give), though there is also a non-significant trend in the direction of higher donors being more likely to be in for-profit (not earning to give). A higher percentage of high donors also selected work at an EA non-profit (though the difference was small and not significant). Higher donors were less likely to select "still deciding what to pursue" and "building flexible career capital and will decide later" (compared to the lowest donors), but I imagine that this likely reflect these categories being more often selected by early career/student low-earning, low-donors.
In 2019, we asked a question which may be a more informative comparison to 2022, "If you had to guess, which broad career path(s) are you planning to follow?" (this may be somewhat less vulnerable to simply reflecting the fact that people currently in earning to give can currently donate more, but probably still reflects this to a significant degree).
Here the highest donors are more likely to select earning to give, and they are also less likely to select academia (than the lowest donors).
As with the original graphs, these differences are likely at least partly explained by other confounding variables (e.g. how long people have been in their career etc.). If we wanted to assess what is ultimately causing the differences, we'd need to examine a more complex model.
That said, while I think this is interesting, looking at total donations as an operationalization of engagement seems less informative, since although the existing measures may be slightly skewed against E2G people counting (themselves) as highly engaged (due to giving EA orgs and community buildings as exemplars of the highest level of engagement), total donations seems very skewed towards counting E2G people as highly engaged simply in virtue of them earning more than people in other roles (or people who are students/early career).
My guess is that either a more neutral measure of engagement (e.g. simple self-report of low to high engagement) or some more complex ideal measure of engagement would probably find that (rightly or wrongly) higher engagement is associated with higher interest in research / EA org research over earning to give. It's possible that there'd be a different association with a good measure of EA dedication, which may be different from engagement (but that seems harder and more controversial to measure).
Wow, very detailed analysis, thank you!
Thanks, very interesting.
Regarding the political views, there are two graphs, showing different numbers. Does the first include people who didn't respond to the political views question, whereas the second exclude them? If so, it might be good to clarify that. You might also clarify that the first graph/sets of numbers don't sum to 100%. Alternatively, you could just present the data that excludes non-responses, since that's in my view the more interesting data.
On religion too, I think.
Thanks Stefan and Jason!
Hi Stefan,
Thanks for the comment! I'm inclined to agree it's clearer and easier to just show the 'excluding' numbers in both cases, so this is changed now. We'll update this to be the same anywhere else in the post it applies too.
Wait, I don't understand. Are 63.6% or 76.6% of respondents left-leaning? And 69.58% or 79.81% non-religious?
79.81% of respondents who answered the religion question are atheist, agnostic or non-religious, but 69.58% of all respondents (including those who did not answer the question) are atheist, agnostic or non-religious.
Fortunately, there is no sign of differential non-response across these questions (i.e. similar numbers of respondents answered these questions, as answered other questions a similar length through the survey) or high non-response in general, so one can straightforwardly interpret the former sets of numbers. But, counterfactually, if there were high non-response or high differential non-response, then one might be interested in the proportion selecting from all respondents (and then need to make further inferences about the missing responses).
Got it, thanks.
I'm happy to see that the increased community focus on gender diversity seems to be paying off, that's a healthy increase!
There's still quite a way to go to gender equality though. If you want to forecast on where it will go, I have a market: https://manifold.markets/LudwigBald/in-2025-what-percentage-of-eas-are It currently predicts 36% non-male survey respondents by 2025
But the graph says 79.81%?
This has already been updated per this thread. Originally, some of the graphs showed the percentage of all respondents selecting each category, but in response to comments we switched to just showing the percentage of respondents who answered each question for all graphs, for simplicity.
Sorry - I was reading on a plane to EAG London and didn't refresh before sending.
X-axis of the university rank distribution histogram is distorted. Some bars represent 25x as many universities as other bars. Ideally it'd look like a smoothed version of the previous graph
That's true, but by design. With that particular plot, we wanted to show clear percentages for discrete categories of interest. Categories containing even numbers of universities risk (e.g. 1-100, 101-200) being uninformative for practical purposes, by combining universities with very different characteristics, while dividing others). Of course, your mileage may vary as to which categories are practically interesting.
The previous graph (below) already shows the raw distribution, but you can also look at the cumulative percentages in the next plot below (note: this cannot show the unranked universities, which, as the former plot shows, account for a decent proportion of respondents).