My partner Hannah currently has a grant where she's working on quantifying the uncertainty of other GiveWell charities using techniques similar to mine, starting with New Incentives. Hopefully, we'll have fruit to show for other GiveWell charities! There is a lot of interest in this type of work.
I'd love to chat with you (or anyone else interested in Uncertainty Quantification) about current methods and how we can improve them. You can book me on calendly. I'd still learning a lot about how to do this sort of thing properly, and am mainly learning by trying, so I would love to have a chat about ways to improve.
And to add to this, very recently there was a post Quantifying the Uncertainty in AMF! Which still seems a bit in the works but I'm super excited for it.
This is my favorite criticism contest entry. The amount of actionable information is really great. I would love to see various organizations move to incorporate these methods, where applicable. Very nice use of visuals as well.
I know you said in a previous post that you are not involved in EA. I hope you'll consider staying involved after this criticism contest. It seems you have a lot of value you could add.
Hi Froolow, thanks for taking the time to write up this piece. I found your explanations clear and concise, and the worked examples really helped to demonstrate your point. I really appreciate the level of assumed knowledge and abstraction - nothing too deep assumed. I wish there were more posts like this on the forum!
Here are some questions this made me think about:
Do you have any recommended further reading? Two examples of things I'd like to hear about:
1)a) Really well done applications of uncertainty analysis which changed long standing decisions
1)b) Theoretical work, or textbook demonstrations for giving foundational understanding
1)c) The most speculative work you know of working with uncertainty analysis
I think (1c) would be particularly useful for porting this analysis to longtermist pursuits. There is little evidence in these field, and little ability to get evidence. So I would want to consider similar case studies, but perhaps this is on a larger scale than common-use health economics.
Are there some levels above PSA of uncertainty of model formation of parameter covariance?
Many level seem to potentially suffer from any underlying structural flaws in the model. PSA seems to question this via Monte Carlo. But, if for example there were covarying parameters, are there methods for assigning model or 'hyperparameter'[^hyp] uncertainty?
Somewhat relatedly:
I'm concerned that in thresholding a single parameter what's actually happening that a separate more pivotal parameters effects are over weighting this parameter. This would be more of a problem in scenario analysis since nothing else is varying. But Under PSA, perhaps this could arise through non-representative sampling distributions?
I think something funky might be happening under this form of risk adjustment. Variance of outcome has been adjusted by pulling out the tails, but I don't think this mimics the decision making of a risk-adverse individual. Instead I think you would want to form the expected return, and compare this to a the expected return from a risk adverse motivation function.
Meta: I hope it doesn't come across as suggesting this should reduce use of uncertainty analysis in any of these questions! I'm just wondering about how this is dealt with in normal health economics practice :)
[^hyp] : I don't think hyperparameter is the correct term here, but some sort of adjustment of sampling distribution.
Thank you for the kind words - and it is always nice to get follow-up questions!
Further reading
In terms of recommended further reading, almost all UK-based Health Economists swear by 'the Briggs book'. This contains step-by-step instructions for doing almost everything I describe above, as well as more detail around motivation and assumptions.
If you don't want to shell out for a textbook, an excellent exploration of uncertainty is Claxton et al 2015 where the authors demonstrated that the value of additional information on the uncertainty of streptokinase following heart attack was so small as to be negligible, which implies that a major shift in health policy could have been undertaken five years earlier and in the absence of several massive expensive trials. Claxton is one of the co-authors of the Briggs book, so knows his stuff inside out.
In terms of EA specific follow-ups, I have always really loved Kwakkel & Pruyt 2013 for their use of uncertainty analysis in a framework that EAs would recognise as longtermist. Their first example is on mineral scarcity in the medium-term future, and they go through a process very similar to that which is done for x-risk type calculations, but with what I regard as a significantly higher degree of rigour and transparency. If someone asked me to model out AI alignment scenarios I would follow this paper almost to the letter, although I would warn anyone casually clicking through that this is pretty hardcore stuff that you can't just knock together in Excel (see their Fig 1, for example).
I note you also ask for the most speculative use of uncertainty analysis, for which I have a rather interesting answer. I remember once reading a paper on the use of Monte Carlo modelling of parameter uncertainty to resolve the Fermi Paradox (that is, why has no alien intelligence contacted us if the universe is so vast). The paper really entertained me, but I completely forgot the reference until I tracked the paper down to link it for you now - it is Sandberg, Drexler & Ord 2018, and the 'Ord' in the third author position is Toby Ord, who I suspect is better known to forum members as one of the founders of EA - what a lovely coincidence!
Model covariance
You are right to raise covariance in Monte Carlo simulations as a clear issue with the way I have presented the topic, but you'll be pleased to know that this is basically a solved problem in Health Economics which I just skimmed over in the interests of time. The 'textbook' method of solving the problem is to use a 'Cholesky Decomposition' on the covariance matrix and sample from that. In recent years I've also started experimenting with microsimulating the underlying process which generates the correlated results, with some mixed success (but it is cool when it works!).
Risk adjustment
Your comments on risk adjustment are completely correct - amongst many of the problems my approach causes it takes unlikely outcomes (ie high standard deviation away from average) and implicitly turns them into outcomes which are proportionally even more unlikely, sometimes to the point of requiring completely impossible inputs to generate those outputs. I hope I caveated the weakness of the method appropriately, because it isn't a good model of how humans approach risk (more of a proof of concept)
There is a fairly novel method just breaking into the Health Economics literature called a CERAC, which uses the process you outline of treating a model as a portfolio with an expected return and downside risk of those returns being penalised accordingly. I suspect something like this is the best way to handle risk adjustment in a model without an explicit model of risk-preference specified across all possible outcomes. Unfortunately to use the technique as described you need a cost-effectiveness threshold, which doesn't exist in EA (and will never exist in EA as a matter of first-principles). As I mentioned, I work in an exclusively expected utility context so I'm not familiar enough with the technique to be confident of adapting it to EA, although if someone with a better maths background than me wanted to give it a shot I suspect that would be a pretty valuable extension of the general principle I outline.
RE 2: could you please clarify your question? Perhaps provide an example of what you'd like to do? There's nothing about Monte Carlo methods that stop you correlating parameters (although you do need to quantify the correlations); although it's normally easier and more interpretable to instead form your model on the basis of uncorrelated input parameters then use functions of these parameters to induce correlation in the output.
Thank you for this post Froolow, I think you have highlighted a big area of improvement for many EA analyses here. I think it's worth highlighting Guesstimate which lets you do a pretty good probabilistic sensitivity analysis in your web browser with a UI that's about as easy-to-use as a spreadsheet. This is a really good first step into this sort of analysis IMO.
Methods for improving uncertainty analysis in EA cost-effectiveness models
This is an entry into the ‘Effective Altruism Red Teaming Contest’ - it considers how to import a Health Economic toolkit for uncertainty analysis into the EA space. Uncertainty analysis is a major omission from most published EA models and seems to me like the proverbial ‘hundred dollar bill on the sidewalk’ – many of the core EA debates can be informed (and perhaps even resolved) by high-quality uncertainty analysis and I believe this could greatly improve the state of the art in EA funding decisions.
The goal of this essay is to change the EA community’s view about the minimal acceptable standard for uncertainty analysis in charity evaluation. To the extent that I use the GiveWell model as a platform to discuss broader issues of uncertainty analysis, a secondary goal of the essay is to suggest specific, actionable insights for GiveWell (and other EA cost-effectiveness modellers) as to how to use uncertainty analysis to improve their cost-effectiveness model.
This contributes to a larger strategic ambition I think EA should have, which is improving modelling capacity to the point where economic models can be used as reliable guides to action. Economic models are the most transparent and flexible framework we have invented for difficult decisions taken under resource constraint (and uncertainty), and in utilitarian frameworks a cost-effectiveness model is an argument in its own right (and debatably the only kind of argument that has real meaning in this framework). Despite this, EA appears much more bearish on the use of economic models than sister disciplines such as Health Economics. My conclusion in this piece is that there scope for a paradigm shift in EA modelling before which will improve decision-making around contentious issues.
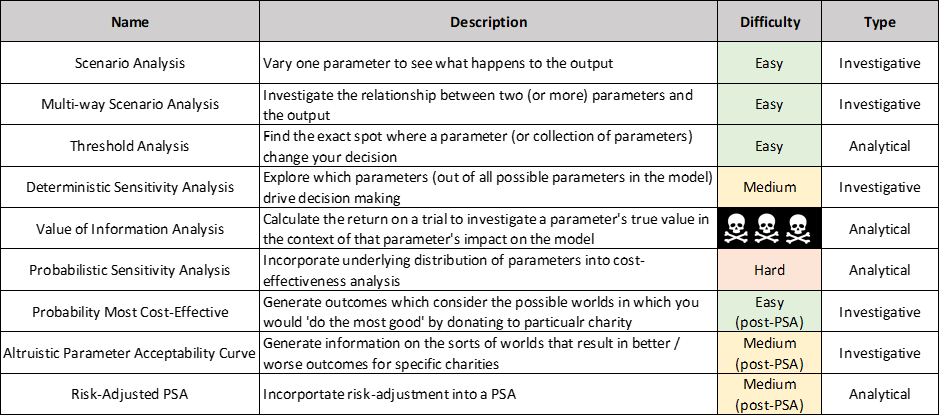
This essay considers the following tools as part of an 'analysis of uncertainty' toolkit. All are fairly common in the Health Economics literature (although some are slightly adapted for EA in the essay). Each technique is categorised by how straightforward they are for a layperson to contribute to in my opinion, and then by whether the technique is analytic (it drives decision-making by itself) or investigative (it offers deeper insight at the cost of needing interpretation), again in my opinion. Of course, there is considerable room for disagreement with both sets of ranking here!
1.2 Context
This essay is an attempt to ‘red team’ uncertainty analysis in EA cost-effectiveness modelling. I had initially intended to look only at the functionality of the GiveWell 2022 cost-effectiveness model, however it was clear that the biggest issue with the model was uncertainty analysis rather than any specific modelling errors. As part of this deep-dive into the model functionality, I created my own refactored version of the model (which is available here). One of the key differences between the GiveWell model and my refactored model is that my refactored model is extremely well set up for streamlined uncertainty analysis, so it is somewhat straightforward to take the next logical step and try to plug the uncertainty-gap I identified. You should be aware that I am a cost-effectiveness modeller for a large pharmaceutical company, and so will be using techniques from Health Economics and applying as much as I can to EA.
I find it slightly ironic to be writing about uncertainty to an EA audience; if there is one virtue of the EA community which shines out from even a cursory engagement with the forums it is a willingness to consider it might not know everything. However, unfortunately the way that EA typically goes about thinking about uncertainty is not a good match for the sorts of systematic analytical techniques which can generate important insights on underlying uncertainty, and which are described in this essay. What I mean by this is that it is often unsystematic in both approach and output - important uncertainties are often not identified as such (while irrelevant inputs are polished to gleaming), and the conclusion of many investigations into uncertain parameters is, "This is the best we can do" rather than aiming for mathematical quantification of how much uncertainty remains. I'm therefore hopeful that this essay will be of interest, since EA is clearly willing to engage with uncertainty but perhaps lacking tools to formalise that interaction.
I should add that as far as ‘red teaming’ goes what follows is not novel insight. Nowadays you would get similar analysis in a 101-level Health Economics textbook, and indeed I have found one comment on the forums basically saying exactly what I am about to say below (apologies I can’t work out how to link to a comment, but it is by user Derek on this post to give credit where it is due). Nevertheless, I think this essay will add value by fleshing out the links between the techniques as they are described in textbook Health Economics problems and actually applying those techniques to real-world EA examples.
1.3 Uncertainty
Uncertainty is defined as the variability of a model’s output that is due to variability in a model’s input. It is generally regarded as a bad thing because if you are uncertain about the output of your model then it is possible that you might make the wrong decision.
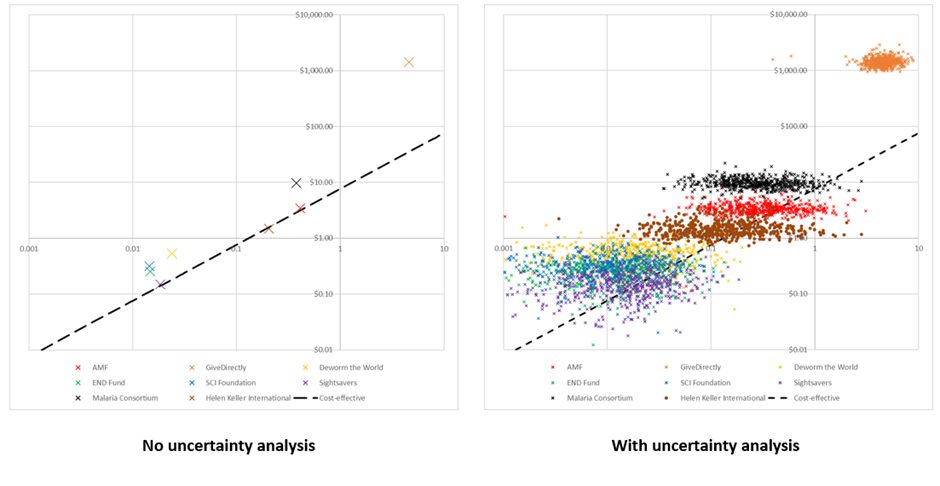
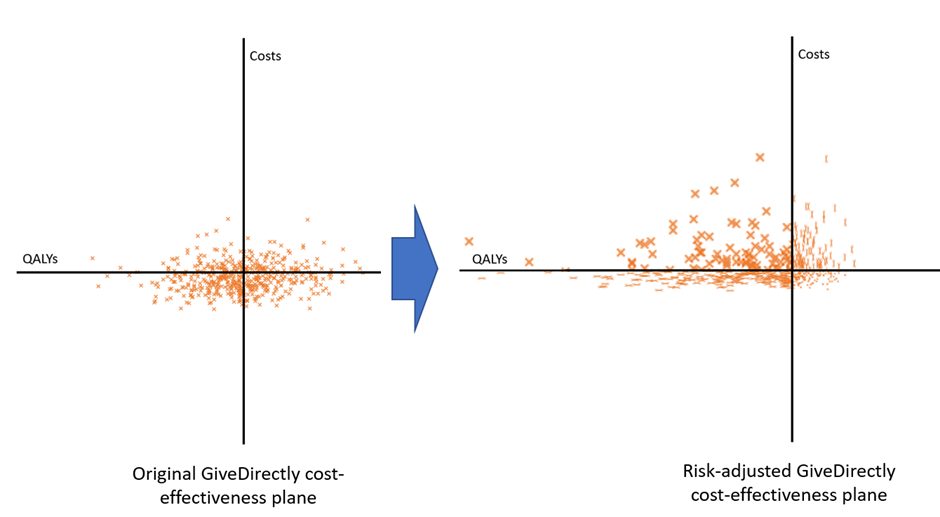
The graph below shows the costs and benefits of each GiveWell top charity on a log scale (except New Incentives, which I ran out of time to add). The dotted black line shows the cost-effectiveness of the most cost-effective charity; anything above this line is less effective than this charity and anything below this line is more effective than this charity. On the left is effectively GiveWell’s published conclusions – the base case analysis of my refactoring of their model. You can see it recommends Sightsavers, HKI and AMF as the most cost-effective charities, with very little to pick between them. On the right is the same graph with full uncertainty analysis added (see Section 4 for details on the ‘PSA’ technique). This shows that any charity except GiveDirectly could potentially be the most cost-effective, with varying degrees of plausibility (and GiveDirectly could easily be most cost-effective if we add in some risk adjustment, as we do in Section 4).
This is important because it shows that without uncertainty analysis, we are at a material risk of picking the wrong charities to fund.
The reason the making the wrong decision should be an important concern for EA organisations is that being wrong about the best use of money is inconsistent with a commitment to do the most good possible with this money. As the amount of money moved by EA organisations increases, the harm of being wrong also increases (because of the opportunity cost of what could have been done with that money increasing). There are a few of other reasons EA organisations might want to pay more attention to uncertainty:
Analysis of uncertainty can quantify the risk of making the wrong decision, and the costs and consequences of that wrong decision if it occurs
Analysis of uncertainty can help triage this risk, and prioritise resources towards uncertainty which is both important and easy to resolve
Analysis of uncertainty can help with the decision to ‘pull the trigger’ on a donation versus waiting to gather more information about it
Analysis of uncertainty can make disagreements more explicit and productive, particularly by drawing clear lines between moral and factual disagreements.
Uncertainty can arise for many reasons; it might be that we are uncertain about what number should be entered into the model (‘parametric uncertainty’) or it might be that we are uncertain about how a parameter should behave with respect to other parameters (‘structural uncertainty’). There are isolated examples of good practice in both types of variable; GiveWell is very strong on considering parametric uncertainty in their write-ups of why they pick the numbers they do, and there is a great example of structural uncertainty analysis in another entry for the contest. However there does not seem to be a nuts-and-bolts level understanding of how analysis of uncertainty can be used to prevent bad decision-making (rather than simply making the model more accurate).
More generally, analysis of uncertainty is important because existing EA cost-effectiveness models don’t seem to have a good understanding of how to use it effectively, so there is a lot of low-hanging fruit here to improve decision-making.
1.4 Summary of broader EA recommendations
If I had to summarise my entire argument in a single sentence it would be that there is a general underappreciation of the value of uncertainty analysis in economic modelling across (almost) the entire EA community. Key conclusions in this essay which might result in actionable insight as the result of uncertainty analysis include:
There is probably no single ‘most cost-effective use of philanthropic resources’. Instead, many people might have many different conceptions of the good which leads them to different conclusions even in a state of perfect knowledge about the effectiveness of interventions [1]. From reading the forums where these topics come up I don't think this is totally internalised - if it was totally internalised people would spend time discussing what would have to be true about morality to make their preferred EA cause the most cost-effective, rather than arguing that it is the actual best possible use of resources for all people [2].
Related to this, the EA community could work on creating tools to elicit these uncertainties / disagreements more cleanly to improve the quality of discussion on the forums and elsewhere. This GitHub repo contains a number of tools which make a start on this, and forum user Tanae alerted me to a tool called Squiggle which looks to be a programming language that does the same thing. This essay doesn’t focus on tools that Health Economists have invented for eliciting uncertainty, but I would suggest a high-impact place to begin looking would be the Discrete Choice Experiment, which could be easily systematised across EA spaces.
Insofar as the GiveWell model is representative, it appears that resolving 'moral' disagreements (e.g. the discount rate) are likely to be higher impact than 'factual disagreements' (e.g. the effectiveness of malaria nets at preventing malaria). This is not unusual in my experience, but it does suggest that the EA community could do more to educate people around these significant moral judgements given that those moral judgements are more 'in play' than they are in Health Economics. Key uncertainties which drive model outputs include:
What should the discount rate for life-years and costs be? (And should it be the same for both?)
What is the ratio at which we would trade life-years for consumption-doublings?
How could we strengthen our assumptions about charity level adjustments?
How risk-averse should we be when donating to a charity with both upside and downside risk?
I conclude that the benefits of a high-quality analysis of uncertainty are significant in the EA space, and represent ‘low hanging fruit’ to improve many EA activities. For example, there may be some scope for using uncertainty analysis to make better funding decisions by spotting situations when charities which perform reasonably well on expected value utility analysis are likely to underperform when examined across a range of different scenarios.
1.5 Summary of GiveWell-specific conclusions
This is mostly an essay about techniques for uncertainty analysis which happens to use the GiveWell model as an object example because I had it lying around in an easy-to-analyse state. Therefore, all graphs / analyses / conclusions relating to GiveWell in the essay below should be taken with a huge grain of salt, because the underlying uncertainty distributions are based on my finger in the air rather than a proper consideration of what the values in these models should look like (to be clear; because I wanted to use my time demonstrating more complex analyses rather than parameterising simple analyses not because such work is without merit). Nevertheless, if GiveWell replicate my analysis with more care they will hopefully reach similar conclusions. To give a sense about what sorts of conclusions they would be, and therefore whether they would be helpful to GiveWell, I report GiveWell-specific results below as if you could trust my parameterisation.
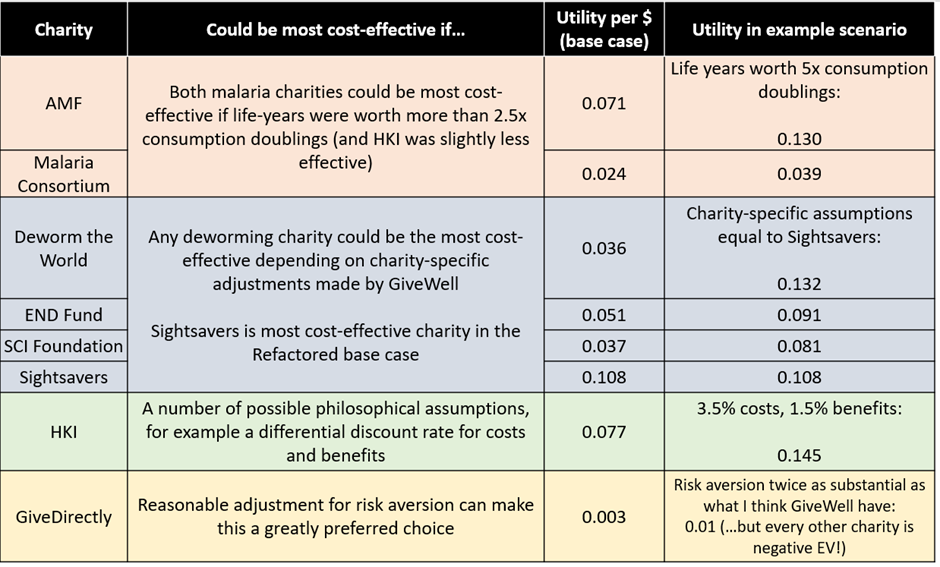
By means of a broad conclusion, uncertainty analysis is supportive of GiveWell’s current approach of not simply donating to the charity with the highest cost-effectiveness ratio in the base case model. There is a high degree of uncertainty surrounding this model and any charity in GiveWell’s top recommendations has the potential to be cost-effective within the bounds of some very reasonable sensitivity analysis. The table below suggests some plausible scenarios by which each charity might be the most – or at least significantly more – cost-effective
My three key conclusions as they relate to GiveWell specifically are:
GiveWell currently uses a rule of thumb that charities should be 10x more effective than GiveDirectly before they are funded. I think improving their uncertainty analysis means this rule can be completely scrapped, and replaced with a properly parameterised risk-adjustment analysis. This would have the effect of adjusting all results towards a sceptical prior as GiveWell desire, while not infinitely penalising a charity which can deliver a 9.9x benefit with high certainty (which is a clear failure-case of the current funding rule).
My impression is that GiveWell pull back from using their very impressive economic model as the sole basis for their decision making because they previously lacked the ability to formalise the reasonable insight that the Deworming charities seemed more uncertain than the Malaria / VAS charities, which themselves seemed more uncertain than Cash Transfer. The analysis of uncertainty toolkit doesn’t resolve this problem entirely, but it may allow GiveWell to more assertively use their model in the future.
GiveWell should focus on scoping out the following factual questions, to see if they are possible to resolve for the amount listed, derived from the VOI approach described in Section 3:
How has the composition of causes of mortality changed in areas HKI works since the VAS trials were run? Worth $1m to resolve
How does utility change in response to a ‘partial’ doubling of consumption (ie are GiveWell certain that a model using the natural log is correct)? Worth $1m to resolve
Replicate the deworming trial run by Baird et al. Worth $500k to resolve
Can we model Sightsavers supplemental benefits in a more sophisticated way? Worth >$500k to resolve (depending on exactly what can be improved)
Note that I’ve divided the actual VOI calculations I made in the essay by 10 to account for GiveWell spreading its philanthropic spend across multiple charities / projects – if it did not do this then the value of information (and hence the per-trial budget) could increase significantly
Section 2 – Scenario Analysis
2.1 Scenario analysis
The basic unit of uncertainty analysis is the scenario analysis. Just to try and keep everyone oriented as things get more involved, the scenario analysis is to the broader field of uncertainty analysis as basic addition is to more complex maths. I’m going to spend a while talking about scenario analysis because it is the foundation of what follows, rather than because it is – in itself – particularly revolutionary – modellers on the EA forums are (mostly) already using it appropriately.
A scenario analysis is more or less exactly what it says on the tin. Our model describes the state of the world as we believe it to be (our ‘best guess’, if you like), but the mathematical properties of the model mean that we can explore what would happen if we lived in slightly different worlds. For example, we could explore what would happen if we lived in a world where malaria nets were slightly more effective, or where deworming had fewer direct development benefits. We call these possible worlds ‘scenarios’. Whenever we change at least one parameter and look at the effect it has on outcomes, this is a ‘scenario analysis’. The reason we want to perform this analysis is to identify if plausible variations to our base case model might result in important changes to what that model is telling us. Literally everything that follows is just different ways of systematising this intuition.
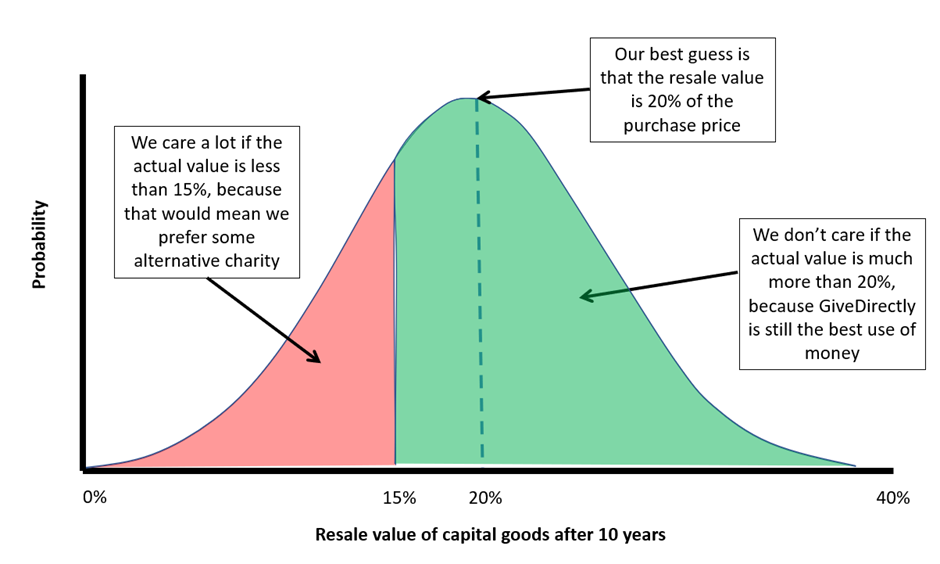
Let me take an example of how scenario analysis might be used from the GiveWell model. When we directly transfer cash to someone, they will spend some on consumption goods (food, clothes etc) and invest the rest into capital goods (furniture, tools etc). At least some of these capital goods seem like they might plausibly be sold on once they’ve outlived their usefulness, which GiveWell assumes happens after 10 years. How much value of an arbitrary capital good is retained after 10 years? GiveWell assumes 20% but notes, “We are extremely uncertain about the appropriate value for this parameter... We have not prioritized a thorough investigation into possible values for this parameter.” Should we worry about this?
One obvious way to find out if we should worry is to see what happens if GiveWell were wrong about the 20% guess. I show this in the table below, picking the maximum and minimum possible values the parameter could take. We see that this changes the total utility of a donation to GiveDirectly by about 20% (the basic unit of utility in GiveWell analyses is ‘doublings of the natural log of consumption’ – since this is a bit of a handful to keep writing I’ll just pretend there is a real concrete thing called ‘utility’ that we can measure without any difficulty). We don’t have to pick 0% and 100% - in fact we are doing an ‘extreme value scenario analysis’ here – but in this particular case there are very clear boundaries on how wrong the original estimate could possibly be, so we may as well go with those[3].
2.2 Short interlude: On ‘important’ changes
The key question you should be asking yourself here is, “Is this change important?”. Alternatively, we might ask, “how much would the output have to change before we considered that change important?”. 0.0007 utils doesn’t seem like a lot, but the difference is potentially the equivalent of a life-year lost on every $3.5k donated which seems like it is maybe non-trivial.
There are actually potentially a few answers to the question of describing an ‘important’ change, but I think the most relevant to EA is that a change is ‘important’ if it changes the way that you would act. That is to say, the point of a cost-effectiveness model is to guide action, which in this case is the action of donating a marginal philanthropic dollar. This is why I made such a fuss about the philosophical perspective of the model in my previous essay – because if the model is not set up to drive decision-making then it becomes really hard to identify when a change is important.
There are basically two ways in which a changed output might change your decision making:
If you have outside options on the marginal dollar you might donate, then these act as a ‘shadow price’ of philanthropic options in the model. For example, if you only want to donate if you will do a specific amount of good per donation then whether the target charity is above or below this line is an important consideration [4]. Since everyone has outside options in practice, this is an important consideration, but it is also a deeply personal consideration since there is no external evidence which can tell you your own shadow price for philanthropy.
More germane to the rest of this essay, changing the cost-effectiveness of one charity might affect whether it is the most cost-effective charity in the model. If you want to do the most good per philanthropic dollar donated, then we want to identify the most cost-effective charity and fund it for as long as it can turn marginal philanthropic dollars into utility at this rate. Scenarios where the most cost-effective charity in the base case might not continue to be the most cost-effective are of high importance to our decision making. This is not a deeply personal decision; it would be possible for any random person to specify a scenario they think you should consider, and then provide evidence that their scenario is more likely than the base-case scenario.
The diagram below might help make this point more clearly; an important change is not necessarily a ‘big’ change, but rather a change which pulls us over some invisible threshold into a world where we prefer to give our money to a different charity.
NB that the numbers are just made up for illustrative purposes.
For the rest of this essay I’m going to lean very hard onto the second interpretation, and pay particular attention to charities which have a possible claim on being the most cost-effective under different scenarios. In practice GiveWell have a sort of ‘soft threshold’ where charities need to be more than ten times more cost-effective than GiveDirectly to be recommended, so GiveWell do have a sort of idea about what the first interpretation might look at. However, later in this essay I will argue that the 10x threshold can be replaced with something better, so I'll write the rest of this section assuming only the second interpretation holds for an EA dollar you've pre-committed to donate.
2.3 Threshold analysis
Given that we know what an ‘important’ change is, we might want to focus on when and where important changes take place. That is, rather than randomly entering scenarios we think might be plausible, it is more efficient to identify scenarios where important changes take place and then decide whether those are plausible. This is a helpful framework to think about decision modelling, because it can remove the need to think about decisions entirely – if the only time your decision would change is in totally implausible scenarios then you don’t need to invest any resources finding out the true value of that parameter.
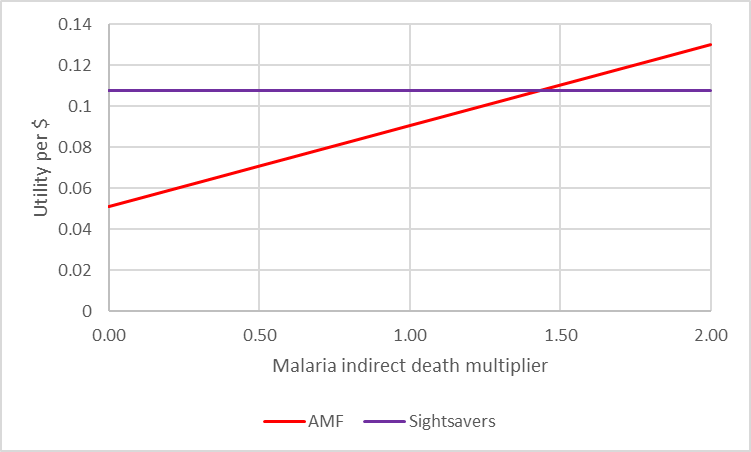
As an example, let’s consider the impact of the ‘indirect malaria deaths’ parameter on AMF’s cost-effectiveness. GiveWell write: “Empirical research suggests that malaria control interventions often have a larger effect on all-cause mortality than would be expected exclusively from declines in malaria-specific mortality”. However, they are very uncertain about how many lives are indirectly saved per malaria life saved, suggesting that the literature and expert consensus put the value somewhere between 0.5 and 1.0 life indirectly saved per malaria life saved (and GiveWell choose the 0.5 value). However, due to a slight structural error in the model they only applied this multiplier to Malaria Consortium and not AMF, so their consideration of the cost-effectiveness of AMF assumed it had no indirect effect on deaths. Did this matter?
To answer this question, we want to find the value for the ‘indirect malaria deaths’ parameter where the utility per dollar for AMF and the most cost-effective charity (Sightsavers) are equal. We could do this by just testing values and drawing something like the graph below (we are looking for the place where the lines cross) but the easier way to do this is to note that Excel has a built-in function to do threshold analysis (‘GoalSeek’) and quickly returns that the answer is 1.44
So, the question which was previously very difficult (“What is the ratio of direct malaria lives saved to indirect lives saved?”) has become potentially very easy (“Is this ratio more or less than 1.44?”). Since GiveWell’s read of the literature is that 1.0 is the upper plausible bound, it can be satisfied than in all plausibility the structural error it has made with AMF indirect deaths hasn’t made a significant difference to its conclusions. If you wanted to investigate GiveWell’s modelling of AMF, you can first ask yourself a sense-checking question, “Is this going to move the needle any higher than 1.44?” and if it is not you can save yourself the time of researching the question.
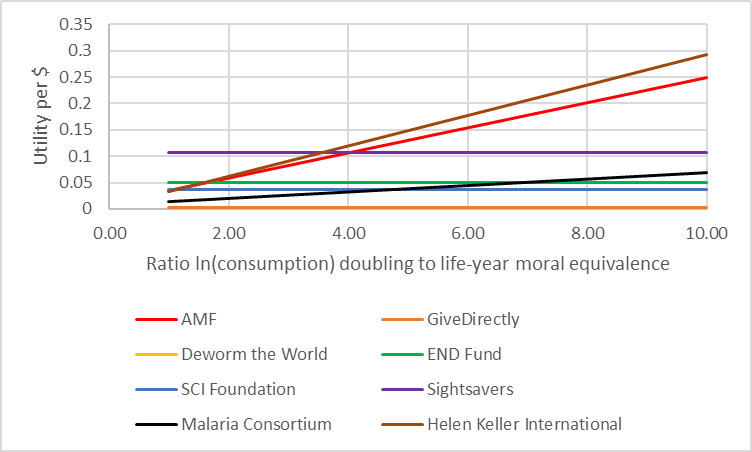
Just to add that the fact Sightsavers’ utility per dollar doesn’t change as the malaria indirect death multiplier increases isn’t an important feature of the technique. I picked the example of indirect malaria deaths because it was an interesting real-world case of threshold analysis, but you could for example create something like the graph below looking at how the most cost-effective charity changes as you change your view on the relationship between consumption utility and life-year utility, showing multiple charities changing their effectiveness at the same time.
Note that this graph also demonstrates another important reason you’d do scenario analysis; when we raise the ratio of consumption to life-years, we should raise the total utility per dollar for lifesaving charities. Moreover, it should raise this utility in a linear way for these charities and these charities only. If either of these things didn’t happen, we would worry that there is a modelling error somewhere. Scenario analysis performed by a critical friend is probably the only reliable way to check your model logic short of going through a model line-by-line or cell-by-cell, which often isn’t very workable.
2.4 Multi-way scenario analysis
There’s no reason scenario analysis needs to be conducted on one parameter at a time. We might want to randomly vary a couple of parameters at once or – more commonly – we might want to systematically co-vary parameters which are naturally linked in some way. For example, most people agree that discount rates for costs and benefits are naturally linked, in the sense that their underlying derivations share a few characteristics in common (for example, the probability of existential catastrophe in the next n years affects both kinds of discount rate). This is called ‘multi-way scenario analysis’ when we are varying inputs as part of non-systematic investigation or ‘multi-way sensitivity analysis’ when we do it systematically.
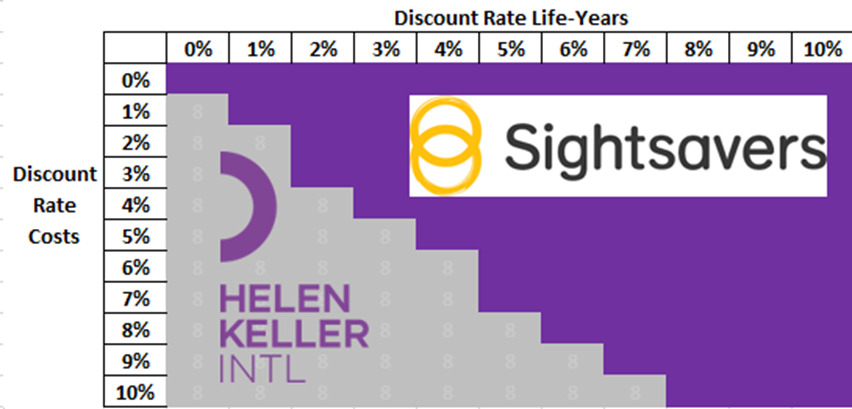
In the figure below I look at how the discount rate on life-years and discount rate on costs could be varied together to produce a plane demonstrating the same thing as ten separate threshold analyses, which better demonstrates the interaction between the two terms. It shows that in scenarios towards the north-east side of the diagram (high discount rate on life-years, low discount rate on costs) then Sightsavers is the most cost-effective charity, whereas in scenarios towards the south-west side of the diagram (low discount rate on life-years, high discount rate on costs) then HKI is preferred.
The importance of this is in further pinning down philosophical assumptions; many people don’t have a strong view on the discount rate, but do have a strong view about the relationship between the discount rate for costs and life-years. Rather than trying to define exactly what you believe the discount rate to be (I’ve seen people get into a screaming argument about whether it is 3.5% or 4.0%) you can instead identify that really the issue at hand is a philosophical one; if you believe costs and life-years should be discounted at the same rate then you are likely to prefer Sightsavers, whereas if you believe that costs should be discounted at a higher rate than life-years then you are likely to prefer HKI.
You can use this technique for any number of parameters. However jobbing Health Economists would mostly use more systematic techniques when the number of parameters goes much above two, which I’ll discuss in the next section.
A recommendation I have for EA modellers is that at the very least, scenario or threshold analysis should be conducted on all ‘important’ parameters which have an appreciable degree of uncertainty to them. Scenario analysis is already being used well at GiveWell for adding analytical capability to their modelling, but it would be helpful to do this for uncertainty analysis too, to ensure that their efforts are being spent in the right places.
Section 3 – Deterministic Sensitivity Analysis
3.1 DSA
Moving one level up the ladder of complexity, stacking many scenario analyses on top of each other will give you ‘Deterministic Sensitivity Analysis’ (DSA). Think of this as being like the relationship between addition and multiplication; you are doing exactly the same thing, but you’re adding a process to systematise the repetition of the basic action. In this case, what you’re doing is an extreme value scenario analysis on every scenario in serial and seeing what had the biggest impact on the results.
The steps to complete a DSA are pretty straightforward: we specify a maximum and minimum value for every parameter we want to test, then systematically work our way through the model testing those values and resetting the model to default after each test. In the Refactored model I add some fancy visualisation techniques to the result in the form of a ‘tornado diagram’ showing the main factors the model is sensitive to, but the steps I describe here are fortunately both the easy-to-replicate and the important ones. By my count the model has at least 124 separate parameters, so naturally we want to automate as much of this process as possible.
What is important to understand here is that – to a certain extent – we control what the DSA tells us about the model. If the base case is that a deworming treatment costs $0.50 but we say that the maximum cost of providing a one is $5 for Deworm the World and $50 for END Fund then it is inevitable that the DSA is going to tell us that there’s more uncertainty around END Fund’s spending than Deworm the World’s. Conventionally this is solved in Health Economics by using either entirely natural max and min values (eg either end of a 95% confidence interval) or by taking some fixed difference from the base case value, for example 80% and 120% of the base case value. In my model I’ve chosen the latter approach but tried to adapt it to the epistemic landscape facing EA. Specifically, I’ve made a gut-feeling call as to whether the value is known with very high certainty (in which case I use +/- 5% of base case), about average certainty (in which case I use +/- 20% of base case) or almost no certainty (in which case I use +/- 50% of base case). The very helpful comments by the GiveWell team often give an indication of this, but it is critical that the takeaway from this is that picking informative limits for DSA is as much art as science – it is a tool to help you investigate the model, not a precise analytical technique like a threshold analysis.
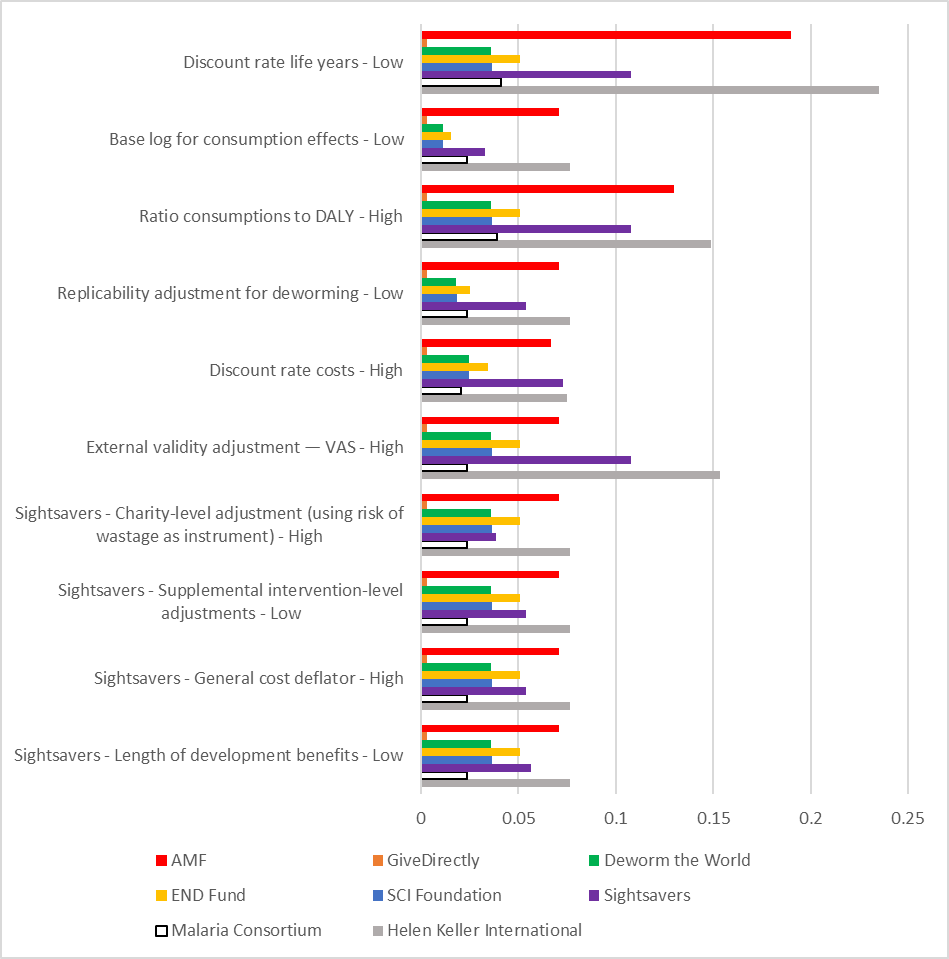
The ‘tornado diagram’ below is a somewhat typical way of presenting DSA results (I say ‘somewhat’ because I’ve made some EA-specific modifications so it doesn’t exactly correspond to anything typical in the Health Economics literature). Each bar represents the utility per dollar of a particular charity, and each collection of bars represents one specific scenario. For example, the first scenario is the consequence if the discount rate for life years is adjusted to the lowest possible value for all charities, which in my model is 0%. In keeping with the philosophical commitment to use the economic model as a decision-changing tool, the graph below only displays scenarios where we would stop funding Sightsavers and start funding another charity, which is most often HKI.
Remember that to an extent I have ‘chosen’ for these parameters to be the most important through my selection of upper and lower bounds for the DSA, so my conclusions are not actionable until GiveWell have conducted their own DSA and set their own upper and lower bounds. Nevertheless, we can see a couple of important things immediately from this graph:
The tornado diagram is showing us that there are at least ten circumstances where HKI is a more cost-effective use of philanthropic dollars than Sightsavers. In fact, there are conditions (such as a low discount rate on life years) where multiple charities could be more cost-effective than Sightsavers. This is why it is so important to draw a distinction between the base case of the model and plausible valid scenarios.
The major drivers of the model outputs appear to be philosophical in nature – the discount rate, ratio of consumption to DALY benefit and the function by which income converts to utility. These values could potentially be pinned down further, but it is likely that in fact there will be persistent good-faith disagreement about the most cost-effective charity. This supports GiveWell’s approach of not recommending a single ‘best’ charity, but rather recommending a spread of charities people might prefer in certain circumstances
Similarly, it gives some indication about which assumptions should receive further scrutiny. We can see that there are multiple very significant Sightsaver-specific assumptions going into the finding that Sightsavers is the most cost-effective charity. For example, Sightsavers has by far the highest leverage / funging adjustment of any charity (127% compared to 55% for SCI Foundation, which is the next-most adjusted). If, in fact, Sightsavers should not have been adjusted so much then conceivably it is not the most cost-effective charity. Therefore, a higher level of scrutiny should apply to these parameters.
3.2 Value of information analysis
DSA is a powerful tool in its own right, but I’d suggest the real value of DSA is giving us a framework to consider the ‘expected value of perfect information’ (EVPI). This is, formally, the price you’d pay to have perfect knowledge of the value of a parameter. Practically, it is another decision-tool; if the EVPI is more than the cost of generating the information then generating that information is more important than directly using the funds for philanthropic ends. However, if the EVPI is less than the cost of generating the information then we should make our peace with the current level of uncertainty (or come up with novel methods of reducing uncertainty that don’t cost as much!).
This is not quite the same thing as 80,000 Hours’ list of high impact research projects; it could be that you can plug a medium-importance gap with an SLR (priced around $500,000) rather than a high-importance gap with a clinical trial (price could be anywhere upwards of $50m in pharma, I assume that ballpark in EA too). As always, it is about spending charitable dollars in the most efficient way, even if that means doing lots of fiddling around the margin rather than one single definitive action.
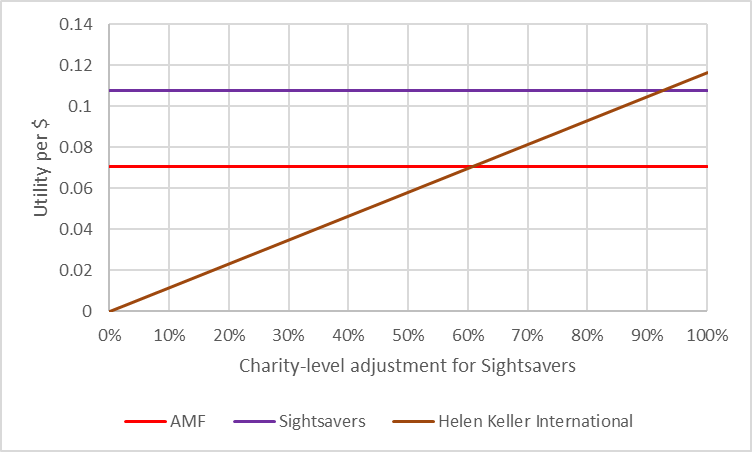
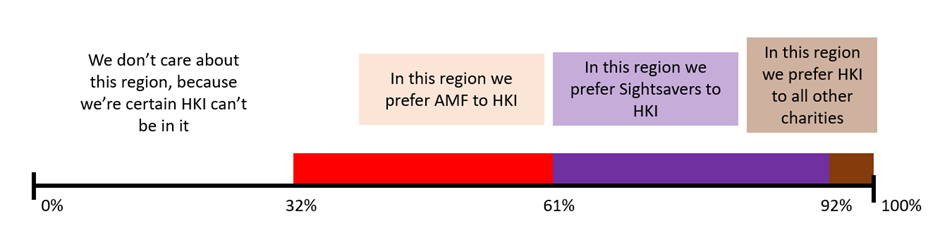
One scenario analysis we might have idly conducted is tinkering with the ‘Charity-level adjustment’ for HKI, since this can plausibly lead to situations where HKI is more cost-effective than Sightsavers. The ‘Charity-level adjustment’ is the risk that your donation is wasted through errors made by the charity. Donations can be wasted in a variety of ways; the highest risks for HKI are double-treating the same recipient and fabrication of data by local partners. HKI is actually quite severely penalised for this compared to other charities – GiveWell assume the adjustment is 66%, making it the most penalised charity in the analysis set. We can use threshold analysis (below) to identify that HKI is preferred to Sightsavers if the Charity-level adjustment is 92%, and may also be interested in when AMF is preferred to HKI (61%). This seems a not implausible level of adjustment – Deworm the World and GiveDirectly both have 92% adjustments, and so we’d be saying HKI is the most cost-effective charity if it is as careful with funds as either of Deworm the World or GiveDirectly.
To avoid this essay turning into a survey of EVPI techniques – and because I’m not a real expert here - I'll stick with some really basic intuition-driving and leave the details for someone more qualified to fill in. So let’s greatly simplify the maths and assume that the HKI Charity-level adjustment is the middle of a uniform distribution centred on 66% and ranging from 32% to 100% (ie symmetrically distributed). It is a safe bet that the maximum possible efficiency is 100%, because any more than this would mean that HKI can somehow magic money out of thin air due to good governance. However, a 32% Charity-level adjustment would be extremely harsh, so perhaps in reality the distribution is not quite this symmetric.
This means that we have a range of outcomes we are interested in, each with different probabilities:
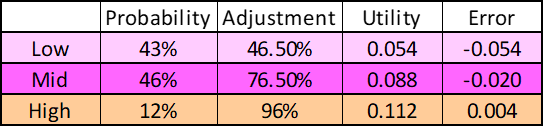
Let’s also simplify the maths and assume that if HKI is in any of these regions, it is always exactly at the midpoint of the region. So HKI’s Charity-level adjustment can be in one of three places:
So if the true value of HKI’s adjustment is in the ‘low’ (AMF-preferred) region, it would actually generate 0.054 utility per dollar, and funding HKI would be an error of 0.054 utilities per dollar (just a coincidence these are the same value). That is, the opportunity cost of funding HKI rather than Sightsavers would be 0.054 for each dollar you chose to do that with. By contrast if the actual value was in the ‘high’ (HKI-preferred) region, it would actually generate 0.112 utilities per dollar, meaning the opportunity cost of funding Sightsavers rather than HKI would be 0.004 utils per dollar.
Imagine we could do a study that would definitively tell us if we were in the ‘low’, ‘mid’ or ‘high’ region. Perhaps GiveWell could embed an employee double check how much money sent to a local contractor was misappropriated, or an academic could be commissioned to do a survey on how many people were double-treated. We’d expect this study to tell us we were in the ‘low’ scenario 43% of the time, the ‘mid’ scenario 46% of the time and the ‘high’ scenario 12% of the time (if this wasn’t true, then our assumptions about the underlying distribution of outcomes must have been wrong). In the ‘low’ and ‘mid’ scenario our expected utility gain is 0 per dollar (because we’d keep funding Sightsavers) but in the ‘high’ scenario our expected utility gain is 0.004 per dollar.
Obviously GiveWell is a bit bigger than worrying about single dollars. In 2018 it moved $65m charitable dollars (can’t find any more recent figures). I understand GiveWell doesn’t direct all of its money to a single most cost-effective charity, but I also understand that this is because of ad-hoc corrections for the sort of uncertainty analysis I’m describing in this essay. If GiveWell had total confidence in their economic model then they would donate the full $65m to Sightsavers, and generate approximately 7m utils per year for (let’s say) 40 years at a 4% discount rate. However, if we were really in the ‘high’ scenario, GiveWell should instead donate all of its money to HKI, and generate approximately 7.2m utils per year. Since GiveWell can always buy utils at a cost of $9.20 per util (by donating to Sightsavers), the value of discovering we are in the ’high’ scenario is 0.2m utils * $9.20 per util * 40 years at a 4% discount rate = $35m.
However, we also need to account for the possibility we do the study and don’t end up in the ‘high’ scenario. There’s only a 12% chance the study makes any difference to our decision, so we’d only pay a maximum of 12% of the $35m to definitively establish which scenario we were actually in – this is approximately a four million dollars. Therefore, if GiveWell can establish whether HKI has a charity-level adjustment of more (or less) than 92% for less than a four million dollars, doing this study is a better use of that four million dollars than directly applying it to charitable donations [5].
Of course, this scenario is greatly oversimplified for the purpose of showing the way in which EVPI could be used in EA to remove uncertainty from key values in a DSA analysis. Some key oversimplifications:
Trials are not guaranteed to give you perfect information; the maximum price you would pay for information needs to be conditioned on how likely the trial is to actually resolve the key question, which is really a question of Bayesian statistics.
Parameters are unlikely to break into three nice neat scenarios for analysis; more common is to have a continuous underlying variable giving you the possibility of infinite scenarios which need to be analysed. Comments about CEACs in the next section might be helpful here.
Parameters frequently co-vary; if HKI actually misappropriates much less money than GiveWell expects, this is probably because GiveWell was systematically pessimistic about misappropriation rather than because GiveWell has made specific errors about HKI as an institution. Since this also affects Sightsavers, we can’t consider HKI’s misappropriation risk in isolation. This cuts both ways; while it makes analysis more complicated because you need to account for one trial giving information on two (or more) parameters, this also means that the cost of doing a trial could in theory be defrayed across multiple EVPI calculations.
In reality uniform distributions are quite rare; it is much more common to see more complex distributions like the normal distribution. This increases the mathematical difficulty of estimating the probability of being in a particular state, especially if you lack good information about the exact shape of the underlying distribution. In fact, there’s no reason to assume the observed value of a parameter should be the midpoint of this unknown distribution anyway – you need to account for the fact you might be observing a freak draw from an entirely unrelated distribution, a process which will require statistical bootstrapping.
An EA specific point to note is that many uncertain parameters are inherently impossible to resolve. For example, the ratio of ln(consumption) doublings to life-years that are morally equivalent is – as far as I can see – a matter of personal judgement, which GiveWell can offer guidance on but not resolve. Trials here might be ‘worth’ less than trials of conventional parameters, in a way that needs a bit of thinking about.
There’s nothing about any of these points which inherently rule out EVPI analysis on charitable giving, so as mentioned I’ve ignored these points in this essay. However, if you’re planning on spending millions of dollars on a project it would be sensible to have an expert do the analysis the more complex way first!
The table below records what the model indicates are the highest-priority trials based on EVPI (excluding trials which couldn’t be run in principle, like trials on the discount rate). As always, be aware that in some sense the analyst can ‘choose’ the outcomes they like here by messing around with the underlying distributions of the variables. I’ve used a handful of more complex techniques to try to reduce some of this effect (eg by accounting for normal distributions rather than uniform) but nevertheless this isn’t actionable by anyone until GiveWell have parameterised distributions in a way that makes sense to them. The most critical caveat here is that this assumes that following an informative outcome from the trial GiveWell are satisfied that they now know the one true best charity and switch to donating all their funds to it, which is probably not a sound assumption so you should greatly discount the expected value of a trial for that reason.
“Takes changes in the prevalence of VAD between the VAS trials and areas where HKI works today and changes in the composition of causes of child mortality into account.”
$10m
Base log for consumption effects
“The logarithmic model captures the idea that money has diminishing value as you get more and more of it.”
“We only directly model some of the possible effects of the intervention. Many effects are excluded to keep the model tractable.”
“This section shows the speculative guesses we use to estimate the impact of outcomes we haven't explicitly modeled on the cost-effectiveness of our charities.”
$5m
Sightsavers - Charity-level adjustment
“Our best guess of how different charity-level factors affect our best guess of true cost-effectiveness.”
$3m
NB That the example of HKI drops out of this table because of different analytical methods (ie not treating the distribution as uniform)
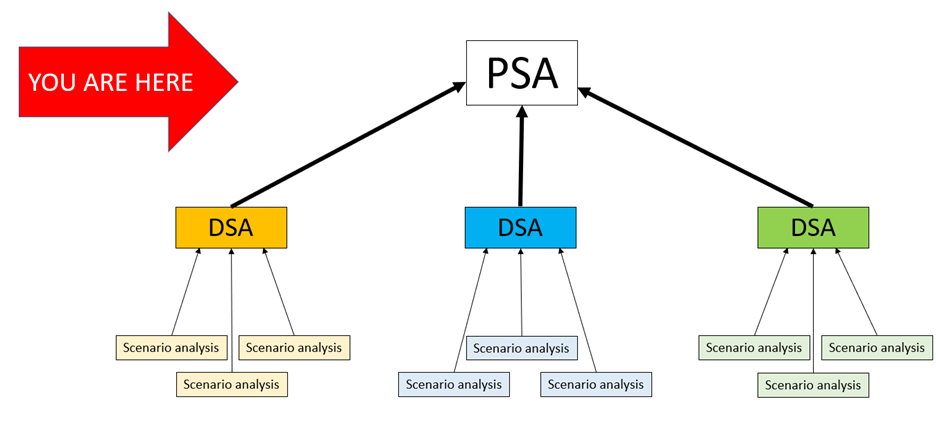
Section 4 – Probabilistic Sensitivity Analysis
4.1 PSA
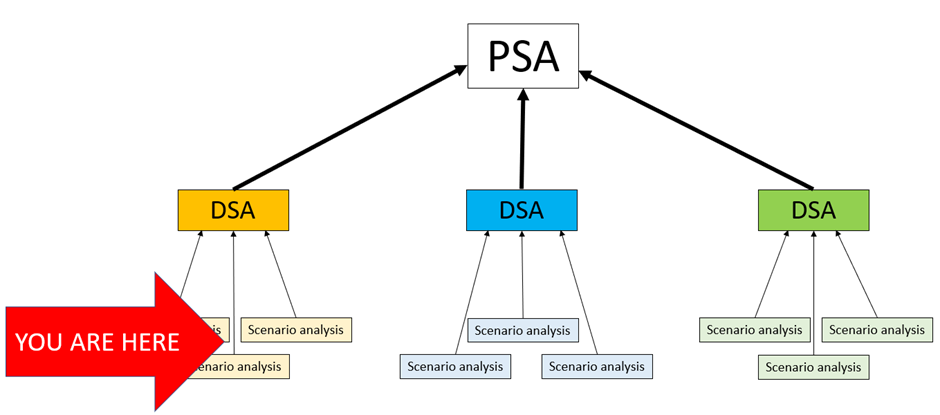
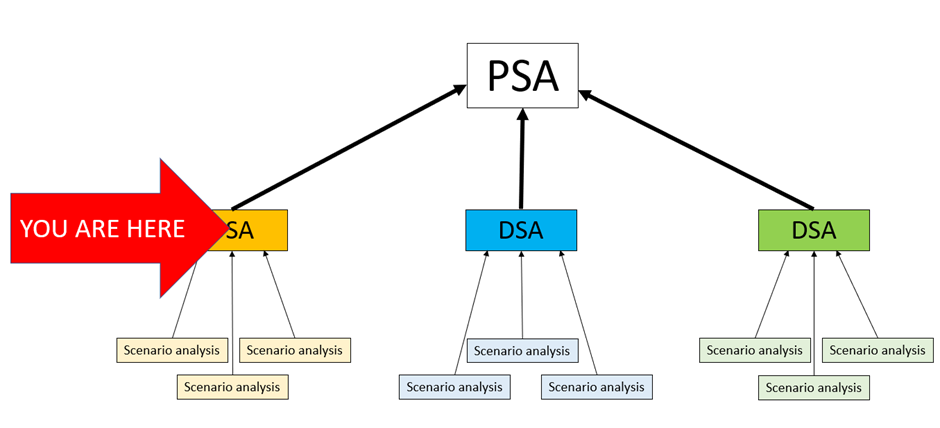
Moving one level up the ladder of complexity again, stacking many DSAs on top of each other will give you ‘Probabilistic Sensitivity Analysis’ (PSA). This is like the relationship between multiplication and exponentiation; you are stacking many of the basic subunits of analysis on top of each other to create mid-level analysis, and then stacking the results of that on top of each other in a systematic way to create top-level analysis. You could describe this as doing thousands of scenario analyses in parallel, or maybe instead doing a few hundred DSAs in serial.
A PSA simulates multiple possible iterations of the model, varying the input parameters slightly every time. This is sometimes described as ‘Monte Carlo modelling’ in deference to the fact that you’re basically doing spinning sophisticated computational roulette wheels to generate these outputs. The steps to generate a PSA are also fairly straightforward. You set up the model with a completely randomised set of values, and then repeat that process many hundreds of times (I use 500 iterations in the Refactored model). You could get exactly the same output by performing hundreds of DSA with slightly randomised input parameters, but automating this process with a PSA is distinctly faster!
The role of the PSA is to remove some structural uncertainties associated with DSA. In particular, the DSA introduces structural uncertainty through specifying a hard minimum and maximum value for each parameter, and retains a high degree of structural uncertainty by varying only one parameter at a time. The key difference in inputs between DSA and PSA is that for DSA you need to have a sensible theory of maximum and minimum plausible values whereas for PSA you need to also have a sensible theory of the distribution of the underlying values, which might include covariance. Sometimes this is very easy to generate (a 95% normally distributed confidence interval is all the information you need and this is very commonly recorded) whereas sometimes this is very hard to generate. In the Refactored model, I assume that the max and min values I generated for the DSA are exactly the same as the 95% confidence intervals for that value, which will work to generate plausible-looking graphs but – as before - is absolutely no substitute for GiveWell undertaking their own PSA and signing off on their preferred inputs.
Once again, it is critically important to understand that – to a certain extent – the modeller can ‘choose’ what the outcome of a PSA looks like. If I say that the 95% confidence interval for every variable governing the behaviour of GiveDirectly is twice as wide as every confidence interval governing the behaviour of New Incentives then it is natural that the resulting PSA will show more uncertainty for GiveDirectly than New Incentives. As with DSA this is very much a feature and not a bug, but it is something to be aware of.
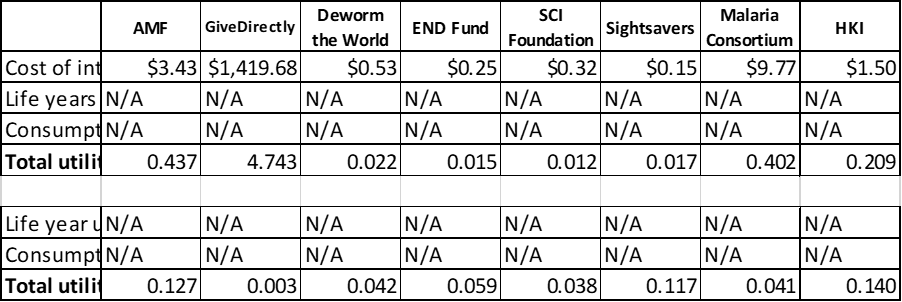
The table below shows the result, although you don’t get the full value of a PSA considering the table alone – you also need to look at the figure just below.
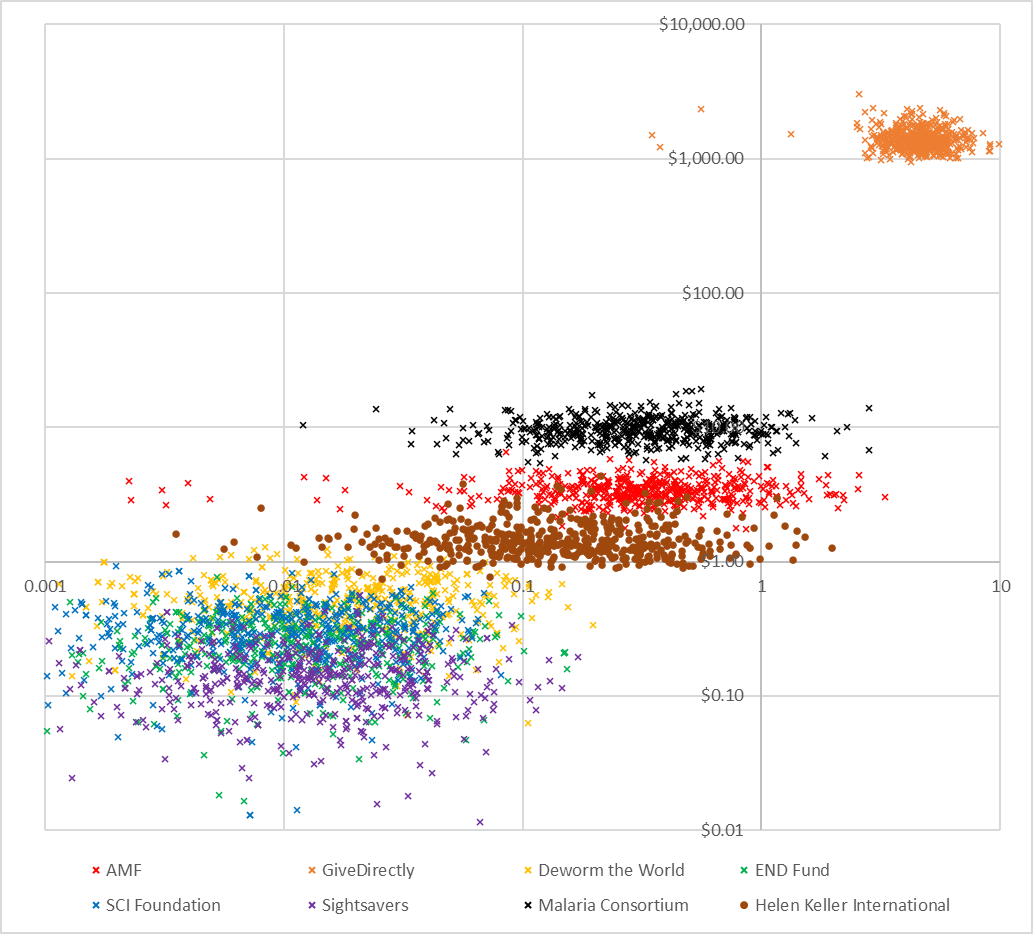
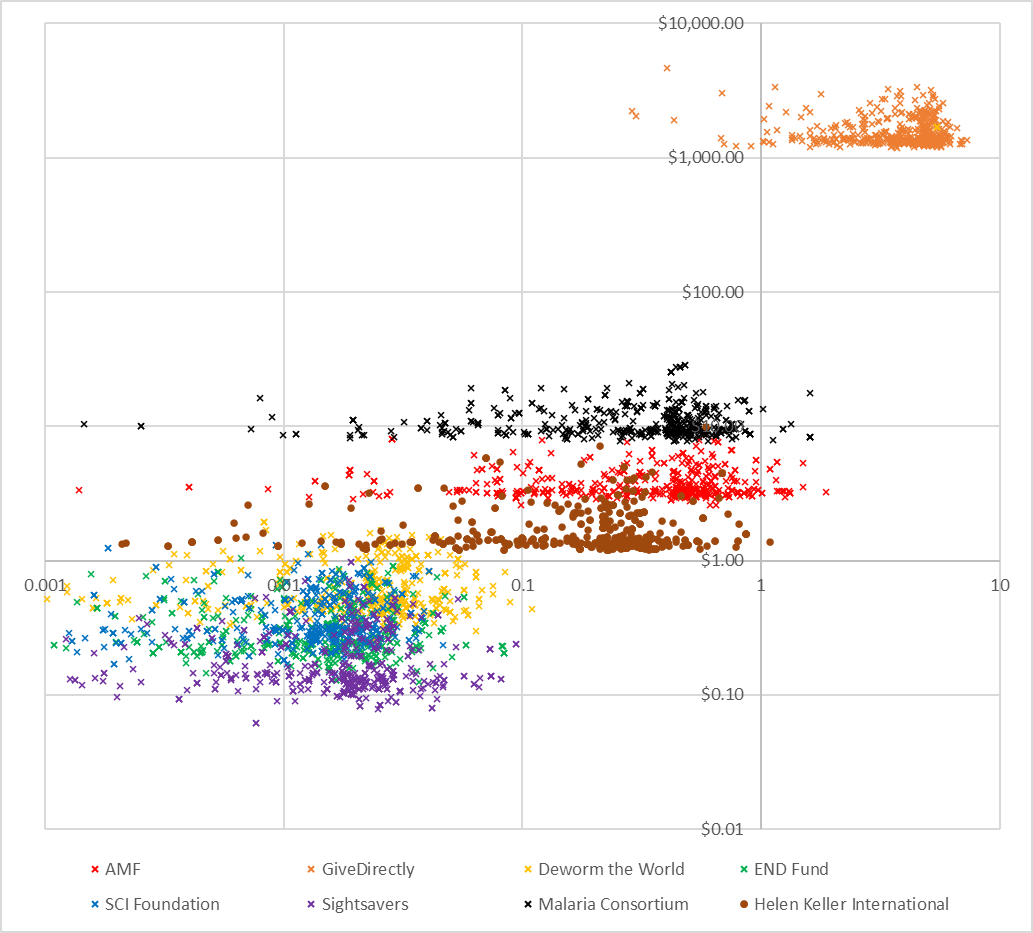
The ‘cost-effectiveness plane’ below demonstrates the results of running my distribution of underlying values on the Refactored model. Cost-per-intervention in donor-dollars run up the y-axis, while utility-per-intervention runs along the x-axis. Do please note the log scale on both axes. Each data point represents a single charity’s contribution to one particular PSA run.
As with the DSA, don’t over interpret this until GiveWell have had an opportunity to parameterise their model with their own view about underlying distributions. However, assuming they pick values at least reasonably close to me, they will likely end up with approximately the following conclusions:
There are three fairly clear clusters which emerge from the PSA:
In the bottom left we can see all of the deworming charities, which are extremely cheap per intervention (<$1) and which give the smallest amount of utility per intervention (between 0.1 util and 0.001 util). In general the costs and utility gain per intervention are about as uncertain as each other.
In the middle we can see the two malaria charities, and HKI. These charities are quite cheap per intervention (between $1 and $10) and give a larger number of utils than the deworming charities (between 0.01 and 1 util). The benefits for these charities are much more uncertain than the costs.
In the top right we have GiveDirectly. It costs slightly more than $1000 for GiveDirectly to undertake one intervention (which makes sense, because their intervention is transferring $1000 to someone) and that intervention will gain around 5-10 utils. There is good certainty on both the costs and benefits of GiveDirectly.
Because of the way the model is parameterised, AMF and HKI both appear more cost-effective on average than Sightsavers. I haven’t done too much investigation into this, but I think that’s because the model is slightly asymmetric with respect to discount rates in a way which favours AMF / HKI (in the sense that the base case is 4% but I vary it from 0% to 6% because 0% seems just barely plausible to me but 8% seems utterly crazy – even 6% is pushing it). To be clear, this isn’t wrong (it is perfectly reasonable for the underlying distribution to be asymmetric in reality), but this is a good example about how an analyst can impose certain outcomes on a PSA.
We should be concerned that in some cases the Deworming interventions are strictly harmful. This most frequently occurs because the base log for consumption increases has been sampled under 1 (which is totally implausible and I should probably have removed the possibility from the model), but can also occur when the leverage / funging adjustment is sampled low, such that in principle your $1 donation prevents donations from other sources. You can’t see this on the graph because it is a log scale, but it is an important thing to check when performing the analysis!
I recommend EA modellers begin producing PSA plots as part of their assessment of their top-rated charities. To the best of my knowledge there is no better or more straightforward way of displaying the uncertainty associated with the base case model, and this uncertainty can help people make better donating decisions.
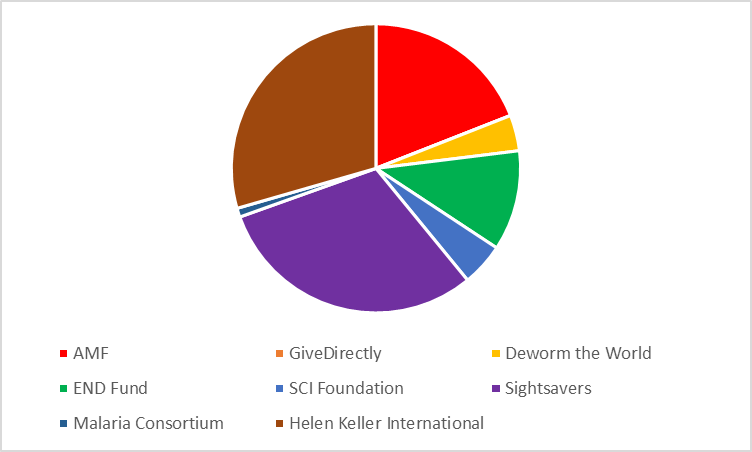
4.2 Probability most cost-effective
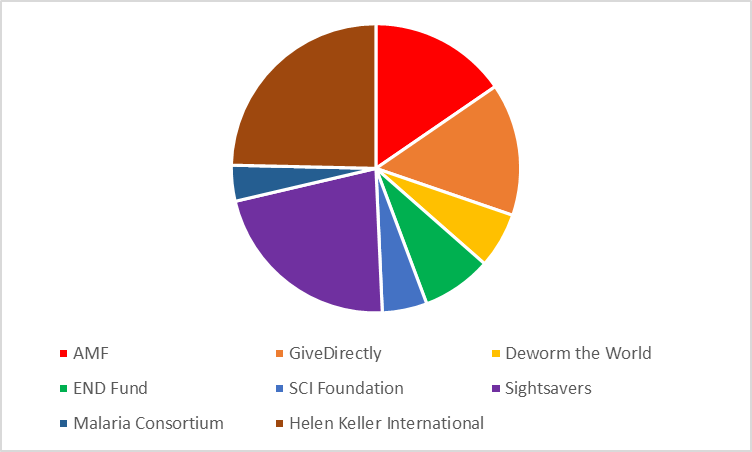
Although Sightsavers is the most cost-effective charity in the base case, it is clear it is not the most cost-effective charity in every PSA run. The diagram below shows the proportion of PSA runs where one particular charity was the most cost-effective. You can see that about a third of the time it is Sightsavers, another third is HKI and then the remaining third is split between AMF, Deworm the World and SCI Foundation. We might say from this – roughly – that Sightsavers has a ~33% chance of being the best use of your philanthropic dollars.
Note a common error most people immediately make upon seeing this graph – this does not necessarily mean that you should donate 33% of your charitable giving to Sightsavers and so on proportionally round the pie chart, because it is possible that in the cases when Sightsavers is not the most cost-effective it is really significantly worse than the alternatives (for example because it actually causes harm in those scenarios). Averages are still important!
However, it does have some interesting implications if you dig in to why the slices are the size they are. For example, one reason Malaria Consortium does quite poorly on the ‘probability most cost-effective’ metric despite being pretty good on a cost-per-QALY basis in the base case is that it systematically co-varies with AMF. What I mean by this is that in almost all cases when Malaria Consortium overperforms the base case it is because of randomly sampling a world where malaria is nastier in some way than the base case assumes. But because AMF also prevents malaria, AMF also overperforms the base case in these scenarios. Because AMF is fractionally more cost-effective than Malaria Consortium per case of malaria prevented, AMF ‘crowds out’ Malaria Consortium in most scenarios.
This could lead to altered funding decisions, depending on the philosophical framework with which we approach the problem:
We could say, “I am interested in 10x multipliers vs GiveDirectly. AMF and Malaria Consortium are roughly similar interventions, and have roughly the same probability of being 10x more effective than GiveDirectly (which is to say, both are highly likely to meet this bar). Therefore, I don’t really care Malaria Consortium is only ~5% likely to be the most cost-effective charity, because it is highly highly likely to be a 10x charity regardless”
We could alternatively say, “I am interested in funding the most cost-effective charity across all possible worlds. Therefore, the fact that worlds were Malaria Consortium overperforms expectations are also (mostly) worlds where AMF overperforms expectations means I should reduce my donations to Malaria Consortium and increase my donations to AMF”
I understand that most people agree the purpose of EA is to do the "most good you can do” which appears to me to automatically require the second interpretation. I’d happily accept that there is probably debate to be had about this point by people more philosophically nuanced than me though! If the second interpretation receives broad support then funding decisions would probably have to change to greatly penalise Malaria Consortium for not offering an edge on AMF in many possible worlds. This is absolutely not Malaria Consortium’s fault, and instead a reflection of the good work they have done evidencing their claims of effectiveness to the point where we can make high-quality statements about the residual uncertainty.
Under all circumstances, however, be aware that averages are still important – the notes I make here about the relationship between AMF and Malaria Consortium are only relevant because of specific ground-level facts about the two charities which I have drawn out of the model and my background reading, and not just because of information contained in the pie-chart. As with the DSA, the 'probability most cost-effective' is an investigative rather than analytical technique.
4.3 APAC
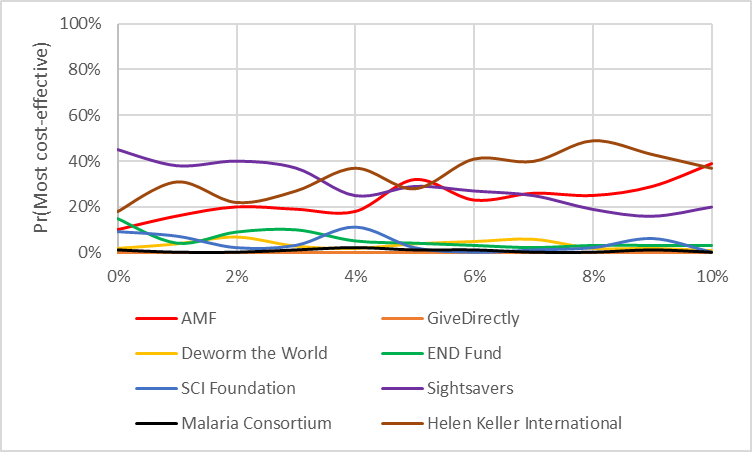
We can improve on simply counting situations when one charity outperforms another by systematically investigating ways in which the base case might differ from our own intuitions / moral views. For example, we saw earlier that Sightsavers tended to perform better when the discount rate was weighted towards discounting life-years strongly, while HKI performed better when it was weighted towards discounting costs strongly. What we would really like is some way to come up with a nice simple statement like, “Sightsavers is 33% likely to be the best use of philanthropic dollars” but with the output weighted towards our own personal views on things like the discount rate.
There are a lot of extremely complicated ways to formalise the way in which model outputs change in response to model inputs [6]. A pretty nice way to approach the problem is with a ‘CEAC’. A ‘CEAC’ is a concept in health economics standing for ‘cost-effectiveness acceptability curve’, and doesn’t really have an analogue in EA because there is no cost-effectiveness threshold in EA [7]. However, we can take the insight of CEAC to try and formalise some of the behaviours we are interested in embedding – I’ll call it an ‘APAC’ (Altruistic Parameter Acceptability Curve).
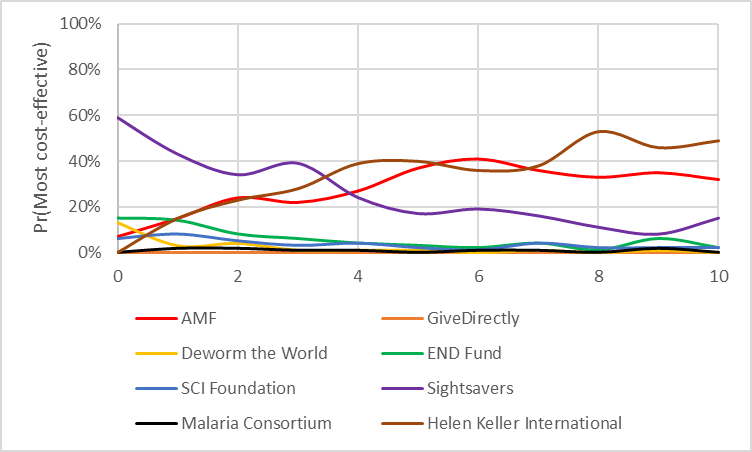
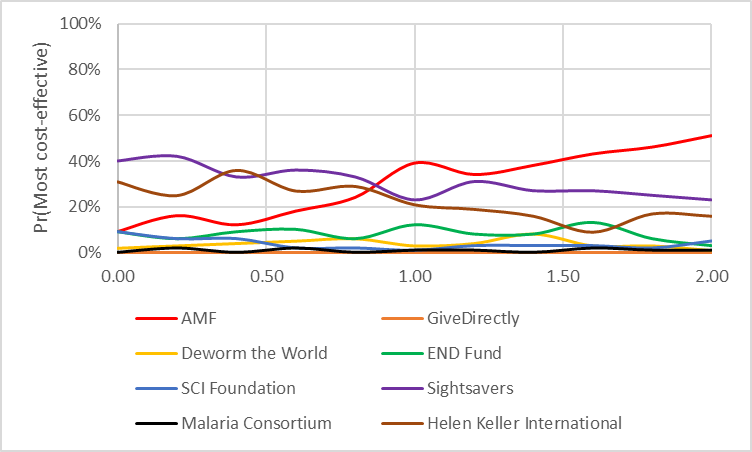
What we want to do here is mash up a PSA and DSA run together – we perform PSA analysis on all but one parameter, and then DSA on one single parameter of interest. For example, we might vary the rate at which we think a doubling of ln(consumption) should be worth in terms of life-years saved. Lower values indicate that we think life years and doublings of consumption are morally equivalent, higher values indicate that we think life-years are more important than consumption-doublings. In the diagram below we see the probability that a particular charity is the most cost-effective is on the y-axis, and the independent variable is on the x-axis.
Ratio of consumption to DALY
What this graph shows us is:
If you tend to think utility from doubling consumption is similarly important to life-years, you’ll prefer Sightsavers, if you tend to think the opposite you’ll prefer HKI. However there’s no point where HKI gains a decisive advantage over all other charities; AMF also benefits from a high ratio of consumption to life-years and so the top charity in those cases has approximately the same chance of being AMF as HKI.
The crossover occurs at 3.5 – that is, you don’t need to pin down exactly what you believe about the relationship between life years and consumption, you just need to know whether you would trade a year of someone’s life in exchange for doubling 3.5 people’s income. This is a very helpful sort of threshold analysis, because you could in principle see lots of different thresholds occurring all at once and whether the threshold is 'sharp' or gradual.
The fact that the lines are ‘wiggly’ isn’t important – it is just because I was running the simulation with only barely enough replications to get by (this is called ‘stochastic uncertainty’ in jargon). Tradeoffs between speed of execution and certainty of results are meaningful once you start using Monte Carlo simulations to any great degree.
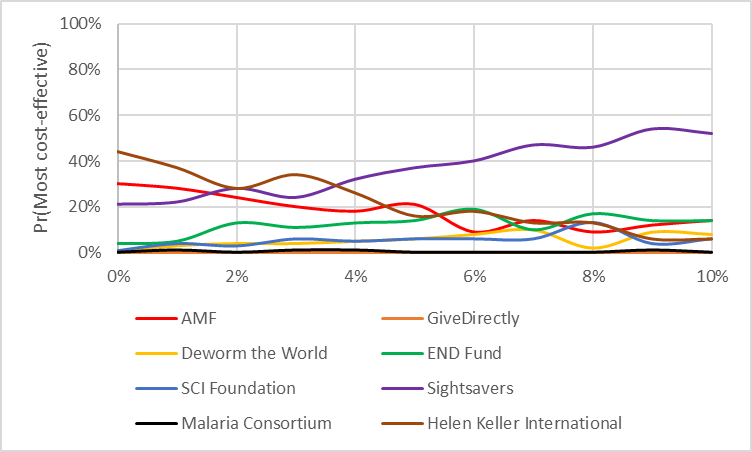
I’ve included three other graphs below which I think (from discussion on the forum) would be of interest to readers
Discount rate (life-years)
Discount rate (costs)
Number of lives indirectly saved per malaria death averted
Note that even though this improves the average cost-effectiveness of Malaria Consortium, it does not improve the probability of being the most cost-effective charity, since the impact is greater for AMF. This is discussed in the ‘probability most cost-effective’ section.
4.4 Risk adjustment
One especially important APAC we might be interested in is looking at which charity becomes the most cost-effective if we are increasingly risk-averse. This is important because part of the reason GiveWell don’t want to draw strong conclusions from their economic models is that they have a strong philosophical commitment to risk aversion, preferring charities with lower overall expected utility provided that utility gain is certain.
Sadly, this is another area where I am not a serious expert – professionally I work to the ‘expected utility only’ paradigm. Nevertheless, I could sketch a solution which future EA could take forward more seriously. In this simple sketch model, we take the datapoints which are bad for the charity (compared to average) and enhance their badness, and the datapoints which are good for the charity and reduce their goodness. This will have the effect of inflating costs and deflating benefits, which will have the knock-on impact of making charities much less cost-effective, as shown in the diagram below.
We could imagine that quite a sophisticated account of risk aversion here (for example one using an exponentially increasing function the further from average you get) but in my model I take the most basic approach possible – if a value is above average I divide the difference by X, and if it is below average I multiply it by X. This has the effect of making above-average results less impressive (because they are brought closer to average) and below-average results more concerning (because they are pushed away from average). The graph below shows X=2, and shows a distinct north-west shift of the values as interventions become costlier and less effective on average.
We can also see the effect that X=2 has on the most cost-effective charity across 500 iterations of the model:
I don’t think that ‘X’ has a sensible natural interpretation, but possibly (I mentioned I’m not an expert here) the interpretation is that you should set X to the lowest level where you would pay $1 to flip a coin for a gain of $X donated to charity rather than donating directly – that is, where the fear of loss outweighs the good of gain. I don’t know what this would be for most people, but values around 2-3 seem plausible for the sorts of decision problems GiveWell works with; their stated aim is to find charities which offer a 10x multiplier on cash transfers, and at values of 2-3 GiveDirectly outperform the top charities about 10% of the time (ie roughly equivalent on expectation). This suggests to me that values of 2-3 accurately reflect GiveWell’s risk preferences, although once again to note that these might not be your risk preferences [8].
Section 5 – Conclusions
Analysis of uncertainty is a collective name for a group of different analytical tools, some of which I have described in this essay. What links these tools together is a desire to systematise and quantify different types of uncertainty that arise when undertaking an ambitious modelling project like the GiveWell cost-effectiveness model. It is notable that uncertainty analysis is an area where existing EA models underperform the state of the art in my own discipline, Health Economics, despite a handful of isolated examples of very high quality usage of some elements of the toolkit. This essay contains detail on systematising the techniques used for the analysis of uncertainty, in order that future EA modellers might benefits from the accumulated insights of the discipline of Health Economics. For reference, I duplicate the list of techniques used in this essay below.
Consequently, I make my first set of recommendations about formalising the analysis of uncertainty in EA cost-effectiveness modelling. This is relevant for all EA modellers, not just GiveWell.
Conduct scenario analysis, including threshold analysis, on any parameter which is likely to have an important effect on the outcome of the economic model. It would be appropriate to conduct multi-way scenario analysis if the structural assumptions in the model are that multiple parameters would co-vary.
Always specify the underlying distribution of uncertainty from which parameters are drawn, and systematising the analysis of this uncertainty using PSA to ensure that their recommendations are understood in the context of the uncertainty they are being made in.
Conduct ‘APAC’ analysis on parameters which are likely to be contentious, in order to allow for a transparent conversation about how new evidence might shape our response to a particular charity.
There is enormous scope to do good by resolving high-impact uncertainty, using the tool of EVPI to ensure that the questions are being addressed in a cost-effective way. My analysis suggests that the highest impact question is to establish how the causes of mortality in areas where VAS trials were run has changed since those trials, although I’d caution that on top of specifying the model more fully before relying on this conclusion GiveWell should also conduct a more heavyweight analysis of the top opportunities to resolve uncertainty, taking into account EA-specific complexities I list in the essay.
Many thanks for the opportunity to participate in your community as an outsider, and for the kind feedback on the scope and content of this essay given by some forum members who have asked to remain anonymous. I hope at least some of the conclusions will help do good in the future.
This essay focussed on charity-vs-charity comparisons, but I suspect this is also highly relevant intra cause-area discussions, for example animal rights vs x-risk.
In fairness this is done better on the EA forums than anywhere else I have ever seen, but also the stakes are a lot higher on the EA forums because of the very diverse range of moral uncertainties which are in play for any given discussion
OK, I suppose you could resell something for more than you bought it, but if you’re going to be that pedantic there’s techniques which can address this coming up!
A lot of non-EA charities lean into this heavily, and advertise themselves as, "A donation of just $5 can save a life", with the unspoken caveat that this is under the most favourable possible conditions. Clearly, these charities are looking to exploit the bias that people like donating when they think their donation will do specific and tangible good, and trying to set the threshold where good is done as low as they can do without actually straight up lying. EA commendably avoids this trap, but that doesn't mean every EA is automatically immune to the psychological process driving it.
But please don't action this until you've read the caveats below - I've oversimplified dramatically and the effect of these simplifications is almost always to increase the expected value of information (and therefore by extension the value of a trial)
I can barely express how visceral my pain is at having to summarise such an interesting topic in a single sentence! My PhD was on these methods in Health Economics and so I'm jonesing to get into the details like you wouldn't believe. Unfortunately you can't get very far into this topic without running into some absurdly difficult statistics so I don't think overcomplicating things is in anyone's interest but my own. Safe to summarise that there are methods more complicated than described in this essay, and also probably safe to say that the combination of simple methods and sensible human analysis outperforms the hardcore algorithms every time for this sort of problem.
You could actually get fairly far by treating GiveWell’s soft 10x multiplier as a cost-effectiveness threshold, but I tried this for a while and got into a terrible mess because it doesn’t account for charities’ relative effectiveness to each other.
During writing this essay GiveWell removed GiveDirectly from its list of recommended charities. So in actual fact their risk aversion is slightly lower than I state here, by reveal preference. The point of the essay is to demonstrate principles though, so I didn't recalculate my results.
This is a crosspost from the new Animal Welfare Alignment Newsletter by Anima International. You can subscribe on Substack if you are interested in following these efforts. Audio reading also available on Substack.
The goals of this post are to:
1. Raise a question I see as crucially important to the goal of aligning AI to animal welfare...
“How long have you been v*g*n?”
This is one of the most common icebreakers at animal protection events. It’s a baseline assumption, and it mostly holds true: if you’re out advocating for animals not to be tortured or abused, realistically these days you are v**n, or close. And it makes for good conversation. It seems fairly safe to assume when you meet strangers.
But this assumption is hurting the movement in a way which we don’t always notice: someone new comes into the sp...
AI Use Note: Main body text entirely human written. Claude (Opus 4.8) helped develop models of animal life histories in the appendix.
Cross-posted from Good Structures.
Executive Summary
* Animal advocates sometimes make claims like “there are X of this animal...


Hello! My goodness I love this! You've really written this in a super accessible way!
Some citations: I have previously Quantified the Uncertainty in the GiveDirectly CEA (using Squiggle). I believe the Happier Lives Institute has done the same thing, as did cole_haus who didn't do an analysis but built a framework for uncertainty analysis (much like I think you did). I just posted a simple example of calculating the Value of Information on GiveWell models. There's a question about why GiveWell doesn't quantity uncertainty
My partner Hannah currently has a grant where she's working on quantifying the uncertainty of other GiveWell charities using techniques similar to mine, starting with New Incentives. Hopefully, we'll have fruit to show for other GiveWell charities! There is a lot of interest in this type of work.
I'd love to chat with you (or anyone else interested in Uncertainty Quantification) about current methods and how we can improve them. You can book me on calendly. I'd still learning a lot about how to do this sort of thing properly, and am mainly learning by trying, so I would love to have a chat about ways to improve.
And to add to this, very recently there was a post Quantifying the Uncertainty in AMF! Which still seems a bit in the works but I'm super excited for it.