This is Miranda Kaplan, a communications associate with GiveWell. Thanks so much for engaging with our cost-effectiveness model, we really appreciate it! This is on our research team’s radar, and they might reach out to you to seek clarification for anything they don’t understand or want to dig into more deeply.
My Hecking Goodness! This is the coolest thing I have ever seen in a long time! You've done a great job! I am like literally popping with excitement and joy. There's a lot you can do once you've got this!
I'll have to go through the model with a finer comb (and look through Nuno's recommendations) and probably contribute a few changes, but I'm glad you got so much utility out of using Squiggle! I've got a couple of ideas on how to manage the multiple demographics problem, but honestly I'd love to have some chats with you about next steps for these models.
I've been coming back to this model, because I've been doing some thinking on worldview diversification, and having a model like this is great for comparisons.
Two points:
The model is broken. Maybe worth pinning the observable imports to specific versions?
Thinking about this more, the counterfactual adjustments don't necessarily have to be a multiplication. i.e., it may not be that instead of dist, you have dist * 0.8 to 0.95, but rather you have mixture([dist, 0], [p, 1-p]). That is, when considering a counterfactual adjustment, it's not (only) that you have less impact because if you exist some worse option would replace you, it's that you have a chance at having no impact
For GW's current estimates this doesn't matter, but I feel that for distributions, capturing the true shape of the uncertainty does matter.
2. Yes, this makes a lot of sense and probably more closely captures GW's intent behind the adjustments.
re: versions of this model, stuff being broken, etc (mostly for the benefit of other readers since I think Nuño knows all of this already)
The version linked in this post is still working perfectly fine for me, even when I am not logged into my account. There is a new version from November 2022 that is broken; this was the version used in the GiveWell Change Our Minds contest entry with Sam Nolan and Hannah Rokebrand (here). The main contest entry notebook is not broken because it uses a downloaded csv of the results for each CEA rather than directly importing the results from the respective CEA notebooks (I believe Sam did this because of performance issues, but I guess it had an unintended benefit).
Since the GiveWell contest entry was submitted, I haven't made any updates to the code or anything else related to this project, and don't intend to (although others are of course very welcome to fork, etc.). Readers curious about the rough methods used can check out the notebook linked to this blogpost, which is still displaying properly (and is probably a bit easier to follow than the November 2022 version, because it does way less stuff). Readers curious about the end results of the analysis can read our main submission document, either on Observable or on the EA Forum.
Do share whatever you end up doing around worldview diversification! I'd be curious to read, and have spent some time thinking about these issues especially in the global health context.
Turns out that unpkg, an online service that Observable was relying on, was down yesterday (https://twitterc.om/unpkg/status/1636149026830843904), but this is fixed now. Sam Nolan thinks that it may have been cached by browsers, which is why it would show up broken for me but not for others, fixed now either way, though ¯\_(ツ)_/¯
As you point out, the section on population is kind of messy. I spent a bit trying to think about how to express uncertainty in a population pyramid, but didn't come up with anything particularly elegant (in particular, you can have uncertainty about what fraction of the population is of a particular age, but then you have to ensure that it sums up to 100%, which is annoying). Some scratchpad thoughts here.
Edit: Ok, this bothered me. You could specify the uncertainty over number of people reached in each age directly, and do something like this (using fake numbers):
num_people_reached_by_distribution_of_age(a) = {
    1 to 10 // fake dist
}

mortality_reduction_by_age(a) = {
    reduction = a < 1 ? 0.05 : 0.05* 1/a // figure out life expectancy at age in target population.
    reduction
}

value_of_life_at_age(a) = {
    to(1+a, 2 + a^2)
}

integrate(fun, min, max) = {
    // assume that min and max are integers.
    epsilon = 1
    l = max - min
    intervals = map(List.upTo(0, (l/epsilon)), ({|n| min + n*epsilon}))
    values = map(intervals, ({|x| fun(x)}))
    result = reduce(values, 0, ({|acc, x| acc + x})) * epsilon
    result
}

// Sanity check
// Check that this distribution corresponds to the uncertainty of the overall distribution
num_people_reached = integrate(num_people_reached_by_distribution_of_age, 0, 100) // make sure this makes sense

// Value of the distribution

value_from_age(a) = {
    n = num_people_reached_by_distribution_of_age(a)
    mortality_reduction_in_group = mortality_reduction_by_age(a)
    value_of_life = value_of_life_at_age(a)
    result = n * mortality_reduction_in_group * value_of_life
    result
}
value_of_distribution = integrate(value_from_age, 0, 100)
The problem with this is that specifying the number of people of each age reached by a distribution directly looks a bit annoying.
GiveWell starts with the mortality per 1000 child-years in 2004, pre-distribution of LLINs in the countries where the AMF currently distributes nets.
Huh, seems pretty long ago.
We can now calculate the mortality today relative to the pre-nets 2004 baseline. GiveWell estimates that 25% of this mortality difference can be attributed to LLIN distributions.
- Uncertainty for people under 5 is shockingly wide - My uncertainty about the lack of counterfactualness adjustment would be wider and my estimate lower (i.e., less impact). If AMF didn't exist, some other org might step in (but then that org would not have capacity for their marginal project? unclear).
Adding Quantified Uncertainty to GiveWell's Cost Effectiveness Analysis of the Against Malaria Foundation
This is a linkpost to a notebook I've written which uses Squiggle to quantify uncertainty in GiveWell's estimate of cost per death averted by the Against Malaria Foundation. My goal is to test a more legible cost effectiveness analysis of the AMF—one that readers can interact with and alter. This is heavily inspired by other cost effectiveness analyses created using Squiggle, and directly employs code from Sam Nolan's Observable notebook.
I'm copying only the methodology, final result, and some thoughts on Squiggle and cost effectiveness analysis here. The entire write-up can be found in the linked notebook.
Methodology
My approach is to copy GiveWell's analysis closely, except for incorporating quantified uncertainty where relevant. For some variables, such as disease burden data, and effect sizes from academic papers, we can use the confidence intervals to incorporate uncertainty. For others, where relevant uncertainty data is either private, non-existent, or very time-consuming to properly consider, I set the probability distribution arbitrarily, e.g., by setting a 95% confidence interval with ±10% of the mean value. I mark these arbitrary changes clearly in the code.
I make the following significant omissions:
I only examine the cost effectiveness of the Against Malaria Foundation's LLIN distributions in the Democratic Republic of Congo (DRC). GiveWell's CEA is broken down across eight regions where the AMF operates, without any explicitly-stated way I could find of aggregating them. I assume that GiveWell takes a weighted average of each region, but am unsure of the weighting.
I ignore income effects, and hence do not calculate the total units of value (in GiveWell's terminology) produced by the intervention. Instead, I limit this analysis to the question of how many lives are saved, and state the conclusion in USD/death averted.
The two omissions described above, in addition to high likelihood of mistakes (I haven't had anyone check this over, and have some concerns I've noted in the code) means that people should not take this notebook seriously as an actual cost effectiveness analysis of the Against Malaria Foundation. Instead, this is primarily intended as a way to continue testing using Squiggle (+ Observable) as a means of explaining CEA.
It can also a) give us a rough idea of the magnitude of the uncertainty of the cost effectiveness of the AMF, b) serve as a starting point for others to input their own estimates into the model structure.
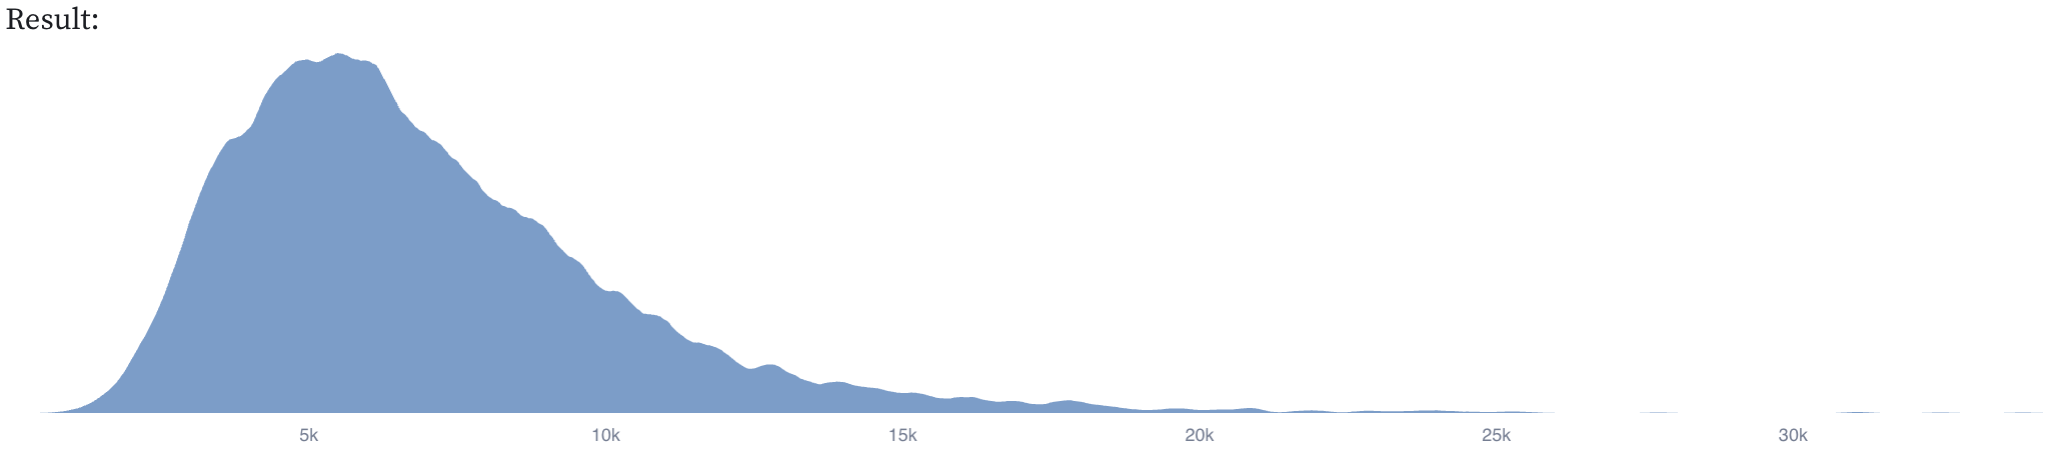
Cost per life saved, after all adjustments
The final cost per life saved is the total spending by all philanthropic actors divided by the product of the number of unadjusted deaths averted and each of the three adjustment factors.
GiveWell's point estimate for the DRC is $7,759. The mean of the distribution above is $6980. To reiterate, this should not be taken seriously as an update to GiveWell's estimate. This was more of an experiment in replicating a complicated model in Squiggle, and trying to explain what was going on in a notebook.
Some notes on Squiggle
I found the Observable + Squiggle combination easy to use, as someone with very little coding experience (besides small personal projects) and no CS background. The other options listed in this post, besides the playground, were not accessible at my level of (in)experience. If there are significant advantages for the average user in using Squiggle via a Typescript Library, for instance, it might be helpful to provide detailed steps in the style of Sam Nolan's Observable notebook.
I haven't yet looked into conducting sensitivity analysis on a Squiggle model. Time permitting, I plan on learning about sensitivity analysis more in-depth, and figuring out how to do it in Squiggle. If anyone has useful sources for this / has solved this problem already, I'd really appreciate a comment!
Minor issue, but when Squiggle throws an error, it is often difficult to know where I've made a typo because there is no reference to a specific line.
Some notes on explainable CEAs
The main purpose of this notebook was to test out presenting a CEA with quantified uncertainty in a way that felt intuitive to me. I definitely didn't fully succeed in this regard, in part because there are parts of GiveWell's CEA I still don't fully understand (which is a prerequisite to presenting something intuitively). I also haven't fully gotten the hang of Observable formatting, which I think significantly detracted from the notebook's presentability.
I think that explaining CEAs in this way is helpful in revealing some of the assumptions underpinning them. For example, I wouldn't have found it obvious by looking at a spreadsheet that GiveWell assumes the same age distributions for general population and net coverage. This might be useful for red teaming CEAs, i.e., it might both be helpful to re-code CEAs in order to scrutinise them, and re-coded CEAs may be easier to scrutinise.
This is a crosspost from the new Animal Welfare Alignment Newsletter by Anima International. You can subscribe on Substack if you are interested in following these efforts. Audio reading also available on Substack.
The goals of this post are to:
1. Raise a question I see as crucially important to the goal of aligning AI to animal welfare...
Hello! I'm Justin Portela. I got hired by GWWC to make YouTube videos after AI in Context did such a kickass job.
My channel is using that same cinematic, high-production value beauty to talk about everything in the EA universe that isn't AI.
...
This is a linkpost for Request for Proposals: Research and Applied Work on Digital Minds.
I'm glad to announce a request for proposals for research and applied work on digital minds at Longview Ph...


This is Miranda Kaplan, a communications associate with GiveWell. Thanks so much for engaging with our cost-effectiveness model, we really appreciate it! This is on our research team’s radar, and they might reach out to you to seek clarification for anything they don’t understand or want to dig into more deeply.