I could be missing something but this sounds wrong to me. I think the actual objective is mean(effect / cost). effect / cost is the thing you care about, and if you're uncertain, you should take the expectation over the thing you care about. mean(cost / effect) can give the wrong answer because it's the reciprocal of what you care about.
mean(cost) / mean(effect) is also wrong unless you have a constant cost. Consider for simplicity a case of constant effect of 1 life saved, and where the cost could be $10, $1000, or $10,000. mean(cost) / mean(effect) = $3670 per life saved, but the correct answer is 0.0337 lives saved per dollar = $29.67 per life saved.
Coming back to this a year later, I wanted to thank you for this comment! It took me an embarrassingly long time to realize I was wrong about this, but I was! I've now edited the post.
If any new reader is confused by the comments pointing out this mistake, see footnote 1 and the appendix above.
Ok, so say you have a fixed budget. Then you want to maximise mean(total effect), which is equal to mean(budget/cost * unit effect)
... I agree.
Also, infinite expected values come from having some chance of doing the thing an infinite number of times, where the problem is clearly the assumption that the effect is equal to budget/cost * unit effect when this is actually true only in the limit of small numbers of additional interventions.
Also, Lorenzo's proposal is ok when cost and effect are independent, while the error he identifies is still an error in this case.
The below is a reply to a previous version of the above comment.
I do not think we want to maximise mean("effect" - "cost").
Note "effect" and "cost" have different units, so they cannot be combined in that way. "Effect" refers to the outcome, whereas "cost" corresponds to the amount of resources we have to spend.
One might want to include "-cost" due to the desire of accounting for the counterfactual, but this is supposed to be included in "effect" = "factual effect" - "counterfactual effect".
We want to maximise mean("effect") for "cost" <= "maximum cost" (see this comment).
This was very common feedback, I should have added a section on it!
I disagree though. I think your example is perfect, with a denominator that spans many orders of magnitude
mean(cost) / mean(effect) is also wrong unless you have a constant cost. Consider for simplicity a case of constant effect of 1 life saved, and where the cost could be $10, $1000, or $10,000. mean(cost) / mean(effect) = $3670 per life saved, but the correct answer is 0.0337 lives saved per dollar = $29.67 per life saved.
I disagree, let's say you have N interventions with that distribution of costs and effects and you fund all of them. The total cost/effect would be ∑costi∑effecti=N⋅mean(cost)N⋅1=mean(cost)≈$3670
As an example, let's say you have three interventions with that distribution, and they turn out to be perfectly distributed, you have total cost=$11,010 and total effect=3 lives so, as a funder that cares about expected value, $3670 is the value you care about. https://docs.google.com/spreadsheets/d/1yfK7J5V4rBUQ7-lWKrdXDNyI3NYjRouub4KwO2PVkuQ/edit?usp=sharing here is a spreadsheet with 100 cases.
Not sure how useful it is as an intuition pump, but here is an even more extreme/absurd example: if there is a 0.001% chance that the cost is 0 and a 99.999% chance that the cost is $1T, mean(effect/cost) would be ∞, even if the effect is super tiny, which is definitely not what we care about.
In general, as JoelMcGuire mentioned, it's "a general issue where your simulation involves ratios", taking the other ratio helps only insofar as it prevents the denominator from spanning as many orders of magnitude.
Does this make sense? Is there a better way to write it? Is it completely wrong? In general, I think we don't care about the mean of X/Y, (that indeed can be dominated by cases where Y is really tiny), but about the expected total X / Y.
[This comment is no longer endorsed by its author]
As an example, let's say you have three interventions with that distribution, and they turn out to be perfectly distributed, you have total cost=$11,010 and total effect=3 so, as a funder that cares about expected value, $3670 is the value you care about.
That's true if you spend money that way, but why would you spend money that way? Why would you spend less on the interventions that are more cost-effective? It makes more sense to spend a fixed budget. Given a 1/3 chance that the cost per life saved is $10, $1000, or $10,000, and you spend $29.67, then you save 1 life in expectation (= 1/3 * (29.67 / 10 + 29.67 / 1000 + 29.67 / 10,000)).
Not sure how useful it is as an intuition pump, but here is an even more extreme/absurd example: if there is a 0.001% chance that the cost is 0 and a 99.999% chance that the cost is $1T, mean(effect/cost) would be ∞
That's a feature, not a bug. If something has positive value and zero cost, then you should spend zero dollars/resources to invoke the effect infinitely many times and produce infinite value (with probability 0.00001).
Not sure how useful it is as an intuition pump, but here is an even more extreme/absurd example: if there is a 0.001% chance that the cost is 0 and a 99.999% chance that the cost is $1T, mean(effect/cost) would be ∞, even if the effect is super tiny, which is definitely not what we care about.
I agree a non-null probability of null cost implies infinite mean cost-effectiveness (mean ratio between effect and cost). However:
For a null cost, you would have null effect, thus getting an indetermination of the type 0/0. Denoting as CEi the possible values of the ratio between effect and cost, for CE1 = 0/0, the mean cost-effectiveness would be:
CE_mu = (0/0 + CE2 + CE3 + ... CEN)/N = 0/0.
In reality, the cost can never be (exactly) null, and numerical errors resulting from the possibility of a very low cost could be handled by increasing the number of Monte Carlo samples.
The effect can be null, but this could be handled by focussing on "effect"/"cost" (what we arguably care about) instead of "cost"/"effect".
I think one should refer to "effect"/"cost" as cost-effectiveness, since more cost-effective interventions have greater ratios between the effect and cost.
Yeah, it's a very theoretical example. There are things that could be modeled as very very low cost, like choosing A instead of B where both A and B cost $10, but indeed let's focus on the other example.
I think we care about the expected marginal cost-effectiveness (i.e. mean("marginal effect"/"marginal cost")). Both mean("total effect")/mean("total cost") and mean("total effect"/"total cost") are good approximations if our budget is small, but they might not be if the budget has to be large for some reason.
Haha, I came up with that example as well. You're thinking about this in the same way I did!
I think to say that one is the "actual objective" is not very rigorous. Although I'm saying this from a place of making that same argument. It does answer a valid question of "how much money should one donate to get an expected 1 unit of good" (which is also really easy to communicate, dollars per life saved is much easier to talk about than lives saved per dollar). I've been thinking about it for a while and put a comment under Edo Arad's one.
As for the second point about simple going E(cost)E(effect). I agree that this is likely an error, and you have a good counterexample.
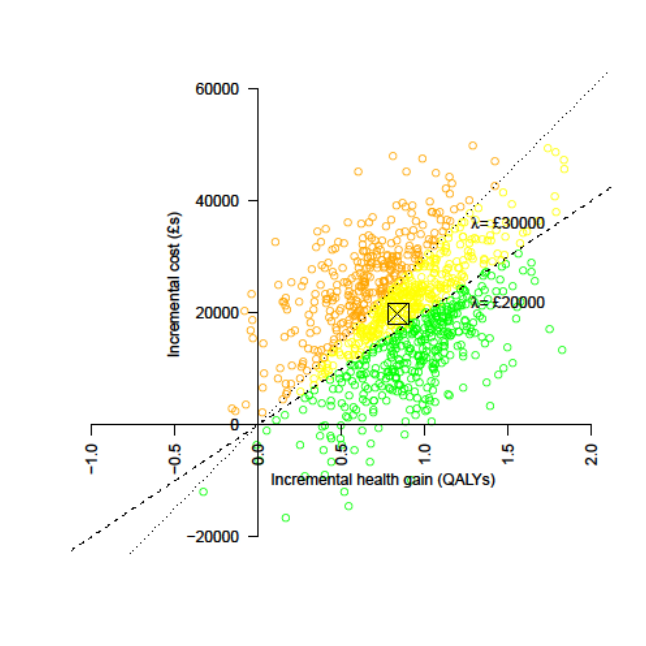
This is a recognised issue in health technology assessment. The most common solution is to first plot the incremental costs and effects on a cost-effectiveness plane to get a sense of the distributions:
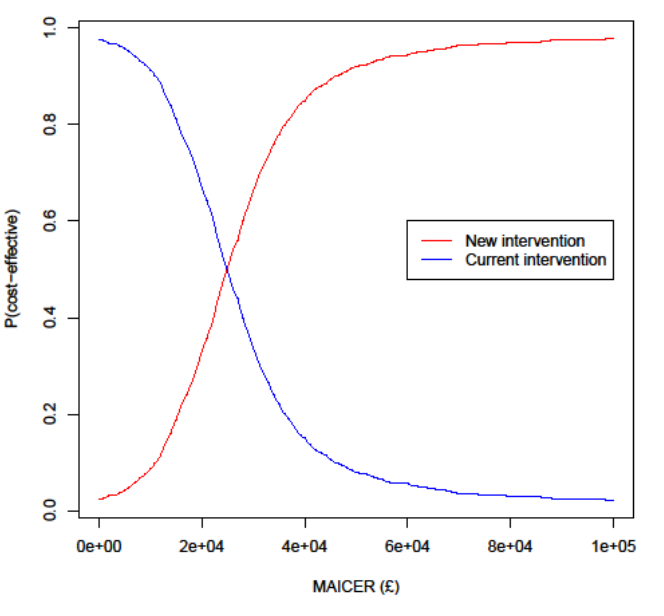
Then to represent uncertainty in terms of the probability that an intervention is cost-effective at different cost-effectiveness thresholds (e.g. 20k and 30k per QALY). On the CEP above this is the proportion of samples below the respective lines, but it's generally better represented by cost-effectiveness acceptability curves (CEACs), as below:
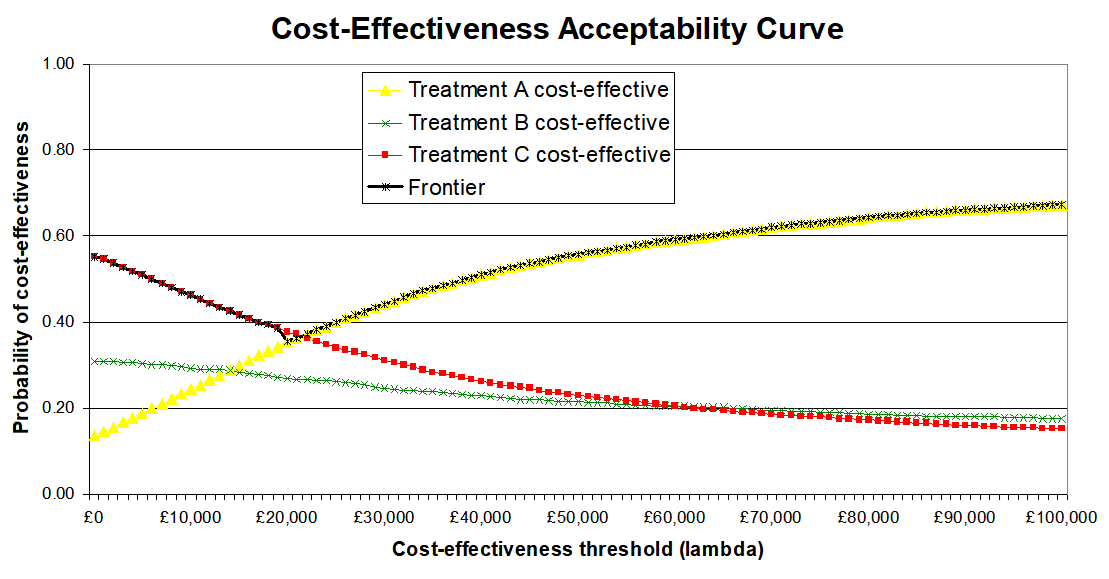
Often, especially with multiple interventions, a cost-effectiveness acceptability frontier (CEAF) is added, representing the probability that the optimal decision (i.e. the one with highest expected net benefit) is the most cost-effective.
I can dig out proper references and examples if it would be useful, including Excel spreadsheets with macros you can adapt to generate them from your own data (such as samples exported from Guesstimate). There are also R packages that can do this, e.g. hesim and bcea.
This is super interesting, thanks! Exactly the kind of thing I was hoping for when posting this!
Point clouds with cost-effectiveness lines seem definitely useful, I saw them in the HLI reports but indeed should probably be much more standard.
Cost-effectiveness acceptability curves also seem a useful tool for reasoning about funding opportunities. Especially since (as far as I understand) most grantmakers have a "cost-effectiveness bar" to decide whether to fund things. I hope it's well known inside EA as it's the first time I've seen it! I think it might have some downsides though, or at the very least need some small modifications. If there is a policy intervention that has a fixed cost and a 5% chance of having a huge value, how would the curve look? Also, what is "MAICER" in that plot?
This is also super interesting! Not sure how to use it to compare interventions in an EA context though, e.g. malaria nets vs vitamin A supplements but I have a feeling there is something there.
I can dig out proper references and examples if it would be useful
After looking at this post score, the comments, and some discussions I'm having, I think I'm not the only person a bit confused about these things. So I think any overview of these topics would definitely be useful, especially if it presents well-thought-out industry standards! I would especially be interested in examples of how to use these tools in an EA context (even if very simplified and theoretical). But in general, having examples of different ways to look at these things I think can be very valuable!
MAICER = maximum acceptable incremental cost-effectiveness ratio. This is often called the willingness to pay for a unit of outcome, though the concepts are a little different. It is typically represented by lambda.
The CE plane is also useful as it indicates which quadrant the samples are in, i.e. NE = more effective but more costly (the most common), SE = more effective and cheaper (dominant), NW = less effective and more costly (dominated), and SW = less effective and cheaper. When there are samples in more than one quadrant, which is very common, confidence/credible intervals around the ICER are basically meaningless, as are negative ICERs more broadly. Distributions in Guesstimate, Causal, etc can therefore be misleading.
The standard textbook for heath economic evaluation is Drummond et al, 2015, and it's probably the best introduction to these methods.
For Bayesian (and grudgingly frequentist) approaches in R, see stuff by Gianluca Baio at UCL, e.g. this book, and his R package BCEA.
Cost-effectiveness planes are introduced in Black (1990). CEACs, CEAFs, and value of information are explained in more detail in Barton, Briggs, & Fenwick (2008); the latter is a very useful paper.
For a very clear step-by-step explanation of calculating and interpreting ICERs and net benefit, see Paulden 2020. In the same issue of PharmacoEconomics there was a nice debate between those who favour dropping ICERs entirely and those who think they should be presented alongside net benefit. (I think I'm in the latter camp, though if I had to pick one I'd go for NB as you can't really quantify uncertainty properly around ICERs.)
For an application of some of those methods in EA, you can look at the evaluation we did of Donational. I'm not sure it was the right tool for the job (a BOTEC + heuristics might have been as good or better, given how speculative much of it was), and I had to adapt the methods a fair bit (e.g. to "donation-cost ratio" rather than "cost-effectiveness ratio"), but you can get the general idea. The images aren't showing for me, though; not sure if it's an issue on my end or the links are broken.
Here is a more standard model in Excel I did for an assignment.
Note that there are also methods for calculating confidence intervals around ICERs that avoid issues with ratios. The best I'm aware of is by Hatswell et al. I have an Excel sheet with all the macros etc set up if you want.
Thanks for raising this question! Following other comment, I find the use of mean(cost)mean(effect) somewhat unsatisfactory.
Perhaps some of the confusion could be reduced by i) taking into account the number of interventions and ii) distinguishing the following two situations:
1. Epistemic uncertainty: the magic intervention will always save 1 life, or always save 100 lives, or always save 199 lives, we just don't know. In this case, one can repeat the intervention as many times as one wants, the expected cost-effectiveness will remain ~$3,400/life.
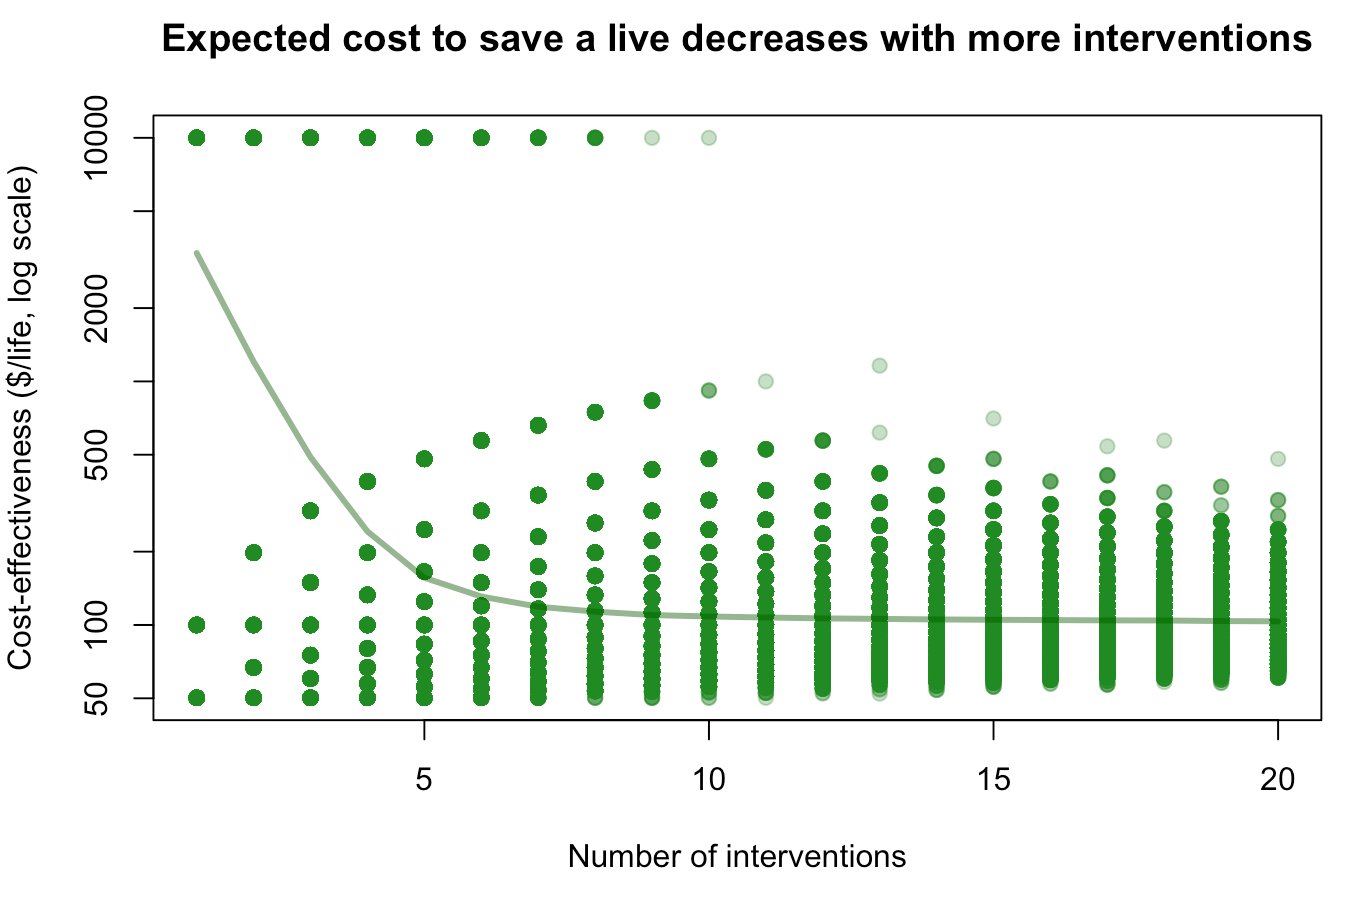
2. True randomness: sometimes the magic intervention will save 1 life, sometimes 100 lives, sometimes 199 lives. What happens then if you repeat it n times? If n=1, your expectation is still ~$3400/life (tail risk of a single life saved). But the more interventions you do, the more you converge to a combined cost-effectiveness $100/life (see figure below), because failed interventions will probably be compensated by very successful ones.
(R code to reproduce the plot : X <- sample(1:20,1000000, replace=T) ; Y <- sapply(X,function(n)mean(10000*n/sum(sample(c(1,100,199), n, replace = T)))) ; plot(X, Y, log="y", pch=19, col=alpha("forestgreen", 0.3), xlab="Number of interventions", ylab="Cost-effectiveness ($/life, log scale)", main="Expected cost to save a live decreases with more interventions") ; lines(sort(unique(X)), sapply(sort(unique(X)), function(x)mean(Y[X==x])), lwd=3, col=alpha("darkgreen",0.5)))
I'm not sure how to translate this into practice, especially since you can consider EA interventions as a portfolio even if you don't repeat the intervention 10 times yourself. But do you find this framing useful?
Thanks so much for writing this! I understood it much better than other comments.
do you find this framing useful?
I do! Especially the "epistemic uncertainty" vs "true randomness" framing I think is the core of the misunderstanding, I think we're usually in the second scenario (and funding lots of different interventions), but indeed it was a very implicit assumption!
First thing: unless I'm making a terrible mistake, your derivation for focusing on mean(cost)/mean(effect) is just mathematically wrong. It treats cost and effect as fixed numbers - you cannot divide a random variable by N because N isn't meaningful when talking about distributions. In the footnote you mention treating cost and effect as independent, which acknowledges that they are random variables, but then that invalidates the derivation.
Am I completely wrong? I can't see how this works.
This is not expected value - that could be bad
Second thing: do we actually care about mean(cost)/mean(effect)? In another comment you justify it because it's ∑cost/∑effect if we sum over different interventions. That does not mean it's the expected value of each intervention! It's just the total cost over the total effect. This does not have any direct link to expected value.
In fact, expected value is exactly why we don't want to squash variability in the variables. Let's say that cost is $1 or $1000 with 50% probability, and effect is 1 life or 1000 lives with 50% probability. Then mean(cost/effect) is 2 * 0.25 + 1000 * 0.25 + 0.001 * 0.25 ~250 $/life. Whereas mean(cost)/mean(effect) = $1/life.
Why are these so different? Because mean(cost)/mean(effect) neglects the "tail risk", the 25% chance that we spend $1000 and only save 1 life. This terrible situation is exactly why we do expected value calculations, because it matters and should be factored into our cost-effectiveness calculations.
That said, ∑cost/∑effect could have some philosophical grounding as a quantity we care about. I would love to see more elaboration on that in the post and a full defense of it. That would be really interesting and definitely worth a post to itself!
There are better solutions to unstable estimates
The best fix is: compute mean(effect/cost), not mean(cost/effect). This is because the denominator will never become zero. I have never seen a cost distribution that includes zero. It doesn't make sense for philanthropic applications. In fact if there was an intervention that had zero cost and improved lives we could all retire.
Yes, costs can still be low and this can make effect/cost very high. This is not a bug, it's a feature. This is what generates fat-tailed distributions of cost-effectiveness. The most cost-effective interventions have modest effects and very low costs.
∑cost/∑effect could have some philosophical grounding as a quantity we care about
I agree it's the main point of the post (we want to choose interventions in a way that maximizes the total effect). I thought it was a unanimous opinion but apparently, it's not?
The best fix is: compute mean(effect/cost), not mean(cost/effect)
I agree it helps in many cases, where the cost distribution spans fewer orders of magnitude than the effect distribution.
In the model in the post, both numerator and denominator have very high uncertainties
your derivation for focusing on mean(cost)/mean(effect) is just mathematically wrong
It's definitely not rigorous or formal.
I thought anyone with a math background would find the topic obvious, and most of the value would be in making the post accessible to casual estimators with many simple and informal examples.
My main argument for focusing on mean(cost)/mean(effect) is that I want to get the most value with a finite amount of resources, I don't really care about the EV of cost/effect since that's not valuable in itself. Maybe I could write total cost / total effect in that line, to keep it simple while making it less mathematically malformed?
[This comment is no longer endorsed by its author]
I do not think anyone with a math background would find this obvious. Judging by the comments on this post and the feedback you said you received, I think you should update your beliefs on whether this claim is obvious at all.
In fact, I think the focus on examples detracts from the post. Examples can be misleading. Picking an example with a fixed numerator or a fixed denominator ignores the tail risk that I described in my comment, so the example serves to obscure and not explain.
I don't really understand why you think it's so common sense to focus on this quantity? Maybe given that you're proposing an alternative to expected value calculations it seems reasonable that you have the burden of explaining why it's a good alternative. I highly encourage you to make that as a separate post - I believe the title and content of this post are misleading given that you are proposing a new concept but rhetorically treating it like the one most EAs are used to.
Substantively speaking, one issue with total cost over total effect is that it is strictly a sampling quantity. For small N, we are never guaranteed that total cost = N * mean(cost). This is a consequence of the law of large numbers, not something you can take for granted. Unless we run hundreds of interventions there is a strong chance that total cost over total effect is not actually the same as mean(cost)/mean(effect), where mean() is taken as the true mean of the distribution.
It's okay for cost estimates to span many orders of magnitude. As long as they are not zero, mean(effect/cost) will be well defined.
I do not think anyone with a math background would find this obvious. Judging by the comments on this post and the feedback you said you received, I think you should update your beliefs on whether this claim is obvious at all.
I was completely wrong, indeed!
Will think about the comments for a few hours and write an appendix tonight.
Do you agree that the main practical takeaway for non-experts reading this post should be "Be very careful using mean(cost/effect), especially if the effect can be small"?
I think the focus on examples detracts from the post. Examples can be misleading.
I disagree, the first example is exaggerated, but it's a very common issue, I think like a third of guesstimate models have some version of it. (see the three recent examples in the post)
Will respond to the other parts of the comments in the appendix, since many other commenters raised similar points.
I think the main practical takeaway should be to use mean(effect/cost) unless you have a really good reason not to. I agree mean(cost/effect) is a bad metric because it would be unreasonable for our effect distribution to not include zero or negative values - which is the only way mean(cost/effect) is even defined.
I agree it's the main point of the post (we want to choose interventions in a way that maximizes the total effect). I thought it was a unanimous opinion but apparently, it's not?
I think most people would agree that we want to maximise mean("effect") for "cost" <= "maximum cost". The crucial question is how to handle this optimisation problem when "effect", "cost" and "maximum cost" are distributions. The alternatives seem to be:
Maximising mean("effect") for mean("cost") <= mean("maximum cost"), which seems equivalent to maximising mean("effect")/mean("cost"), as proposed in this post.
Maximising mean("effect"/"cost"), as proposed in some comments of this post.
Thinking at the margin, these approaches seem equivalent.
Nice find, but I think there might be a subtle mistake there in the interpretation.
I think that the problem is with taking the expectation over 1effect, instead of multiplying the expected values mean(1effect)⋅mean(cost). It's reasonable to expect that the cost and the effect (of some specifically defined intervention) are uncorrelated, so the latter is actually the same as mean(costeffect).
However, taking the mean value of 1effect is definitely not the same as the reciprocal of the expected effect. In fact, at the start of the post you have computed a cost effectiveness of 100$ per life, but the way you have done it is by looking at the expected utility for the intervention (which is mean(effect)=100 lives ) and dividing the cost by this amount.
In GiveWell's CEAs (at least, I've verified for Deworm The World), they calculate the average value per constant constant cost. So this shouldn't affect their analysis.
I think that the problem is with taking the expectation over 1effect, instead of multiplying the expected values mean(1effect)⋅mean(cost).
I agree! It's the division that's not linear, not the multiplication. How do you think we could make it clearer in the post?
Edit: on more thought, I'm not sure I understand your point. mean(1/effect)⋅mean(cost) gives the "wrong" result (e.g. if effect can be 0 with non 0 probability, mean(1/effect) will be +∞)
People are asking the question "How much money do you have to donate to get an expected value of 1 unit of good".
I think the question is:
How can I do as much good as possible with C units of cost?
This corresponds to the problem of maximising E(U(C)), where U(c) is the utility achieved (via a certain intervention) for the cost c (which must not exceed C). If the budget C is small enough (thinking at the margin):
U(C) = U'(0)*C, where U'(c) is the derivate of U with respect to cost.
Assuming U'(0) and C are independent, mean("effect"/"cost") equals mean("effect")/mean("cost"):
mean("effect")/mean("cost") = E(U(C))/E(C) = E(U'(0))*E(C)/E(C) (assuming independence between U'(0) and C) = E(U'(0)).
So, it seems that, regardless of the metric we choose, we should maximise E(U'(0)), i.e. the expected marginal cost-effectiveness. However, U'(0) and C will not be independent for large C, so I think it is better to maximise mean("effect"/"cost").
I think Michael Dickens explains this better than me in a more recent comment. The point is that we usually care about effect/cost rather than the other way around (although I'd love to understand more clearly why and when exactly that's true). In your example, you have implicitly computed this and then compare it to Guesstimate's model computing cost/effect.
How do you think we could make it clearer in the post?
I think your example should focus on the mean of the ratio between the effect and cost, not on the mean of the ratio between the cost and effect. The latter is a bad metric because:
A very small "cost"/"effect" could correspond to interventions that are either quite bad or good (since "cost"/∞ = 0). This means small numerical errors could lead to large differences in mean("cost"/"effect"), which is bad.
When changing from negative values of "cost"/"effect" to positive ones, the goodness of the intervention increases (changing from harmful to beneficial). However, for negative and positive values, a higher "cost"/"effect" corresponds to a worse intervention.
The metric "effect"/"cost" has good properties:
A higher value always implies a better intervention (at least in theory).
The main reason why convex optimization isn't a commonly used model in this setting is because interventions are discrete objects. You can't run 1/4 of a malaria bednet project and 2/3 of a deworming project since there are scale effects.
When you treat projects as discrete and apply a budget constraint, the knapsack problem becomes a more natural model.
I might be misunderstanding what you mean by applying convex optimization. Say more?
This is a subtle point that people often miss (and I regularly forget!).
Also is a general issue where your simulation involves ratios. A positive denominator whose lower bound is close to zero will introduce huge and often implausible numbers. These are situations where the divergence between E(x) / E(y) and E(x/y) will be the largest.
How can we express the uncertainty around cost/effectiveness if the ratio distribution is hard to reason about and has misleading moments?
This is my question too, mean(x) / mean(y) has no variance! The point of doing simulations was to quantify the uncertainty around our cost-effectiveness calculations!
The approach Sam (colleague at HLI) and I have taken is:
To report point estimates as calculated from point estimates (i.e., run calculation without simulating uncertainty).
For reporting CIs of cost-effectiveness, first check if the mean(x/y) approximates mean(x)/ mean(y). If so, then we use the uncertainty generated.
Edit: mean(x)/mean(y) has some variance, but it's not quite what we're after. Thank you Caspar Kaiser for pointing this out.
One possibility for quantifying the uncertainty of the cost-effectiveness is focussing on the metric "effect"/mean("cost"). It ignores the variance of "cost", but maybe this is not problematic given we want to maxime mean("effect") for a fixed (constant) "cost" we are willing to spend?
Edit: mean(x)/mean(y) has some variance, but it's not quite what we're after. Thank you Caspar Kaiser for pointing this out.
mean(x)/mean(y) is a contant, and therefore has null variance.
Thanks so much for commenting! Huge fan of your work!
Also is a general issue where your simulation involves ratios. A positive denominator whose lower bound is close to zero will introduce huge and often implausible numbers. These are situations where the divergence between E(x) / E(y) and E(x/y) will be the largest.
Yes, I think in general cases where the denominator spans multiple orders of magnitude (which is usually because it can be close to 0). In some models I saw it could even be negative (e.g. normal distribution with 90% between 1 and 10), which lead to even more confusing results.
To report point estimates as calculated from point estimates
Isn't that also misleading in many cases? e.g. mean(log(cash)) ≠ log(mean(cash)), and I think we care about the former.
first check if the mean(x/y) approximates mean(x)/ mean(y). If so, then we use the uncertainty generated.
I think if y does not vary too much on a log scale this is good enough, and that is true in most cases (not sure how to express this, has low relative variance?). Otherwise, I guess you can try to consider y/x and still be informative (e.g. lives per $1,000 instead of dollars per lives). Sad to hear you don't know of a good general solution :( Do you think showing point clouds, like you do in the HLI reports, helps with this?
EDIT: mean(x)/mean(y) has some variance, but it's not quite what we're after
Isn't the variance 0? Since mean(x)/mean(y) is a number and not a distribution? x/y does have some variance sometimes (e.g. a Cauchy distribution apparently has no variance, but the math seems harder than what we need).
Isn't the variance 0? Since mean(x)/mean(y) is a number and not a distribution?
No, I don't think that's correct. I take it that with "mean(x)" and "mean(y)" you mean the sample averages of x and y. In this case, these means will have variances equal to Var(x)/N and Var(y)/N. Consequently, the ratio of mean(x) and mean(y) will also have a variance. See here and here.
But now I'm still confused: why is this "not quite what we're after" and why can't we use it to express the uncertainty around the cost/effectiveness ratio?
But doesn't this tend to 0 if we consider enough samples? (N very large)
I think most people make this assumption. If that's all you mean by convex optimization then I think current heuristics are optimizing. In particular, "donate to givewell top charities until something is more cost effective than them" is basically using concavity of the cost effectiveness function.
re: the topic being fairly obvious, apparently other comments think it's not obvious or even completely wrong, you might want to have a look at the discussion
Why would it be convex? Many opportunities have diminishing returns, which if I understand correctly would make the problem non-convex? E.g. the log(cash) example in the post
It is an optimisation problem, that's for sure 😅
I heard people model giving as a knapsack problem, considering choosing yes/no for fixed-sized grant applications, but I can't find anything about it on the forum and I don't know if it's particularly useful.
I agree that the idea in this post is fairly obvious to people who have some knowledge of statistics (but not to people like me who last thought about stats many years ago). I'm a bit annoyed that I can't answer the final two questions myself :/
Do you have any ideas?
If opportunities have consistently diminishing returns (i.e. the second derivative is negative), then it's convex. Giving opportunities may or may not actually be convex.
This is the third in a sequence of posts taken from my recent report: Why Did Environmentalism Become Partisan?
Summary
Rising partisanship did not make environmentalism more popular or politically effective. Instead, it saw flat or falling overall public opinion, fewer major legislative achievements, and fluctuating executive actions.
Public Opinion...
This post presents the executive summary from Giving What We Can’s impact evaluation for 2025. At the end of this post we share links to more information, including the full report and...
The "mean" cost-effectiveness of interventions with uncertain impact can be misleading, sometimes significantly. We usually want to consider mean(effectcost), not mean(costeffect).[1]
Note: I'm pretty confident about the main claim, but still confused about the details. I end the post with some questions.
Minimal extreme example:
Let's say that you have a magical intervention that has:
33% of saving 1 life
33% of saving 100 lives
33% of saving 199 lives
For the known cost of $10,000. It would be an amazing intervention! If you run hundreds of similar interventions, you can save lives with cost-effectiveness of $100/life: the expected value is 100 lives saved, and the cost is always $10,000.
Looking at the 5th and 95th percentile helps in many cases, but not in scenarios where there is a very small probability of very high effects and a significant probability of small effects. Minimal Guesstimate example with 4.8% of saving 1000 lives and 95.2% of saving 1 life.
Some practical examples of very small chances of huge value might be deworming or policy interventions. For those, mean(cost/effect) and mean(cost)/mean(effect) might differ by orders of magnitude.
Consider looking at the value per dollar (or per $1,000, or per $100,000 like GiveWell) instead of dollars per unit of value, so the denominator is constant. The minimal example would become https://www.getguesstimate.com/models/20682 My view is that this is useful also because huge uncertainties in costs are rare.
How can we express the uncertainty around cost/effectiveness if the ratio distribution is hard to reason about and has misleading moments?
How could the UI in guesstimate or some potential alternative indicate to the user when to use mean(f(distribution)) and when to use f(mean(distribution)) for nonlinear functions, to prevent people from making this very common mistake? We might want to use the former for e.g. the value of cash transfers effect=∑k⋅log(cash)→mean(effect)=mean(k⋅log(cash))≠k⋅log(mean(cash))
Really curious to know if anyone has ideas!
Late 2023 Appendix: why not mean(cost)/mean(effect)?
The first versions of this post argued for using mean(cost)/mean(effect), based on the reasoning that if we have an intervention that is certain to save 1 life and has:
33% of costing $10
33% of costing $1,000
33% of costing $1,990
If you commit to funding it entirely to run once, your expected costs are:
mean($10,$1000,$1990)=$1000, so your expected cost-effectiveness would be 1 life saved per $1,000.
This is wrong because in practice a better model is almost always that you give a fixed amount, instead of funding the intervention whatever cost it might take.
Let's say you give $10 to the intervention above. Then you have 33% of saving 1 life and 66% of saving 0 lives, which is a cost-effectiveness of 1 life per 30$. Very different from $1,000!
To be more precise in a common scenario, let's consider the case where this magical intervention can be run multiple times, and you give $6,000. You have:
33% of running it 600 times ($6,000 / $10)
33% of running it 6 times ($6,000 / $1,000)
33% of running it ~3.015 times ($6,000 / $1,990)
For an average of ~203.015 lives saved per $6,000 so ~$29.554/life.
Note that if you instead commit to giving $6,000 to multiple different interventions that each run once and save 1 life; 33% of which cost $10, 33% of which cost $1,000, and 33% of which cost $1,990; the situation is very different! You would end up funding 2 of each before running out of money, saving 6 lives, and you would have an expected cost of $1,000 per life. This comment probably explains this better, starting from the initial "minimal extreme example" above.
Huge thanks to Sam Nolan, Justis Mills, and many others for fleshing out the main idea, editing, and correcting mistakes. I'd especially like to thank the authors of the comments below for pointing out the major mistakes in the first versions of this post and adding many useful considerations.
2023 Edit: A previous version of this post argued for using mean(cost)/mean(effect). I now think that the top comments are right and I was wrong: we almost always want to use mean(effectcost) (or its inverse). I've edited the rest of the post to make it more useful and added an appendix (which might still be wrong). I think it often doesn't change the core conclusion as costs rarely vary by orders of magnitude.
Edit: this used to say "Underestimating the actual effectiveness by a factor of 34". But I don't think that one value is more "actual" than the other, just much more useful.


I could be missing something but this sounds wrong to me. I think the actual objective is
mean(effect / cost).effect / costis the thing you care about, and if you're uncertain, you should take the expectation over the thing you care about.mean(cost / effect)can give the wrong answer because it's the reciprocal of what you care about.mean(cost) / mean(effect)is also wrong unless you have a constant cost. Consider for simplicity a case of constant effect of 1 life saved, and where the cost could be $10, $1000, or $10,000.mean(cost) / mean(effect)= $3670 per life saved, but the correct answer is 0.0337 lives saved per dollar = $29.67 per life saved.Coming back to this a year later, I wanted to thank you for this comment! It took me an embarrassingly long time to realize I was wrong about this, but I was! I've now edited the post.
If any new reader is confused by the comments pointing out this mistake, see footnote 1 and the appendix above.
Ok, so say you have a fixed budget. Then you want to maximise mean(total effect), which is equal to mean(budget/cost * unit effect)
... I agree.
Also, infinite expected values come from having some chance of doing the thing an infinite number of times, where the problem is clearly the assumption that the effect is equal to budget/cost * unit effect when this is actually true only in the limit of small numbers of additional interventions.
Also, Lorenzo's proposal is ok when cost and effect are independent, while the error he identifies is still an error in this case.
The below is a reply to a previous version of the above comment.
I do not think we want to maximise mean("effect" - "cost").
Note "effect" and "cost" have different units, so they cannot be combined in that way. "Effect" refers to the outcome, whereas "cost" corresponds to the amount of resources we have to spend.
One might want to include "-cost" due to the desire of accounting for the counterfactual, but this is supposed to be included in "effect" = "factual effect" - "counterfactual effect".
We want to maximise mean("effect") for "cost" <= "maximum cost" (see this comment).
Yeah, I was mentally substituting "effect" for "good" and "cost" for "bad"
This was very common feedback, I should have added a section on it!
I disagree though. I think your example is perfect, with a denominator that spans many orders of magnitude
I disagree, let's say you have N interventions with that distribution of costs and effects and you fund all of them.
The total cost/effect would be ∑costi∑effecti=N⋅mean(cost)N⋅1=mean(cost)≈$3670
As an example, let's say you have three interventions with that distribution, and they turn out to be perfectly distributed, you have
total cost=$11,010 and total effect=3 lives so, as a funder that cares about expected value, $3670 is the value you care about.
https://docs.google.com/spreadsheets/d/1yfK7J5V4rBUQ7-lWKrdXDNyI3NYjRouub4KwO2PVkuQ/edit?usp=sharing here is a spreadsheet with 100 cases.
Not sure how useful it is as an intuition pump, but here is an even more extreme/absurd example: if there is a 0.001% chance that the cost is 0 and a 99.999% chance that the cost is $1T, mean(effect/cost) would be ∞, even if the effect is super tiny, which is definitely not what we care about.
In general, as JoelMcGuire mentioned, it's "a general issue where your simulation involves ratios", taking the other ratio helps only insofar as it prevents the denominator from spanning as many orders of magnitude.
Does this make sense? Is there a better way to write it? Is it completely wrong?
In general, I think we don't care about the mean of X/Y, (that indeed can be dominated by cases where Y is really tiny), but about the expected total X / Y.
That's true if you spend money that way, but why would you spend money that way? Why would you spend less on the interventions that are more cost-effective? It makes more sense to spend a fixed budget. Given a 1/3 chance that the cost per life saved is $10, $1000, or $10,000, and you spend $29.67, then you save 1 life in expectation (= 1/3 * (29.67 / 10 + 29.67 / 1000 + 29.67 / 10,000)).
That's a feature, not a bug. If something has positive value and zero cost, then you should spend zero dollars/resources to invoke the effect infinitely many times and produce infinite value (with probability 0.00001).
I agree a non-null probability of null cost implies infinite mean cost-effectiveness (mean ratio between effect and cost). However:
I think one should refer to "effect"/"cost" as cost-effectiveness, since more cost-effective interventions have greater ratios between the effect and cost.
Yeah, it's a very theoretical example.
There are things that could be modeled as very very low cost, like choosing A instead of B where both A and B cost $10, but indeed let's focus on the other example.
Using "effect"/"cost" helps in many cases, but definitely not in all.
E.g. for policy intervention estimates of costs can vary by orders of magnitude: see https://forum.effectivealtruism.org/posts/h2N9qEbvQ6RHABcae/a-critical-review-of-open-philanthropy-s-bet-on-criminal?commentId=NajaYiQD7KhAJyBcp
I think we care about the expected marginal cost-effectiveness (i.e. mean("marginal effect"/"marginal cost")). Both mean("total effect")/mean("total cost") and mean("total effect"/"total cost") are good approximations if our budget is small, but they might not be if the budget has to be large for some reason.
Haha, I came up with that example as well. You're thinking about this in the same way I did!
I think to say that one is the "actual objective" is not very rigorous. Although I'm saying this from a place of making that same argument. It does answer a valid question of "how much money should one donate to get an expected 1 unit of good" (which is also really easy to communicate, dollars per life saved is much easier to talk about than lives saved per dollar). I've been thinking about it for a while and put a comment under Edo Arad's one.
As for the second point about simple going E(cost)E(effect). I agree that this is likely an error, and you have a good counterexample.
I still don't think it's an error, added a comment with my perspective, curious to hear your thoughts!
Indeed it was common feedback, but I don't understand it fully, maybe we add a section on it to the post if we reach an agreement.