TL;DR:
The "mean" cost-effectiveness of interventions with uncertain impact can be misleading, sometimes significantly.
We usually want to consider , not .[1]
Note: I'm pretty confident about the main claim, but still confused about the details. I end the post with some questions.
Minimal extreme example:
Let's say that you have a magical intervention that has:
- 33% of saving 1 life
- 33% of saving 100 lives
- 33% of saving 199 lives
For the known cost of $10,000.
It would be an amazing intervention! If you run hundreds of similar interventions, you can save lives with cost-effectiveness of $100/life: the expected value is 100 lives saved, and the cost is always $10,000.
But here is what happens if you model it in Guesstimate:

You get $3,400 mean cost per life! Changing the useful value by a factor of 34![2]
This is obvious in hindsight: since Guesstimate shows the "mean" cost-effectiveness
instead of what we care about, which is:
Looking at the 5th and 95th percentile helps in many cases, but not in scenarios where there is a very small probability of very high effects and a significant probability of small effects. Minimal Guesstimate example with 4.8% of saving 1000 lives and 95.2% of saving 1 life.
Some practical examples of very small chances of huge value might be deworming or policy interventions. For those, mean(cost/effect) and mean(cost)/mean(effect) might differ by orders of magnitude.
Three recent examples:
- https://forum.effectivealtruism.org/posts/h2N9qEbvQ6RHABcae/a-critical-review-of-open-philanthropy-s-bet-on-criminal (search for "EDIT 22/06/2022:" in this post, it changes a result by an order of magnitude)
- https://forum.effectivealtruism.org/posts/RXm2mxvq3ReXmsHm4/ (in this case the difference is smaller, 54 vs 31, see https://colab.research.google.com/drive/1lnwjw2_zJHL4rBepw9yzAHQE0zL2ClDb?usp=sharing )
- https://forum.effectivealtruism.org/posts/9iBpokRpoJ2xspfnb/estimating-the-cost-effectiveness-of-scientific-research (19 vs 12, see https://colab.research.google.com/drive/1B_jnFGeUB_2fV7XR942QKJ_xyGMzvGMz?usp=sharing )
Possible solutions and mitigations:
- Consider looking at the value per dollar (or per $1,000, or per $100,000 like GiveWell) instead of dollars per unit of value, so the denominator is constant. The minimal example would become https://www.getguesstimate.com/models/20682
My view is that this is useful also because huge uncertainties in costs are rare. - What's mentioned in this comment
Some questions I still have:
- How can we express the uncertainty around cost/effectiveness if the ratio distribution is hard to reason about and has misleading moments?
- How could the UI in guesstimate or some potential alternative indicate to the user when to use and when to use for nonlinear functions, to prevent people from making this very common mistake?
We might want to use the former for e.g. the value of cash transfers
Really curious to know if anyone has ideas!
Late 2023 Appendix: why not ?
The first versions of this post argued for using , based on the reasoning that if we have an intervention that is certain to save 1 life and has:
- 33% of costing $10
- 33% of costing $1,000
- 33% of costing $1,990
If you commit to funding it entirely to run once, your expected costs are:
, so your expected cost-effectiveness would be 1 life saved per $1,000.
This is wrong because in practice a better model is almost always that you give a fixed amount, instead of funding the intervention whatever cost it might take.
Let's say you give $10 to the intervention above. Then you have 33% of saving 1 life and 66% of saving 0 lives, which is a cost-effectiveness of 1 life per 30$. Very different from $1,000!
To be more precise in a common scenario, let's consider the case where this magical intervention can be run multiple times, and you give $6,000. You have:
- 33% of running it 600 times ($6,000 / $10)
- 33% of running it 6 times ($6,000 / $1,000)
- 33% of running it ~3.015 times ($6,000 / $1,990)
For an average of ~203.015 lives saved per $6,000 so ~$29.554/life.
Note that if you instead commit to giving $6,000 to multiple different interventions that each run once and save 1 life; 33% of which cost $10, 33% of which cost $1,000, and 33% of which cost $1,990; the situation is very different! You would end up funding 2 of each before running out of money, saving 6 lives, and you would have an expected cost of $1,000 per life. This comment probably explains this better, starting from the initial "minimal extreme example" above.
Huge thanks to Sam Nolan, Justis Mills, and many others for fleshing out the main idea, editing, and correcting mistakes. I'd especially like to thank the authors of the comments below for pointing out the major mistakes in the first versions of this post and adding many useful considerations.
This work is licensed under a Creative Commons Attribution 4.0 International License.
- ^
2023 Edit: A previous version of this post argued for using . I now think that the top comments are right and I was wrong: we almost always want to use (or its inverse). I've edited the rest of the post to make it more useful and added an appendix (which might still be wrong). I think it often doesn't change the core conclusion as costs rarely vary by orders of magnitude.
- ^
Edit: this used to say "Underestimating the actual effectiveness by a factor of 34". But I don't think that one value is more "actual" than the other, just much more useful.
Thanks for raising this question! Following other comment, I find the use of mean(cost)mean(effect) somewhat unsatisfactory.
Perhaps some of the confusion could be reduced by i) taking into account the number of interventions and ii) distinguishing the following two situations:
1. Epistemic uncertainty: the magic intervention will always save 1 life, or always save 100 lives, or always save 199 lives, we just don't know. In this case, one can repeat the intervention as many times as one wants, the expected cost-effectiveness will remain ~$3,400/life.
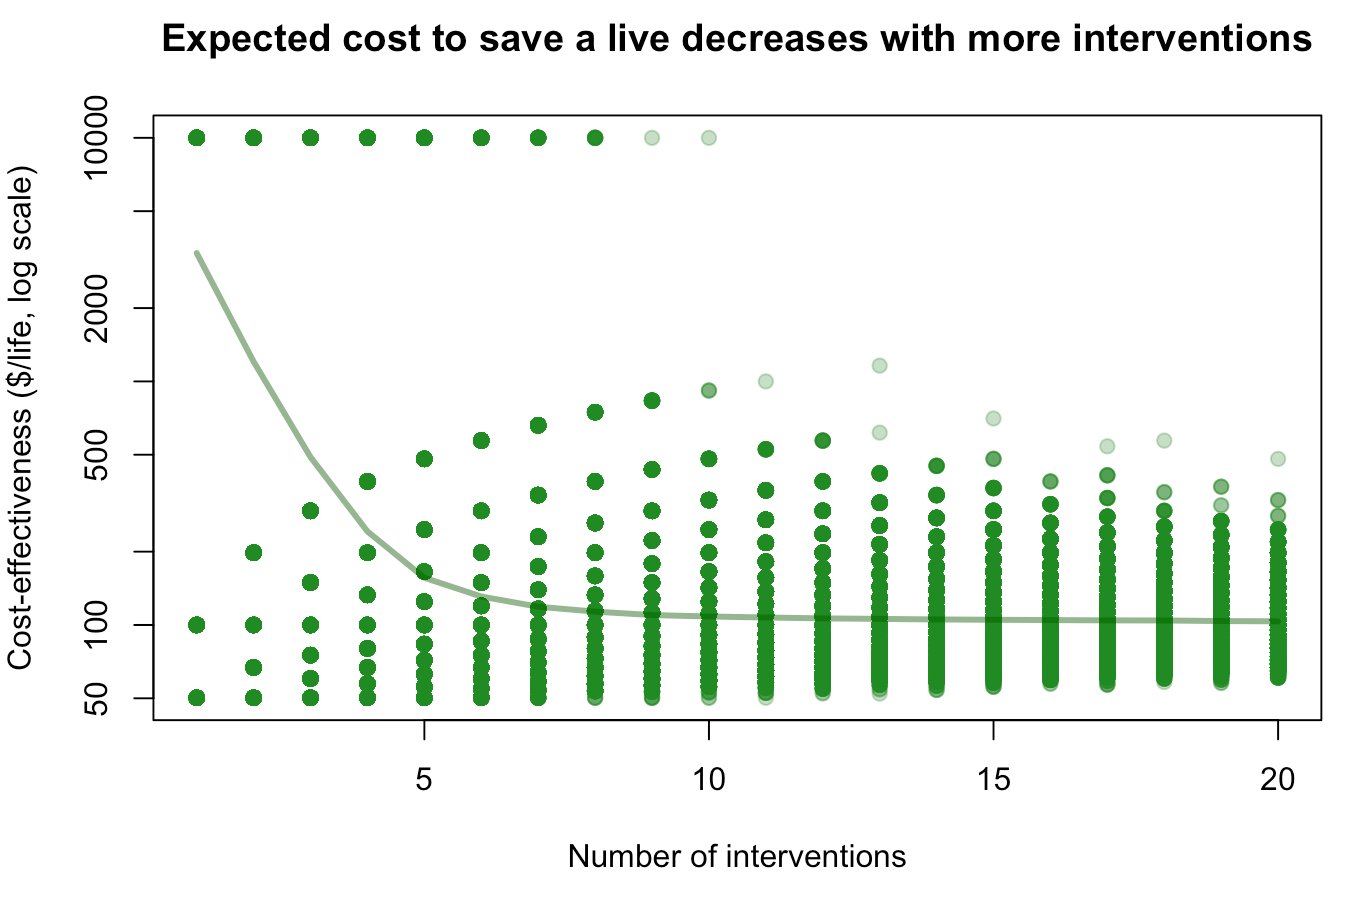
2. True randomness: sometimes the magic intervention will save 1 life, sometimes 100 lives, sometimes 199 lives. What happens then if you repeat it n times? If n=1, your expectation is still ~$3400/life (tail risk of a single life saved). But the more interventions you do, the more you converge to a combined cost-effectiveness $100/life (see figure below), because failed interventions will probably be compensated by very successful ones.
(R code to reproduce the plot :
X <- sample(1:20,1000000, replace=T) ; Y <- sapply(X,function(n)mean(10000*n/sum(sample(c(1,100,199), n, replace = T)))) ; plot(X, Y, log="y", pch=19, col=alpha("forestgreen", 0.3), xlab="Number of interventions", ylab="Cost-effectiveness ($/life, log scale)", main="Expected cost to save a live decreases with more interventions") ; lines(sort(unique(X)), sapply(sort(unique(X)), function(x)mean(Y[X==x])), lwd=3, col=alpha("darkgreen",0.5)))I'm not sure how to translate this into practice, especially since you can consider EA interventions as a portfolio even if you don't repeat the intervention 10 times yourself. But do you find this framing useful?
Thanks so much for writing this! I understood it much better than other comments.
I do! Especially the "epistemic uncertainty" vs "true randomness" framing I think is the core of the misunderstanding, I think we're usually in the second scenario (and funding lots of different interventions), but indeed it was a very implicit assumption!
Edit: you might be interested in this https://en.wikipedia.org/wiki/Ratio_estimator#Statistical_properties linked in another comment, for a formalization of the sample bias shown in the plot