Epistemic status: Conscious of the limitations of the data, and conscious that our estimates are full of noise, I would really like for this to be replicated by the annual EA Survey organized by Rethink Charity. Point estimates should not be taken at face value; the standard deviations are large and reported for a reason.
Credit: Danica Willbanks created and carried out the survey, with the help of several EA Spain members, including myself. She also provided some suggestions for which regressions to run. Jaime Sevilla has provided good mentorship in general, and light editing work in particular. Any mistakes are mine alone.
Abstract
Using data from a 303 person survey of effective altruists, we shed some light on the mental health of the EA community. In particular, we provide data and analysis relevant to providing mental health resources to effective altruists. We hope that this document contributes to a deep understanding of the subject area among people who need to f.ex. make funding decisions about the matter. Additionally, we hope it helps showcase our abilities as an analyst.
For a short summary:
Four most important results:
- More involvement in EA is positively, but not significantly, correlated with better mental health.
- Having a mental health condition is very strongly correlated with thinking that providing mental health resources to EAs is likely to be effective.
- The impact of mental conditions is large. Among our 303 respondents, 1 758 hours of work were lost because of mental illness in the two weeks previous to our survey, compared to 16 737 hours worked, and 1 899 hours missed because of other reasons.
- Providing information about already existing resources seems more promising than directly providing resources such as therapy.
Three most important actionables:
- Incorporate a mental health section to the annual EA Survey to figure out the extent of mental health selection effects in EA.
- Compile a list of mental health resources useful to EAs, and let EAs know it exists.
- Have someone from EA France write up how their Feeling Good reading group goes.
Index:
A. Questions asked by the survey
B. Exploratory plots.
C. Data Analysis
- Is the population which answered the survey representative of EA overall?
- Does EA have a mental health problem?
- Is more involvement with EA correlated with mental illness?
- Is being mentally ill predictive of answering yes to: "Do you think you could personally benefit from EA community mental health resources?"
- Is having a mental disorder, or thinking you could potentially benefit from mental health resources correlated with thinking that providing them is likely to be one of the most effective interventions available?
- When is an effective use of the EA Community's resources != the most effective intervention?
- How does further involvement in EA correlate with opinions on the value of mental health resources?
- How does productivity lost because of mental health problems correlate with opinions on the value of mental health resources (and vice versa)?
- How does mental health affect productivity, and how is this mediated by access to healthcare?
- 9.1. How does mental health affect productivity?
- 9.2. How is lost productivity mediated by treatment and access to treatment?
- 9.3. Correlation of the Work Productivity and Impairment Scale with mental health
- 9.4. Correlation of the Work Productivity and Impairment Scale with mental health, mediated by an index of access.
- 9.5 The impact of just providing information.
- 9.6 For completeness's sake: All the possible correlations impact ~ productivity
- How does access to mental health resources vary with a variety of factors?
- 10.1. By countries or continent.
- 10.2. By race/ethnicity.
- 10.3. By mental health
- 10.4. By age
- 10.5. By involvement in EA.
D. Crucial considerations for mental health in EA.
- Selection effects in EA.
- Do mental health problems stem from EA-specific beliefs?
- EA may not have a comparative advantage in providing mental health resources.
- EA France has something going on
- Visceral comparison with global poverty
- Moral hazard.
- Layers of indirectness and pathways to impact.
- A support group for EAs with ADHD
- Providing mental health resources is creepy
- Power law distribution
- Cheap resources.
A. Questions asked by the survey.
- (Timestamp.)
- I consent to the release of anonymized statistics & aggregated data
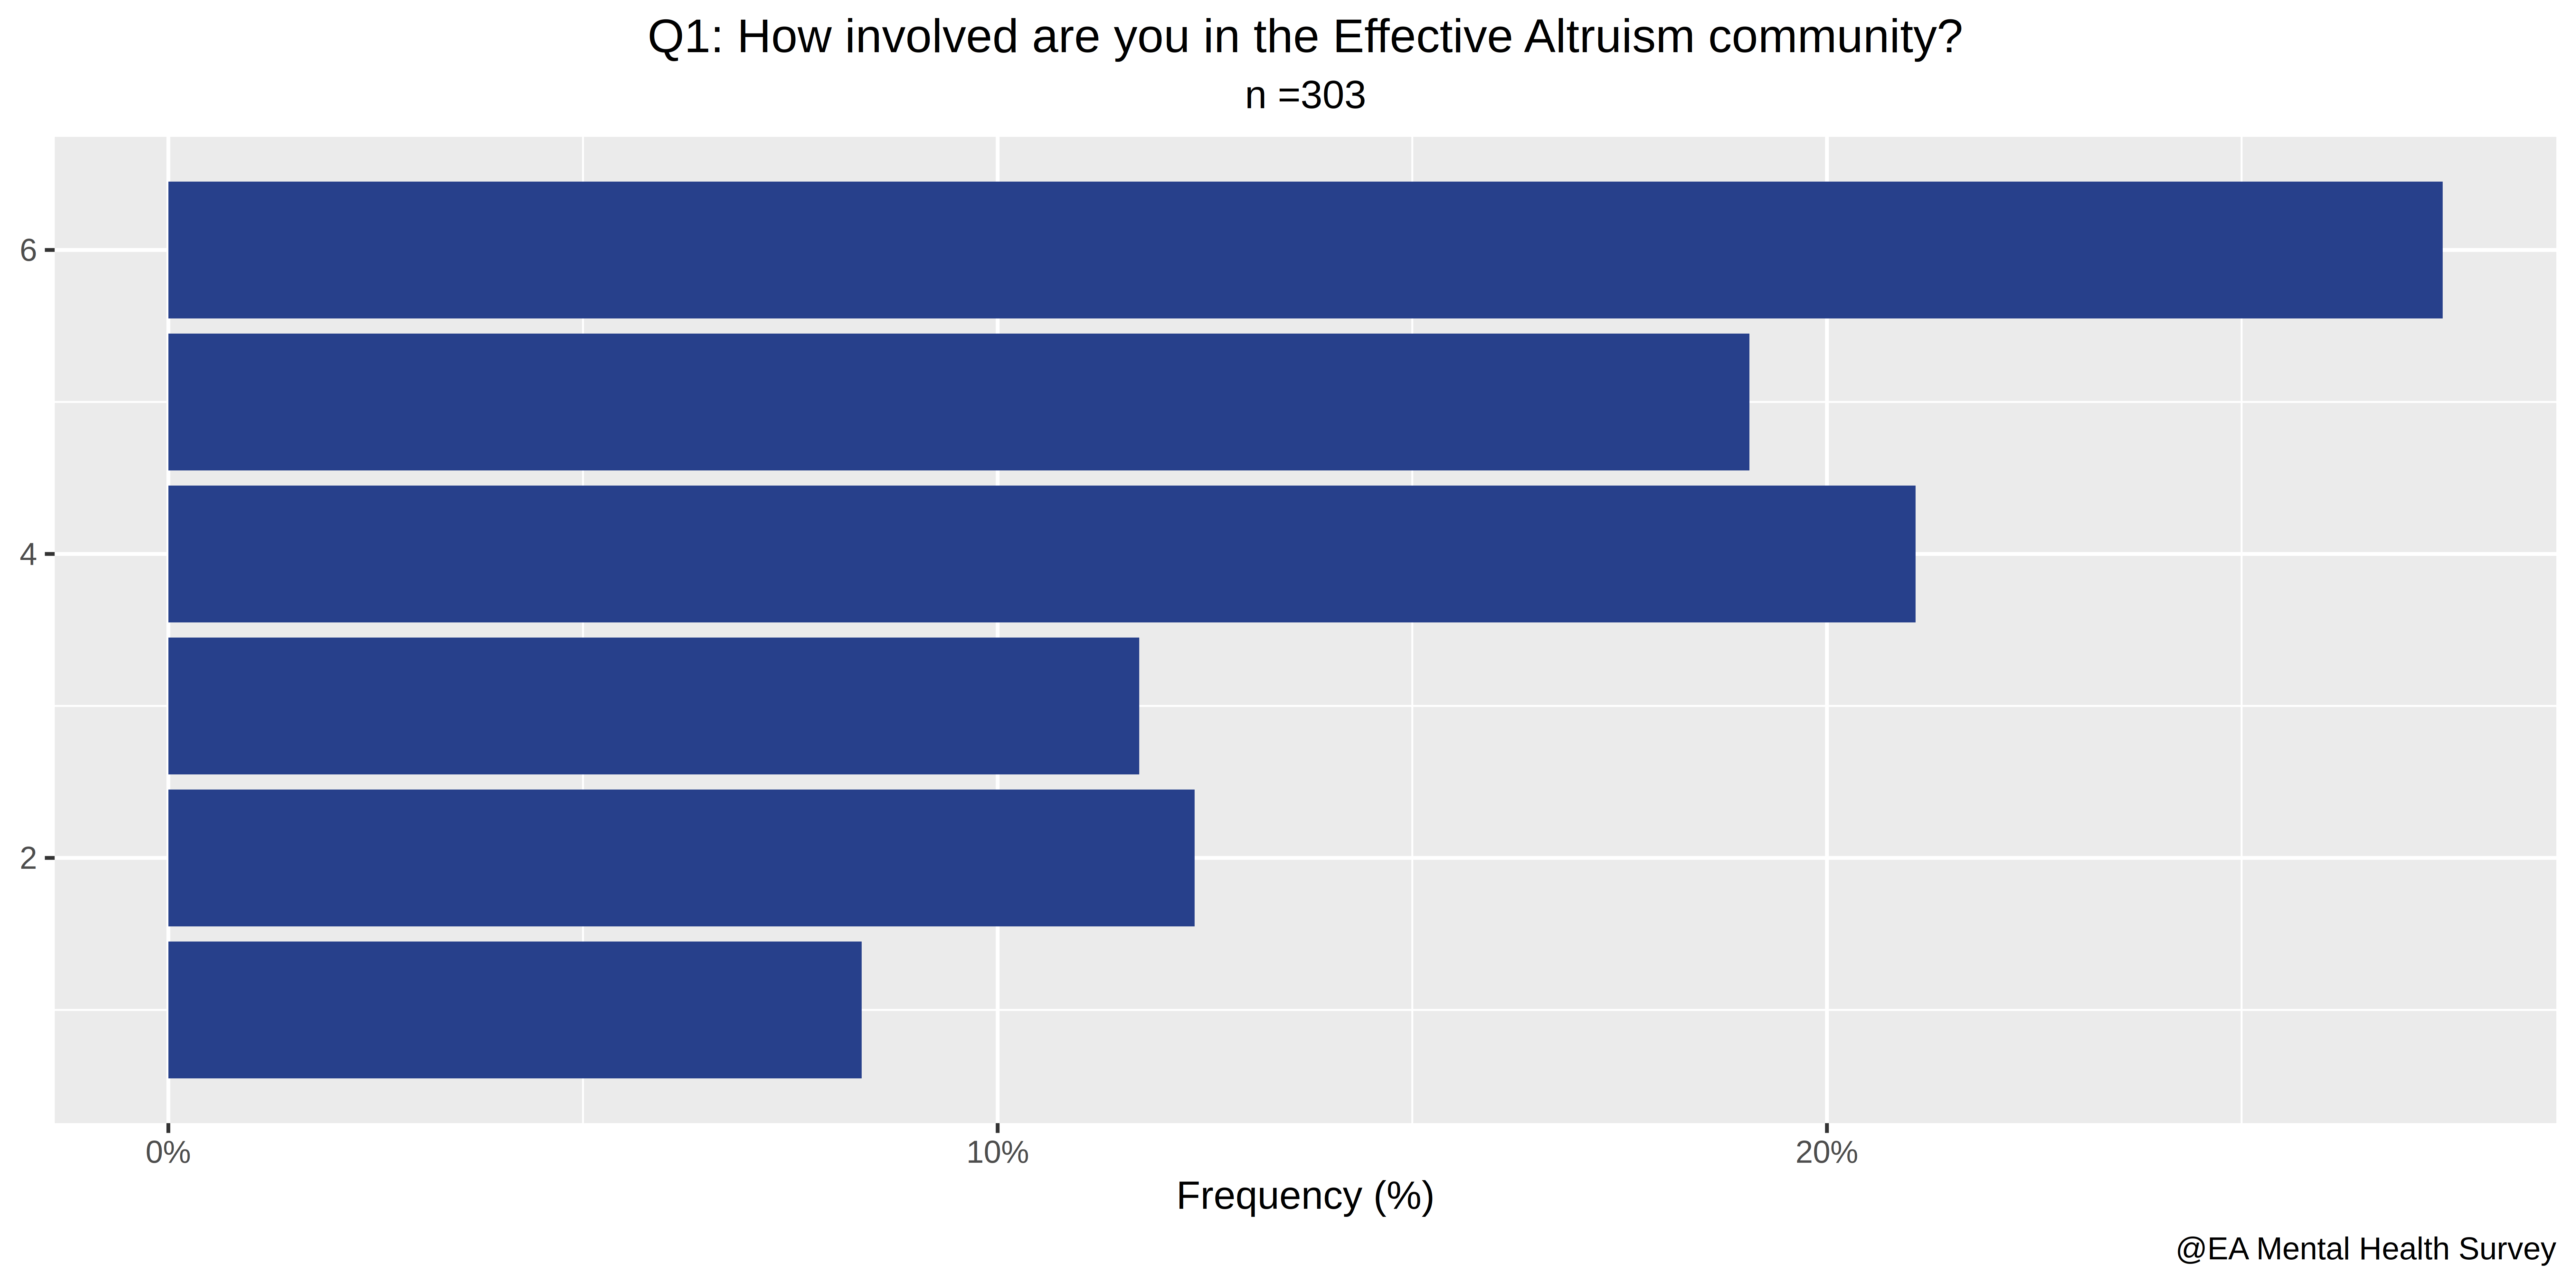
- How involved are you in the Effective Altruism Community?
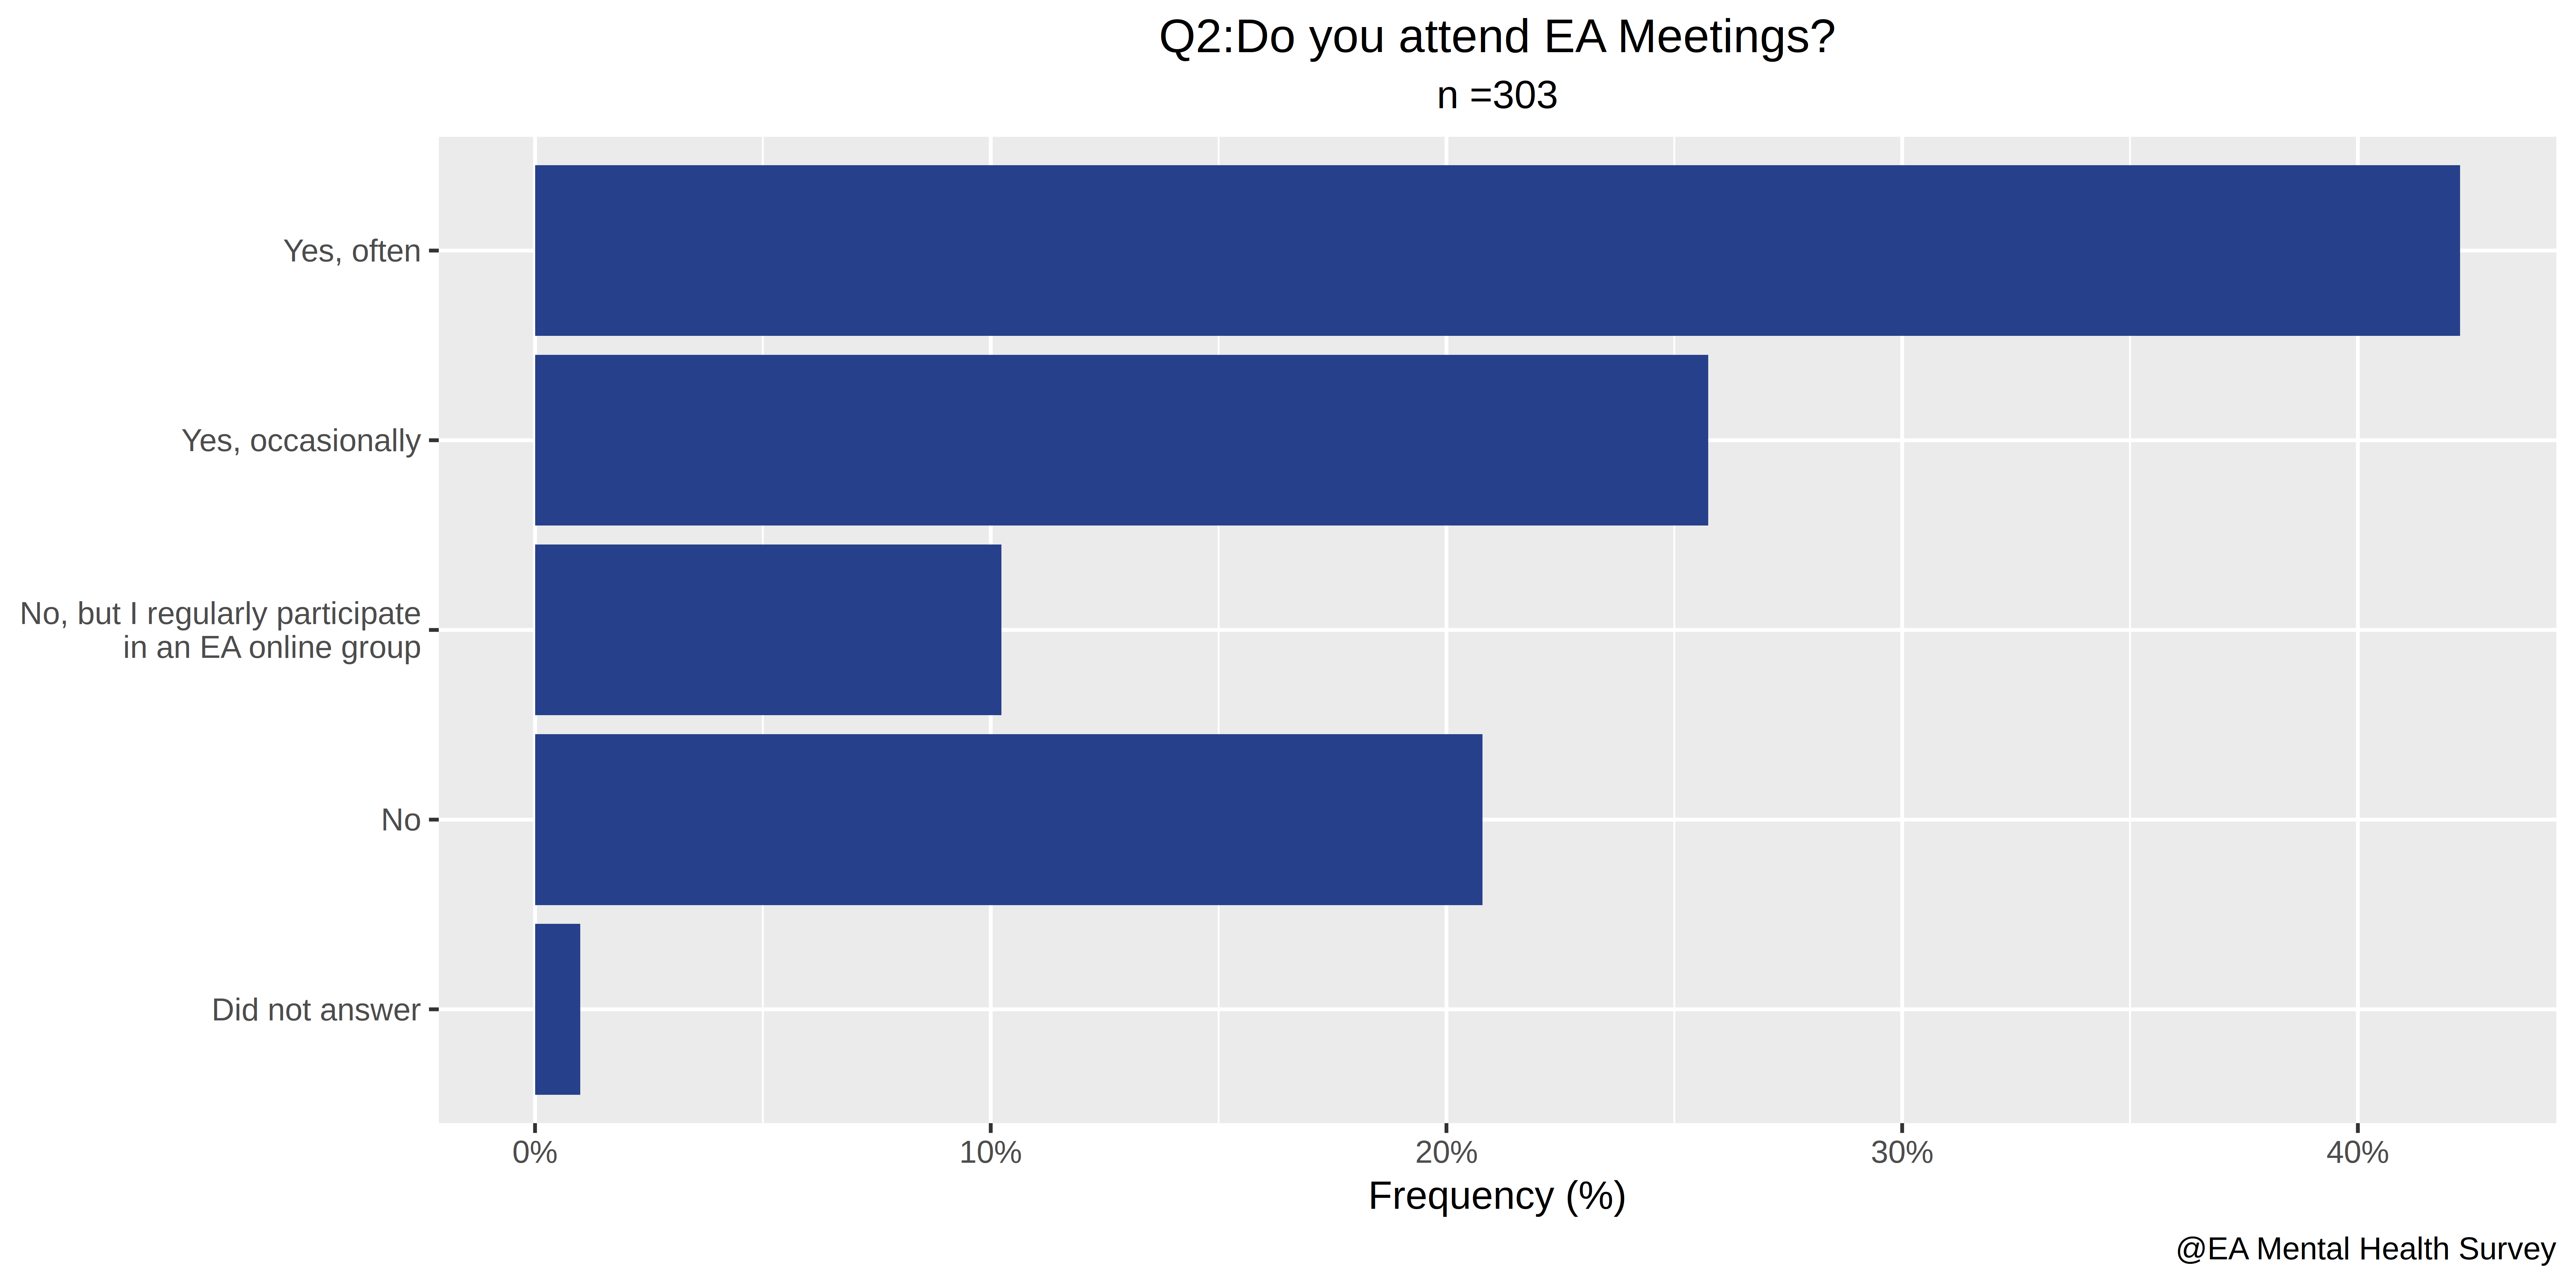
- Do you attend EA meetings?
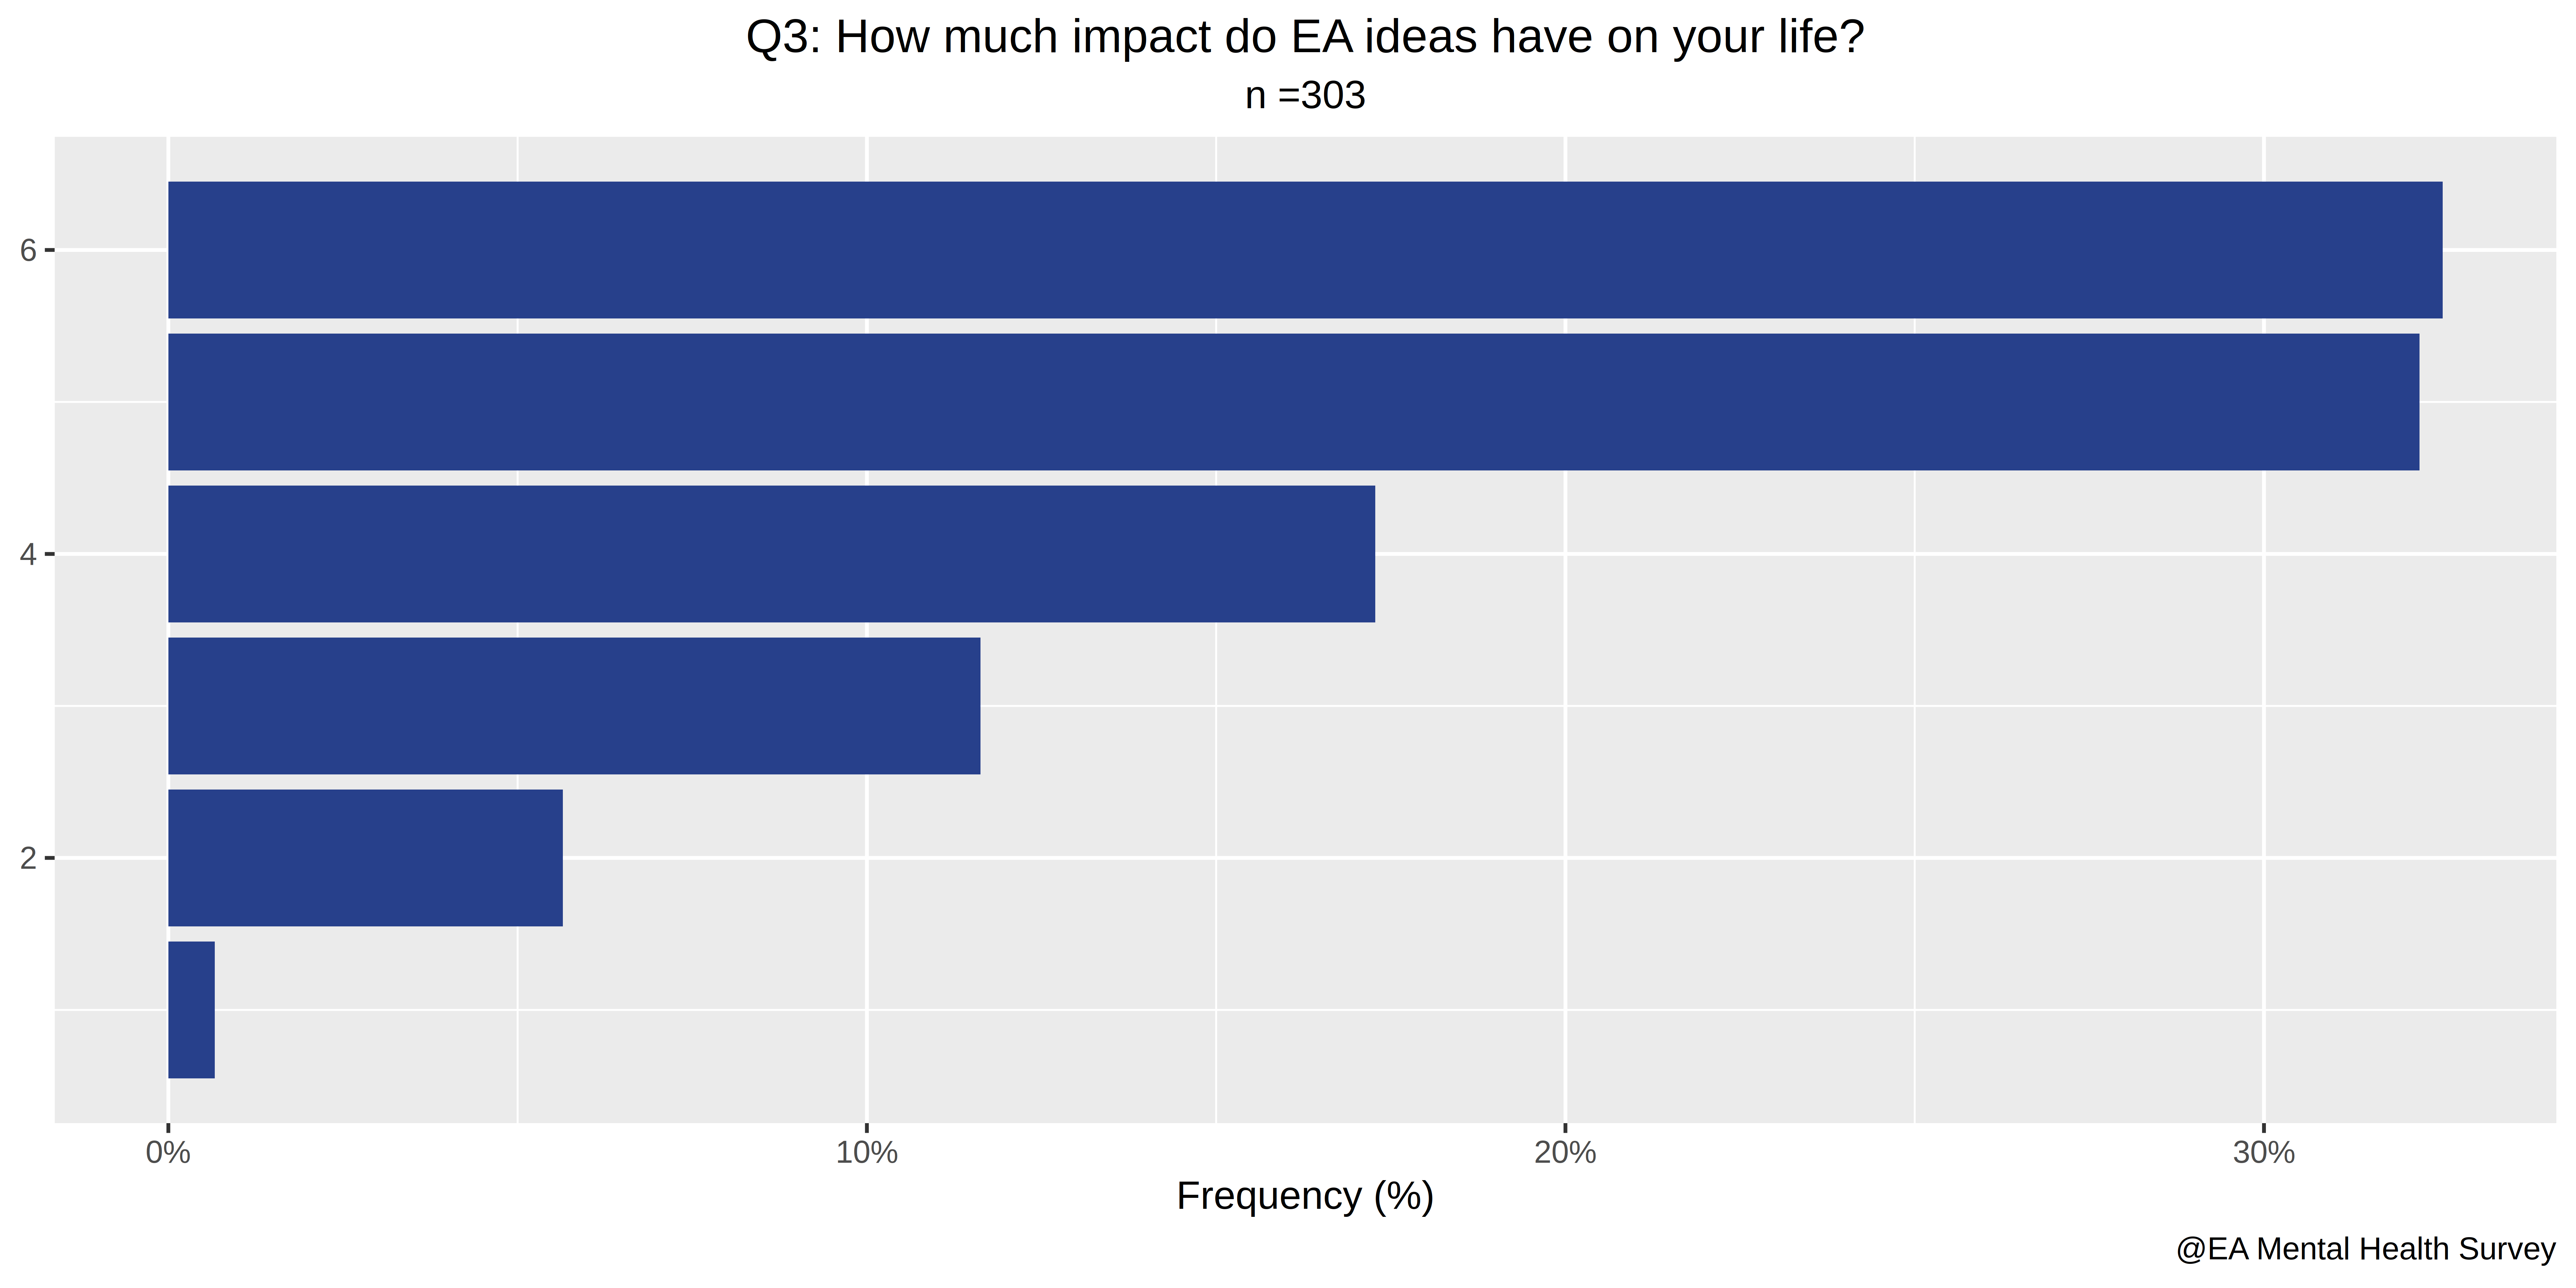
- How much impact do EA ideas have on your life?
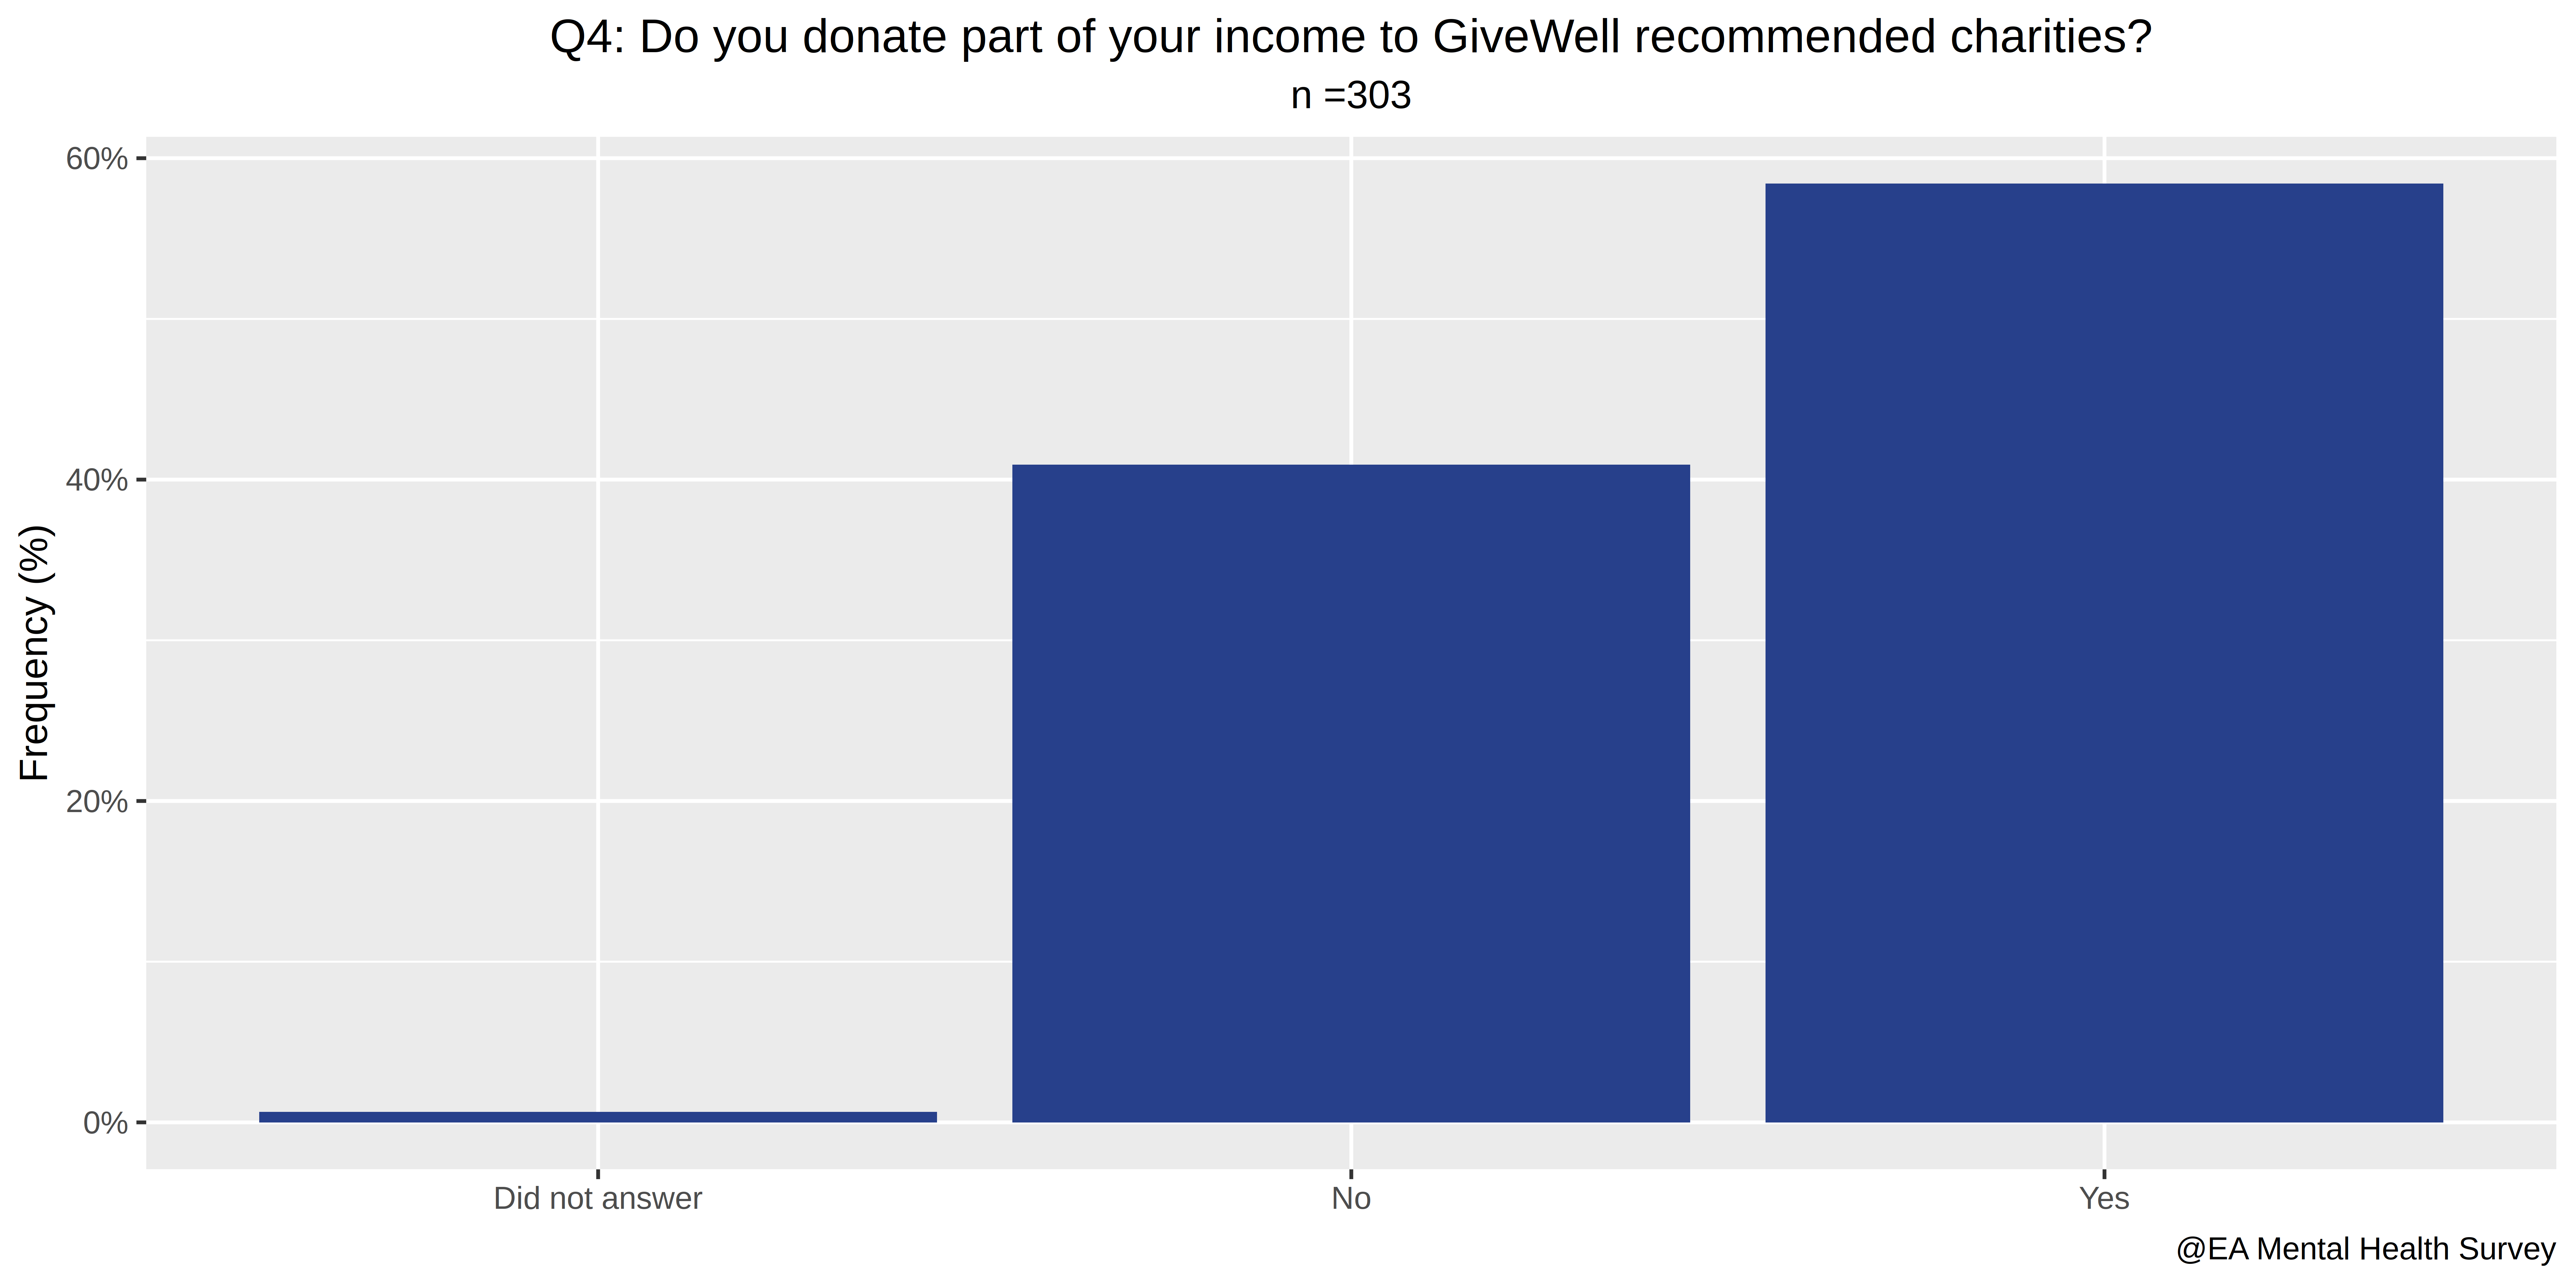
- Do you donate part of your income to GiveWell recommended charities?
- Which of these conditions have you been formally diagnosed with?
- Which of these conditions do you think you may have, but have never been formally diagnosed with?
- During the past 14 days, how many hours did you miss from work because of mental health problems?
- During the past 14 days, how many hours did you miss from work because of any other reason, such as vacation, other commitments, etc.?
- During the past 14 days, about how many hours did you actually work?
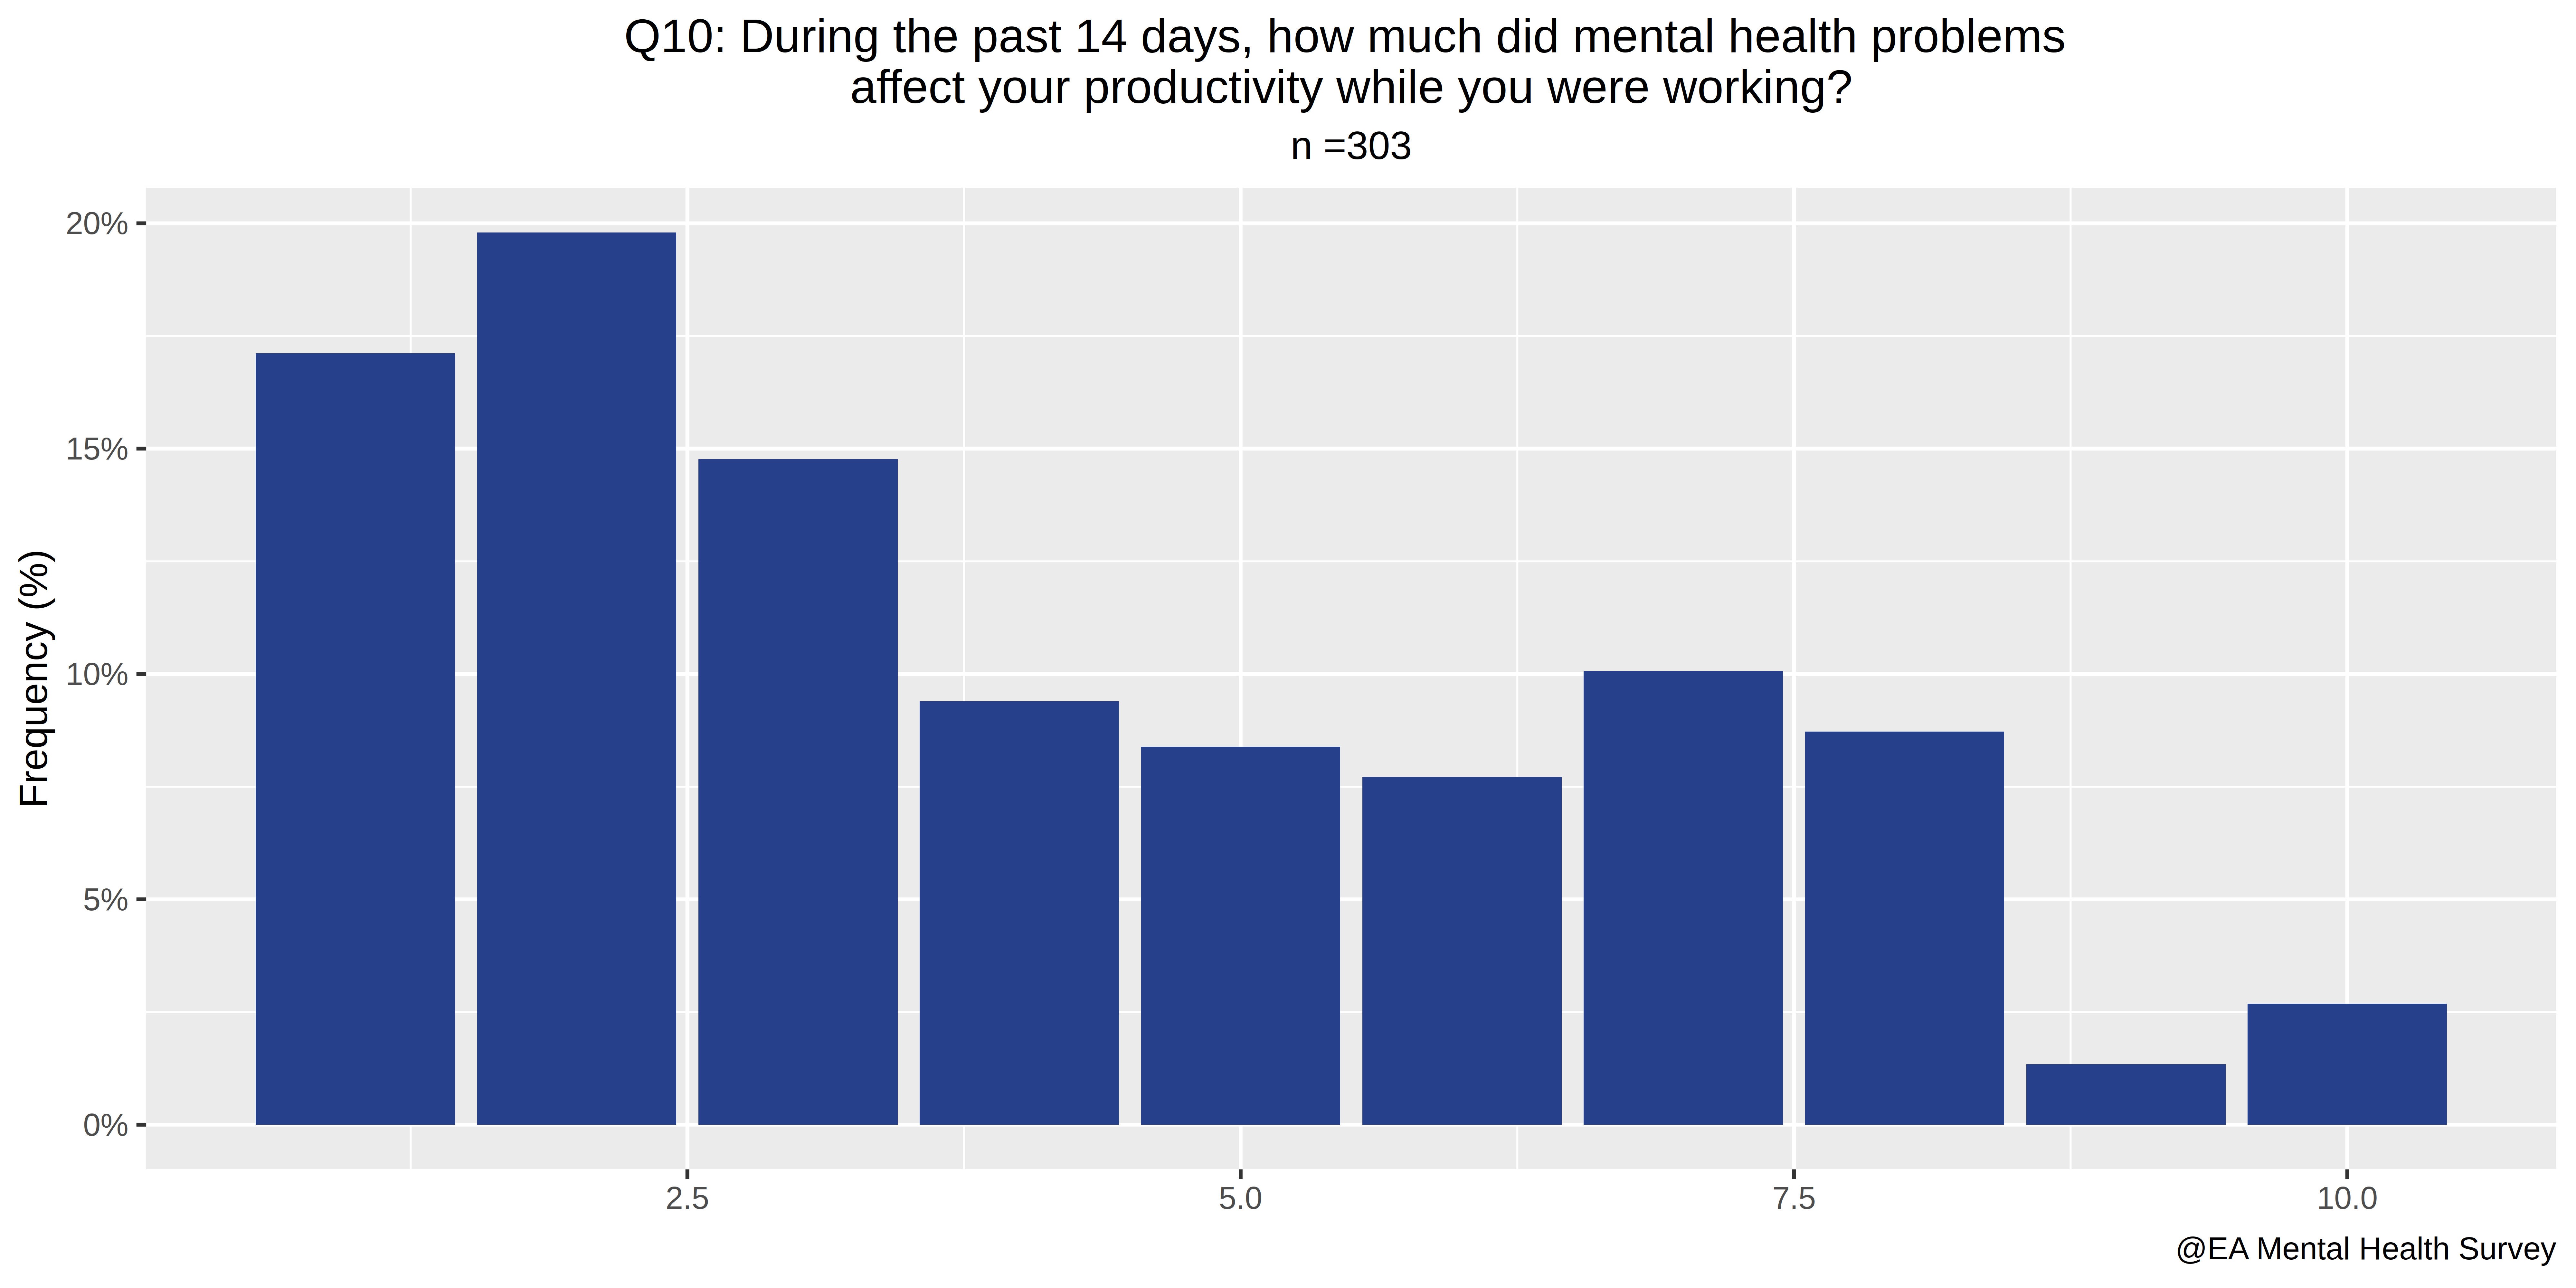
- During the past 14 days, how much did mental health problems affect your productivity while you were working?
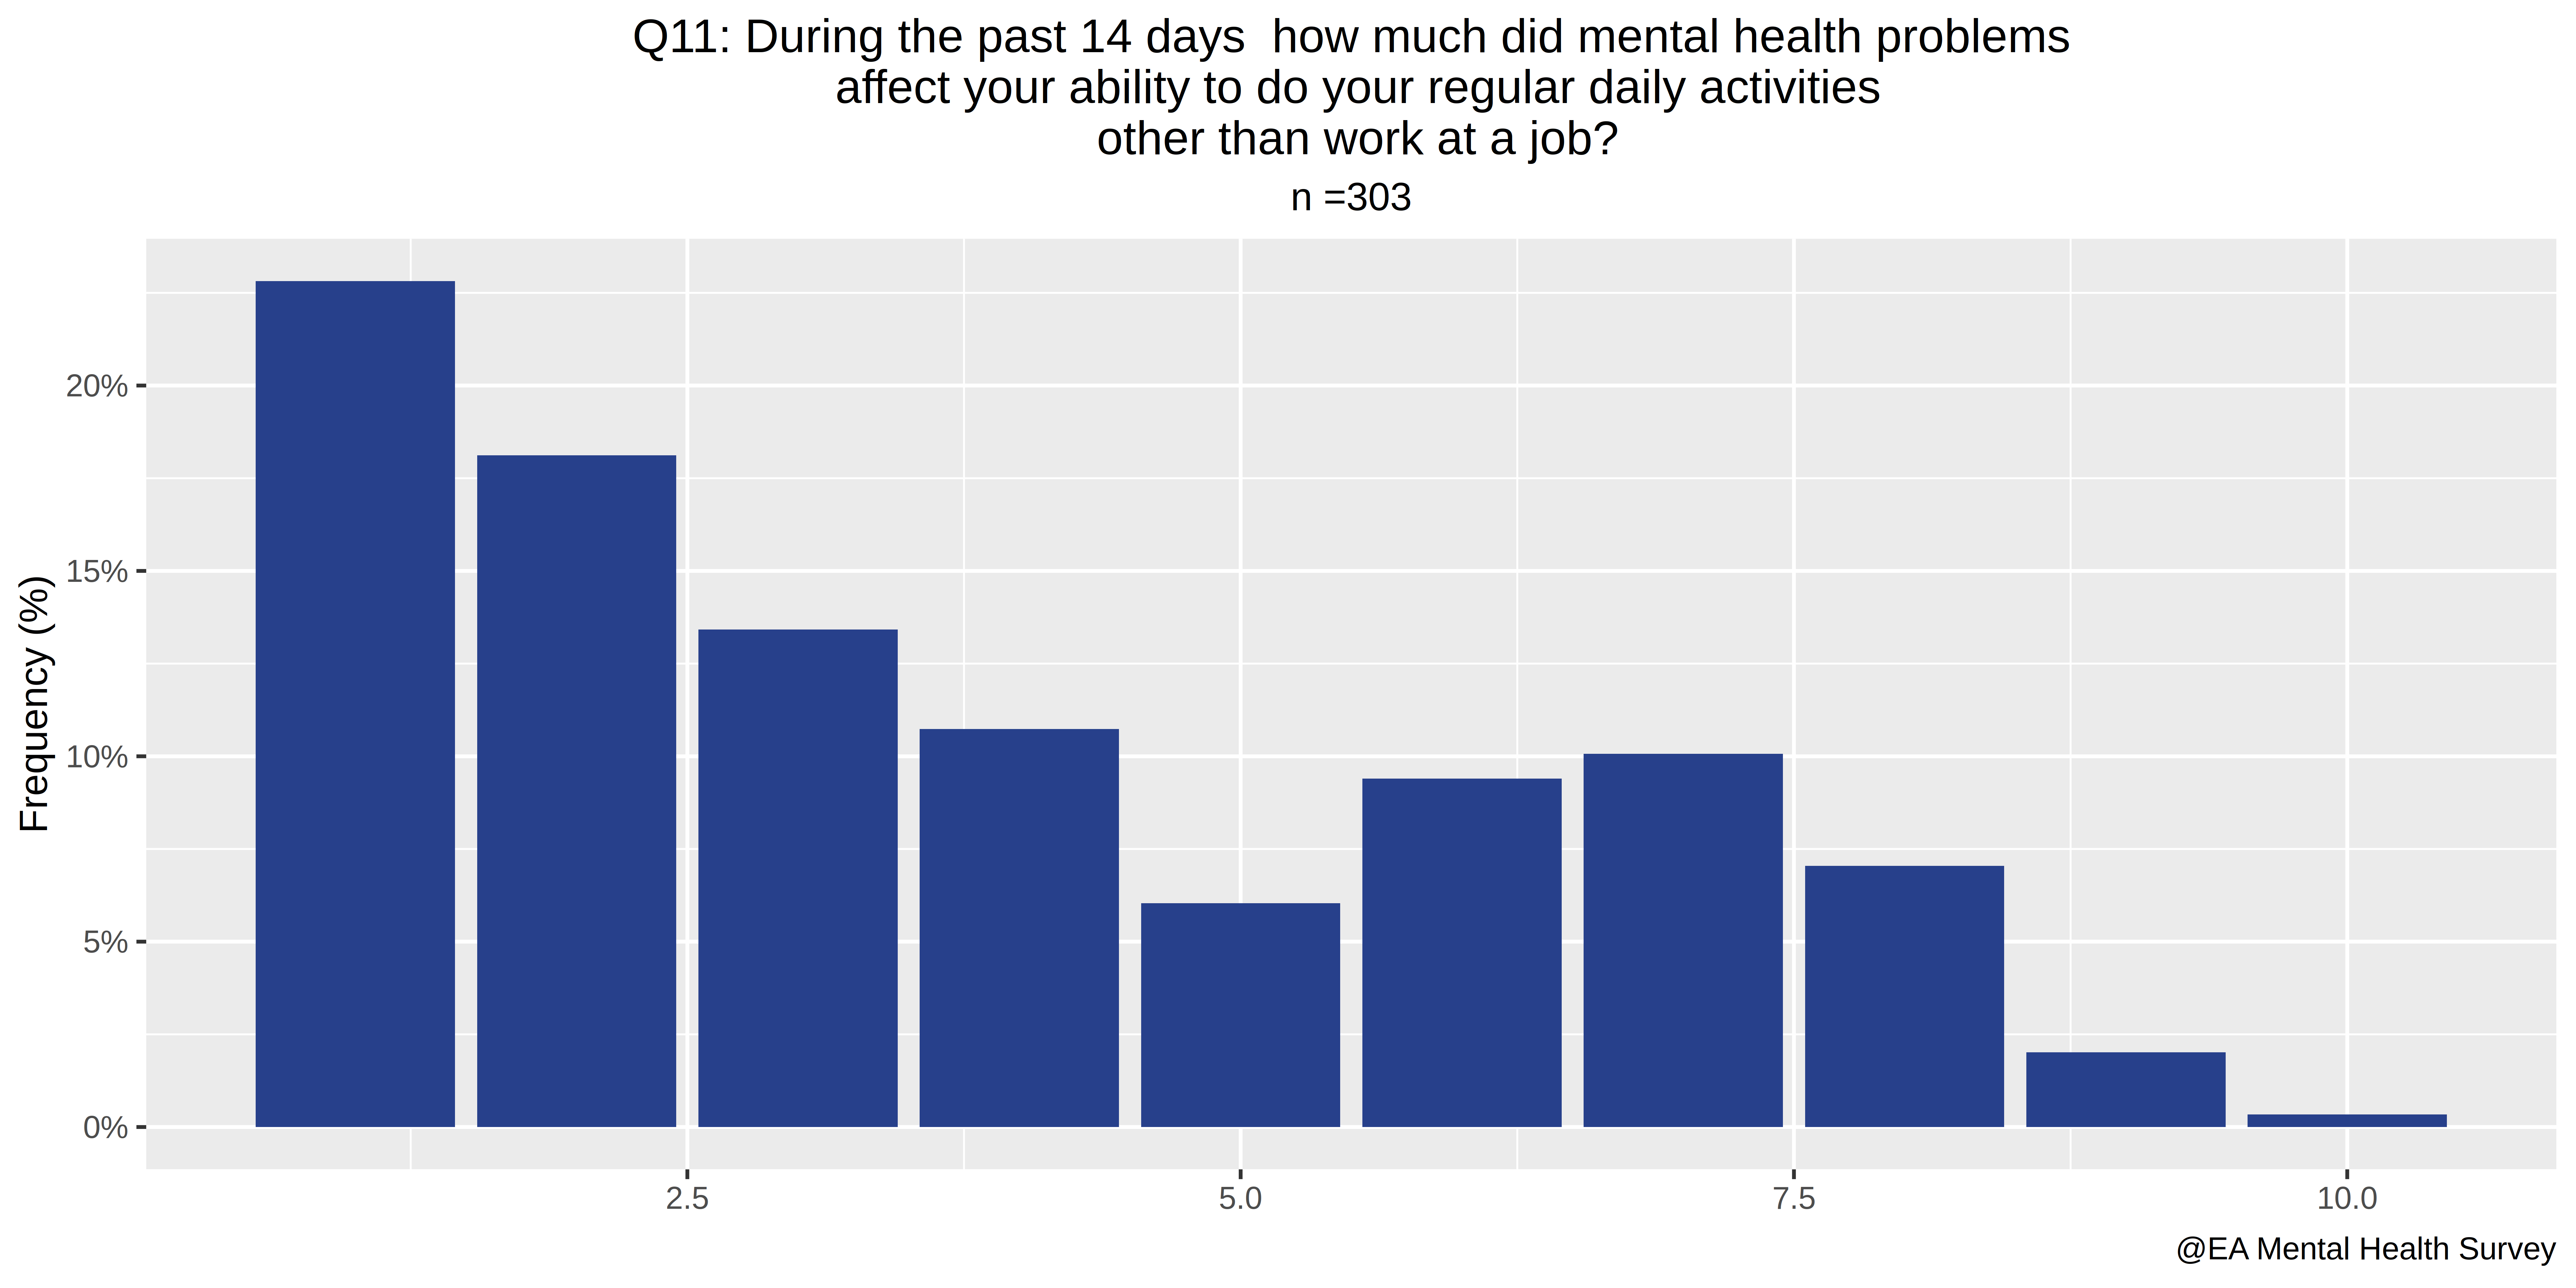
- During the past 14 days, how much did mental health problems affect your ability to do your regular daily activities, other than work at a job?
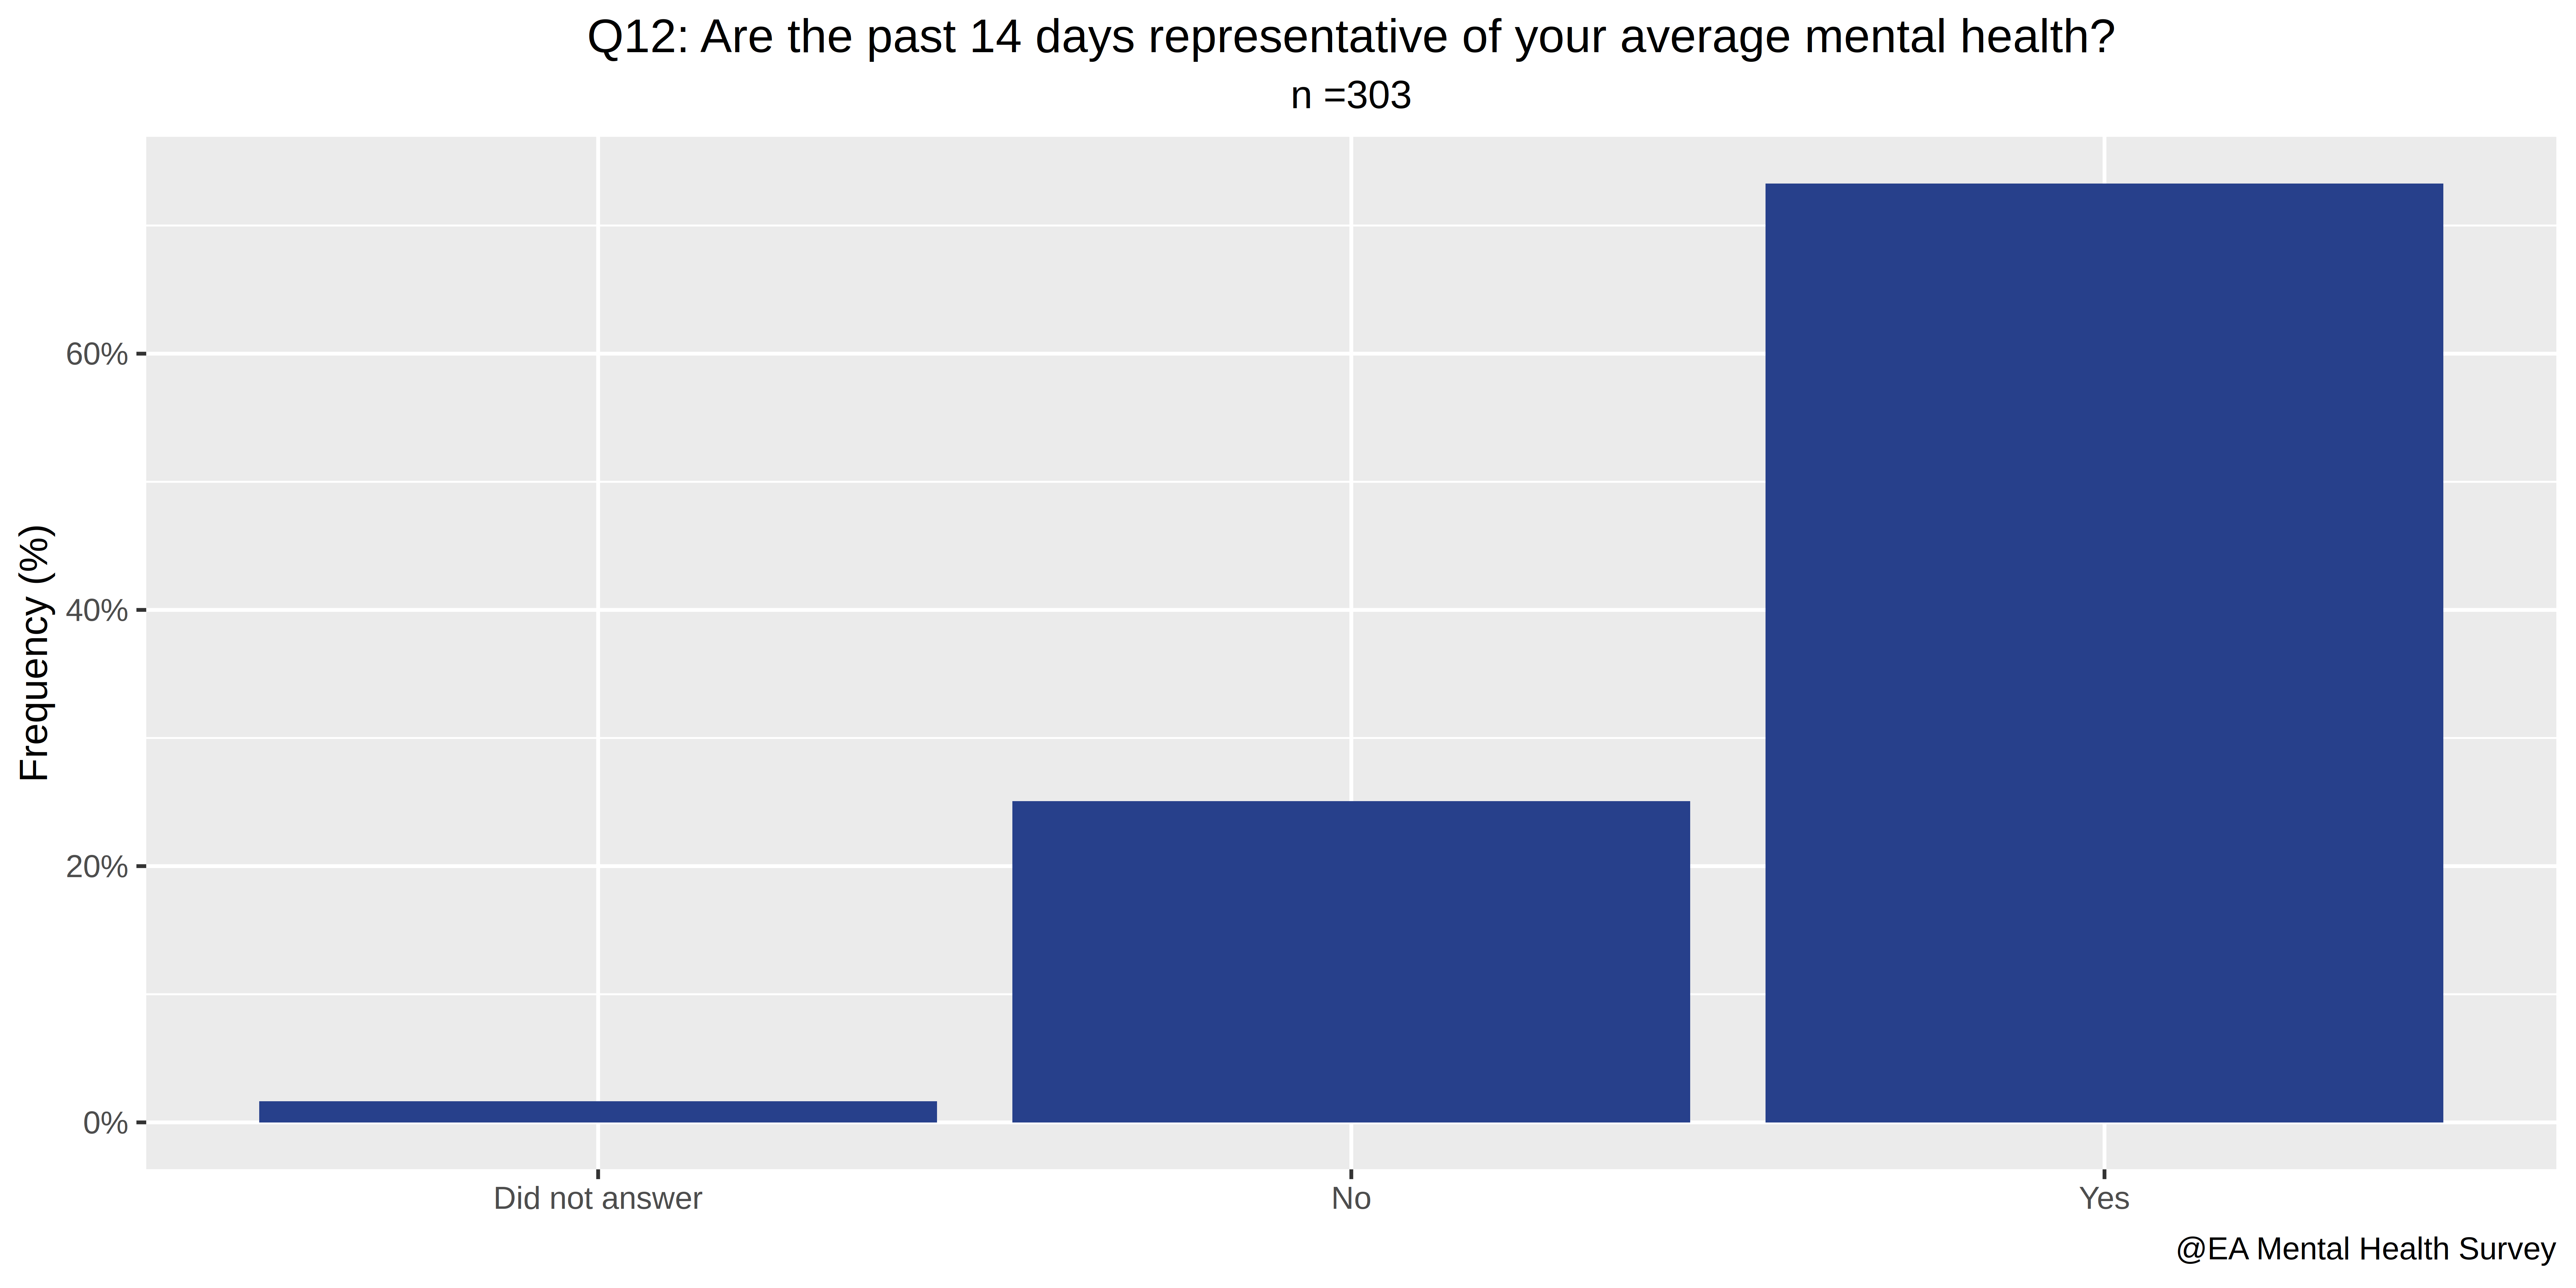
- Are the past 14 days representative of your average mental health?
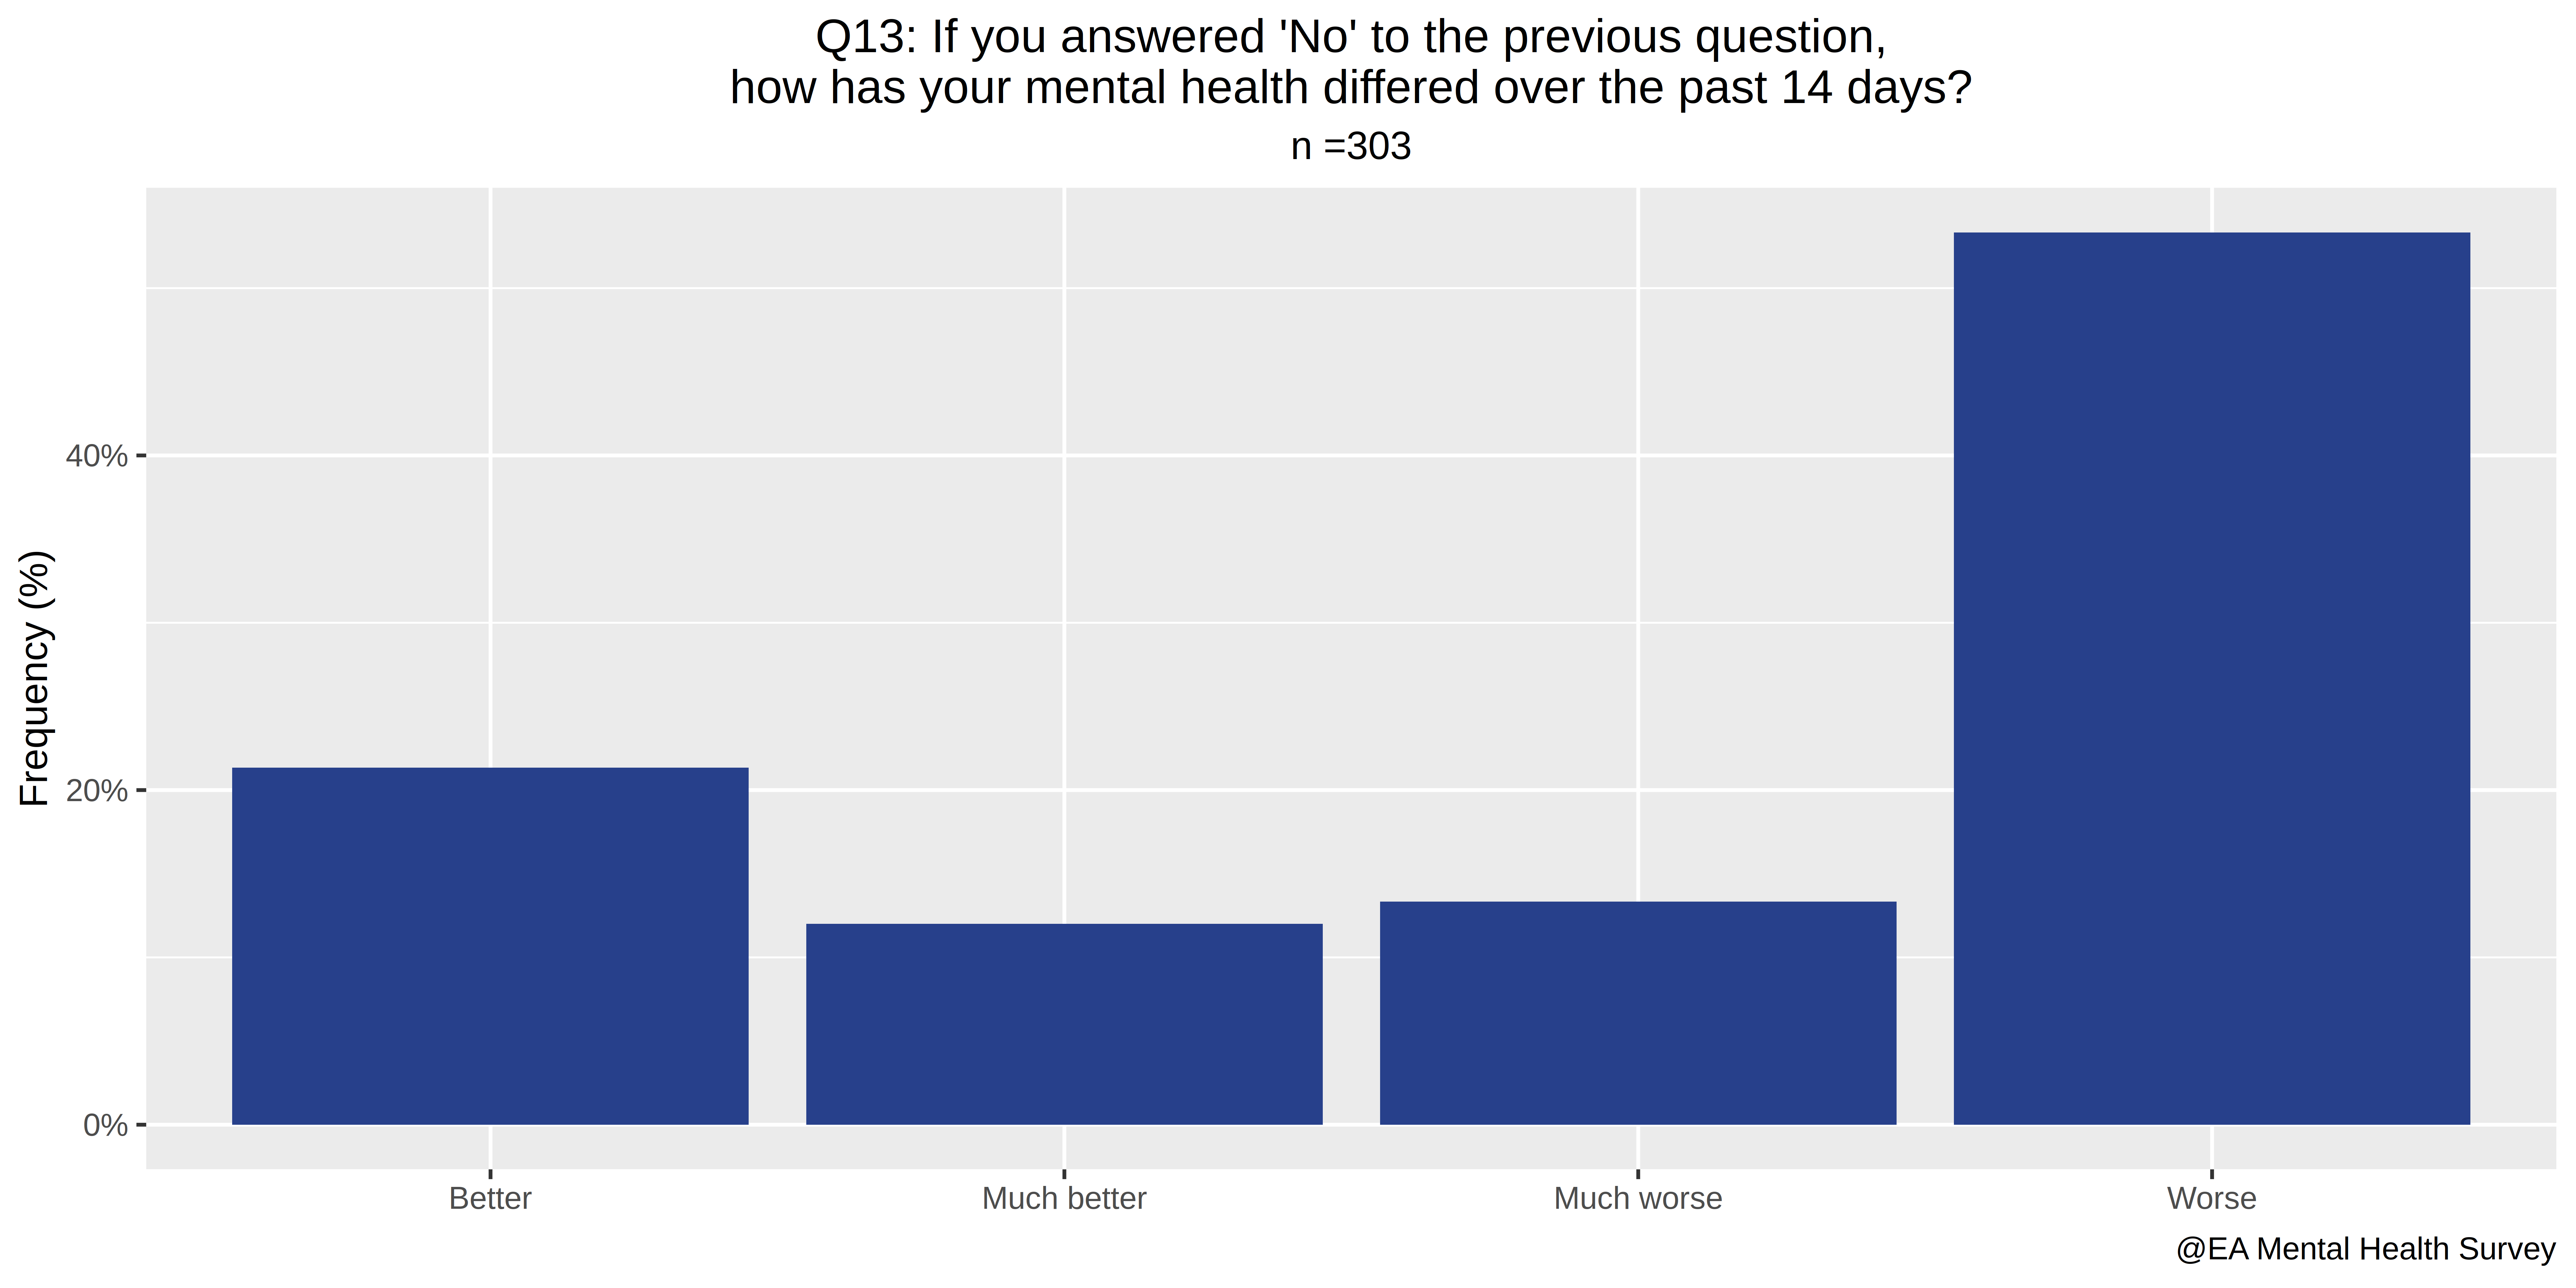
- If you answered "No" to the previous question, how has your mental health differed over the past 14 days?
- How challenging was it to receive the mental healthcare services you needed within the past 12 months?
- How challenging is it to find useful information on mental healthcare services?
- Do you experience financial difficulties as a result of mental healthcare?
- "I am currently receiving the mental healthcare I need."
- How satisfied are you with the mental healthcare you've received?
- Which of the following treatments have you tried?
- Any other thoughts you'd like to share on mental healthcare access?
- "I believe that offering mental health resources to its members is an effective use of the EA Community's resources."
- "I believe that offering mental health resources to effective altruists is NOT likely to be one of the most effective interventions available."
- Please explain your answers to the questions above.
- Do you think you could personally benefit from EA community mental health resources?
- Which (if any) of the following resources do you think you could potentially benefit from?
- Any other thoughts you'd like to share on EA-sponsored mental health resources?
- Which country do you live in?
- What is your age?
- What is your gender?
- What is your race/ethnicity?
B. Exploratory plots.
The code to produce them can be found here
C. Data Analysis
1. Is the population which answered the survey representative of EA overall?
1.1. According to age
![]()
1.2. According to country.
1.3. According to gender.
EA Survey 2018:
The majority of people who took the survey reported being male (67%), while 29% of respondents reported that they were female, and approximately 4% described themselves as other or declined to self-identify. This is closely aligned with the 2017 survey, which had the following gender breakdown: “70.1% identified as male, 26.01% identified as female, 1.9% respondents identified as “other”, and another 21 respondents preferred not to answer.”
However, in this survey, 54.46% of respondents reported being male, 33.33% of respondents reported being female, and 12.21% described themselves as other (7.59%) or declined to self-identify (4.62%).
1.4. Bottom line:
Editorial bottom line: With respect to age, country, and gender, there seem to be significant but not overwhelming differences. The differences in gender identification might be indicative of selection effects affecting this survey. This is because perhaps people in this third category have higher rates of mental illness. I have explored this hypothesis at length here: A practical exercise in p-hacking (or not).
2. Does EA have a mental health problem?
Initially, I was intending to find out the different mental disorder rates in the different countries, and combine that with the distribution in the data. The webpage Our World in Data provides the necessary data:
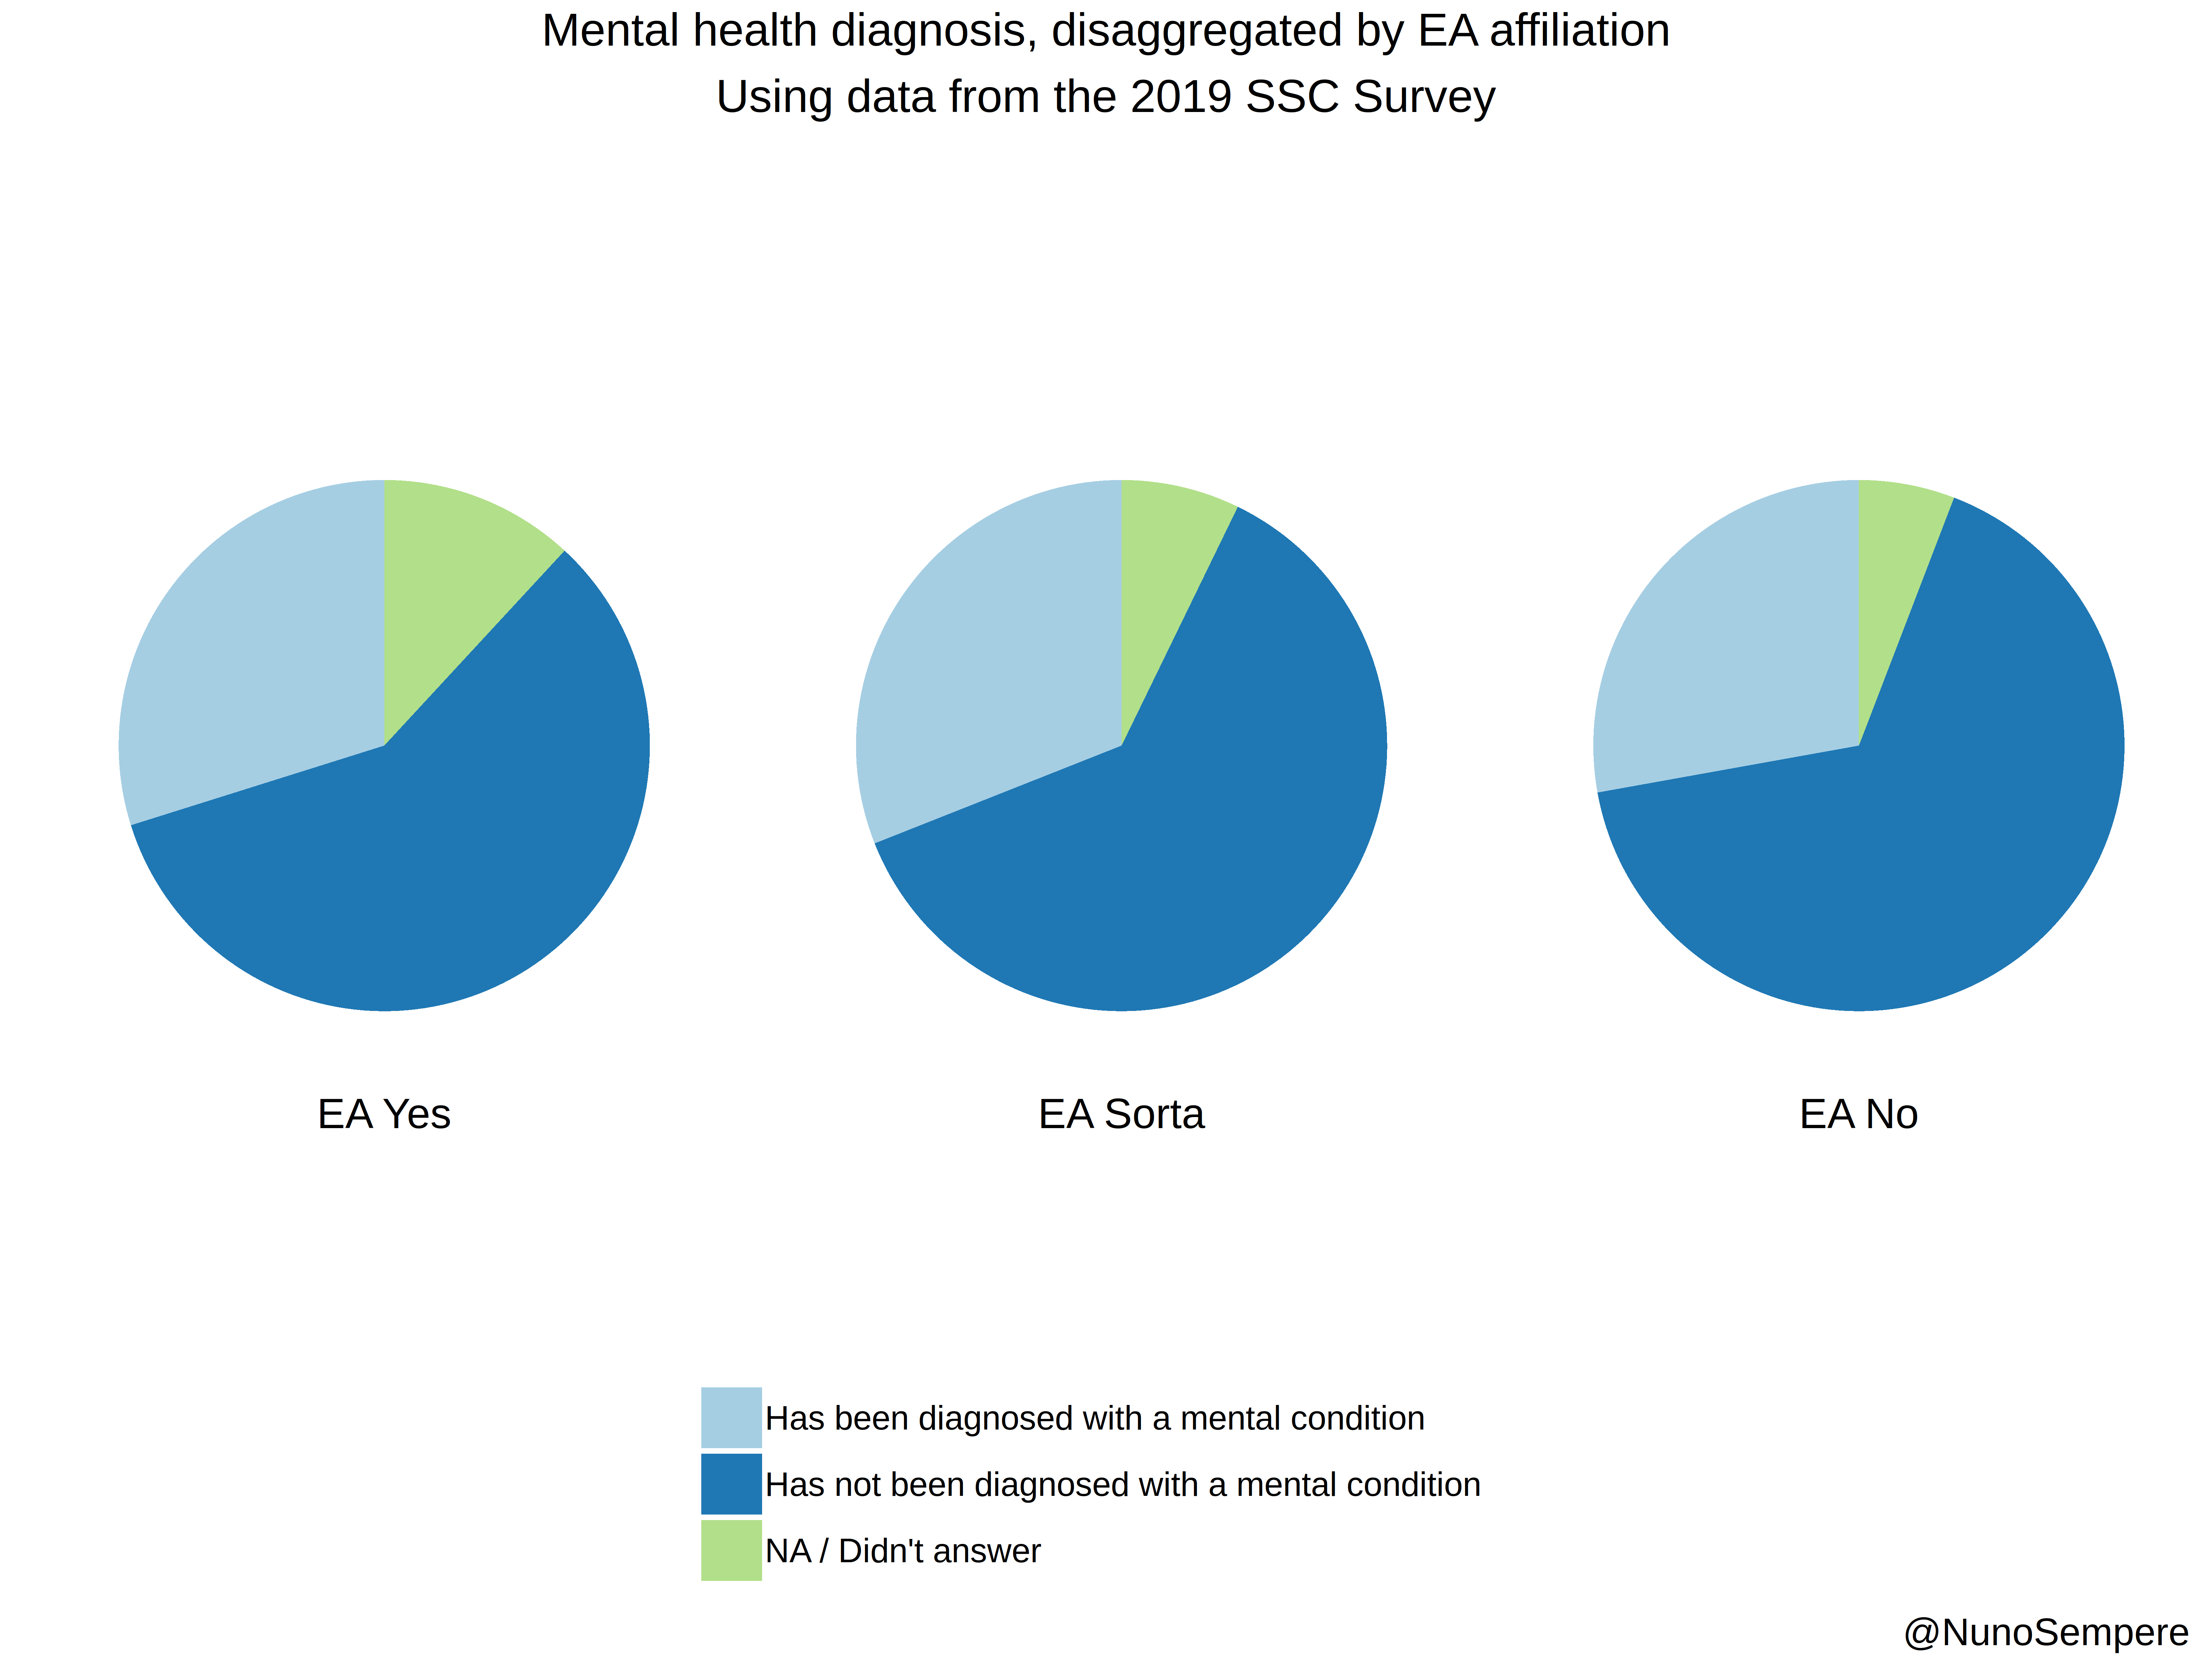
We see that the distribution is broadly similar across the countries among which EA has a presence. Most importantly, it doesn't surpass ~25% in any country, whereas among survey respondents:
- 45% have been diagnosed with one or more mental disorders (from our list).
- 71% either have been diagnosed with one or more mental disorders or intuit they have one.
- The average number of mental illnesses respondents have been diagnosed with is 0.82
- The average number of mental illnesses respondents have either been diagnosed with or intuit they have is 1.68. This number is higher than one because many respondents have more than one disorder. This is not particularly surprising: see Understanding Comorbid Depression and Anxiety.
Thus, we can conclude with certainty that there are selection effects going on. Whether this is at the level of the EA community or at the survey level is not deducible from the data. That is, it could either be that EA attracts people with mental disorders, or that the survey attracts respondents with mental disorders. Thus, we suggest adding a mental health section to the yearly EA Survey by Rethink Charity.
The first four questions in our survey relate to involvement with EA:
- How involved are you in the Effective Altruism Community?
- Do you attend EA meetings?
- How much impact do EA ideas have on your life?
- Do you donate part of your income to GiveWell recommended charities?
And four measures of mental illness:
- A. A binary variable indicating whether a person was diagnosed with any mental illness (from our list) or not.
- B. A binary variable indicating whether a person was diagnosed with any mental illness / think they have a mental illness, or not
- C. An integer variable with the number of mental illnesses a person has been diagnosed with.
- D. An integer variable with the number of mental illnesses a person has been diagnosed with or thinks they have.
We have run 20 linear models, regressing each of our measures of mental illness with the answers to each of the four questions, and their sum (where verbal scales are converted to numerical ones when required. For example, a {"No", "Yes"} is converted to {0,1}.)
In 17/20 cases, we get a positive but insignificant effect. One case is ambiguous and still insignificant, and the remaining 2/20 cases are negative but still insignificant. That is, further involvement with EA across all but one model makes one less likely to have mental illnesses, and to have fewer mental illnesses, but at no point does this reach significance thresholds.
For example, consider whether attending EA meeting has a positive effect on the binary variable: has been diagnosed with a mental health illness.
> summary(lm(A$m_ill_or_not ~ A$Do.you.attend.EA.meetings.))

Coefficients:
                        Estimate Std. Error t value Pr(>|t|)
(Intercept)             0.3333     0.2893   1.152    0.250
No                      0.1905     0.2961   0.643    0.520
No, but I regularly participate
in an EA online group   0.1505     0.3029   0.497    0.620
Yes, occasionally       0.1026     0.2948   0.348    0.728
Yes, often              0.1042     0.2926   0.356    0.722
The key column is "Estimate". Smaller numbers are better, and we see that the more often one goes, the less likely is one to have been diagnosed with a mental illness. No > No, but I regularly participate in an EA online group > Yes, occasionally ~ Yes often.
In the interest of total disclosure, here is a link with the 20 regressions carried out, and the code used to generate them.
The bottom-line seems to be that EA is correlated with better mental health, across almost all measures. However, the error bars are humongous, and no significance thresholds are reached. Note that this is only valid for people who are already involved enough with EA to answer this survey.
See also: Efffective Altruists, not as mentally ill as you think
The two questions which directly ask about mental illness are:
- Which of these conditions have you been formally diagnosed with?
- Which of these conditions do you think you may have, but have never been formally diagnosed with?
And the questions which ask about benefiting from mental health resources are:
- Do you think you could personally benefit from EA community mental health resources?
- Which if any of the following resources do you think you could potentially benefit from?
I model having a mental illness as before. Independent on the modelization, the answer our question is yes, people with mental illnesses are more likely to think they can benefit from mental health resources, with p-values ranging from 0.0004736 to
7.612e-12. The obvious result is indeed obvious, and it serves as a proof of concept: we have enough power to find out some things.
Take a moment to make your predictions before you read ahead.
> colnames(A)[c(23,24,26,27)]
[1] "X.I.believe.that.offering.mental.health.resources.to.its.members.is.an.effective.use.of.the.EA.Community.s.resources.."
[2] "X.I.believe.that.offering.mental.health.resources.to.effective.altruists.is.NOT.likely.to.be.one.of.the.most.effective.interventions.available..."
[3] "Do.you.think.you.could.personally.benefit.from.EA.community.mental.health.resources."
[4] "Which..if.any..of.the.following.resources.do.you.think.you.could.potentially.benefit.from."

> summary(lm((A[,23]=="Agree" | A[,23]=="Strongly agree")  ~ A[,26] == "Yes"))

Coefficients:
                     Estimate Std. Error t value Pr(>|t|)
(Intercept)           0.42857    0.03612  11.864  < 2e-16 ***
A[, 26] == "Yes"TRUE  0.29018    0.05558   5.221 3.32e-07 ***
---
Signif. codes:  0 ‘***’ 0.001 ‘**’ 0.01 ‘*’ 0.05 ‘.’ 0.1 ‘ ’ 1
I had forgotten how deep the waters are. If people think they can benefit from mental health resources, the probability that they agree or strongly agree with the statement "I believe that offering mental health resources to its members is an effective use of the EA Community's resources" goes up from 42.857% to 29.018% + 42.857% = 71.875%, with a p-value of 3.321e-07!
Similarly, the probability that they agree with the statement "I believe that offering mental health resources to effective altruists is NOT likely to be one of the most effective interventions available" goes down from 32.571% to 32.571%-16.165% = 16.406%, with a p-value of 0.001409!
> summary(lm((A[,24]=="Agree" | A[,24]=="Strongly agree")  ~ A[,26] == "Yes"))

Coefficients:
                     Estimate Std. Error t value Pr(>|t|)
(Intercept)           0.32571    0.03260   9.991  < 2e-16 ***
A[, 26] == "Yes"TRUE -0.16165    0.05016  -3.223  0.00141 **
---
Signif. codes:  0 ‘***’ 0.001 ‘**’ 0.01 ‘*’ 0.05 ‘.’ 0.1 ‘ ’ 1
Several interpretations present themselves:
1: This is a bias, a component of self-interest. Perhaps people who have mental illnesses are in more pain, and people who feel pain are more selfish. If this was an op-ed piece, much could be said about how the above is why we take care of cultivating rationality, and I'd propose that this topic is more conducive to research analysis of the sort in which QALYs are estimated, and that asking the broad public for opinions is not that valuable.
2: People who feel mental pain have grokked negative utilitarianism, or similarly have different intuitions about the matter.
3: "Those who believe they could personally benefit might assess resources as more valuable precisely because they benefit themselves" is logically equivalent to "Those who don't believe they could personally benefit might assess resources as less valuable precisely because they wouldn't benefit themselves", but in the second case, the connotation is that the bias is on the part of the mentally healthy people. More neutrally, this is perhaps a case of the typical mind fallacy, in which both mentally healthy and mentally ill people use the heuristic of estimating the typical EA mind as similar to their mind, and thus reach different conclusions.
4: Others.
Personal comment: After having considered the above interpretations, I still assign most of the probability mass to interpretation 1: that this mechanism is due to self-interest, or structurally similar to it. That seems to me to be the most straightforward and simple hypothesis, whereas I see the other ones as sophisticated ex post facto rationalizations, that is, of being the answers to the following question: now that we know that this happened, what other mechanisms could explain the same phenomenon while not accusing anyone of being influenced by self-interest? (that has been, incidentally, the algorithm used to generate these ideas). To express the above numerically, I think that the intuitive odds which I assign to (Interpretation 1: Interpretation 2: Interpretation 3) would broadly and roughly be more like (80:2:10), and not at all like (33:33:33). This judgement may appear, and in fact be, one-sided. Readers are welcome to reach their own conclusions.
The effect is very robust to different modelizations: regressing instead on empty answers to question 25: "Which if any of the following resources do you think you could potentially benefit from?", regressing on whether the respondents have a mental disorder instead of whether they say they'd benefit from mental health resources, including "Not sure" answers in the regression, etc.
Here is the above, presented visually
The following table is the cold, raw, hard data for the graphic.
> # Distribution of answers to "Q22: I believe that offering mental health resources to effective altruists\nis NOT likely to be one of the most effective interventions available?"
               group      freq  type
1   Neutral/Not sure 47.656250  Thinks they could benefit.
2           Disagree 28.125000  Thinks they could benefit.
3  Strongly disagree  7.031250  Thinks they could benefit.
4              Agree 13.281250  Thinks they could benefit.
5     Strongly agree  3.125000  Thinks they could benefit.
6          No answer  0.781250  Thinks they could benefit.
7   Neutral/Not sure 44.571429  Does not think they could benefit or is not sure.
8           Disagree 19.428571  Does not think they could benefit or is not sure.
9              Agree 24.000000  Does not think they could benefit, or is not sure.
10         No answer  1.714286  Does not think they could benefit or is not sure.
11    Strongly agree  8.571429  Does not think they could benefit, or is not sure.
12 Strongly disagree  1.714286  Does not think they could benefit, or is not sure.
According to my understanding of "effective" and "effective altruism", the following two questions have equivalent meanings:
- "I believe that offering mental health resources to its members is an effective use of the EA Community's resources."
- "I believe that offering mental health resources to effective altruists is NOT likely to be one of the most effective interventions available."
However, I insisted on adding the second question because the connotations are slightly different, and the bias that they'll produce will go in opposite directions. For an intuition pump:
A Latinobarometro poll in 2004 showed that while a clear majority (63 percent) in Latin America would never support a military government, 55 percent would not mind a nondemocratic government if it solved economic problems.
- Source: The Power of Survey Design.
As it turns out, only 30% of respondents gave the same answer to the two questions. This is not correlated with mental disorders, age, sex, gender, the impact of EA ideas in one's life or involvement in the EA community. It is, however, weakly correlated with donating to GiveWell recommended charities.
7. How does further involvement in EA correlate with opinions on the value of mental health resources?
The correlation between involvement in EA and having a positive opinion of providing mental health resources is positive but small and not significant at all. I wouldn't read anything into this, but I am reporting this because I ran the regression.
The above is true both if we create a dummy for each possible answer (which are: "Strongly disagree", "Disagree", "", "Neutral/Not sure", "Agree", "Strongly agree") and also if we instead convert the answers into a number ("Strongly disagree" = -2, "Disagree" = -1, ""=0, "Neutral/Not sure"=0, "Agree"=1, "Strongly agree"=2) and run a regression on that. For that matter, the switch function in R proved unsatisfactory for working on strings; I wrote one more suited to my purposes and sufficient for n=303.
switch2 <- function(Elements, Compare_With, Output_if_found, Output_if_Else){
  Lista = vector()
  for(element in Elements){
    i=1
    found=FALSE
    for(comparator in Compare_With){
       if(is.na(element) | is.na(comparator)){

       } else if(element == comparator){
         found = TRUE
         Lista = c(Lista, Output_if_found[i])
       }
      i =i +1
    }
    if(found == FALSE){
      Lista = c(Lista,Output_if_Else)
    }
  }
  return(Lista)
}

## This function can then be used as follows:
> colnames(A)[c(23,24)]
[1] "X.I.believe.that.offering.mental.health.resources.to.its.members.is.an.effective.use.of.the.EA.Community.s.resources.."
[2] "X.I.believe.that.offering.mental.health.resources.to.effective.altruists.is.NOT.likely.to.be.one.of.the.most.effective.interventions.available..."

switch2(A[,23], c("Strongly disagree", "Disagree", "Agree","Strongly agree"), c(-2,-1,1,2),0) -> Numerical_23
switch2(A[,23], c("Strongly disagree", "Disagree", "Agree","Strongly agree"), c(-2,-1,1,2),0) -> Numerical_24
8. How does productivity lost because of mental health problems correlate with opinions on the value of mental health resources (and vice-versa)?
The two questions which ask about productivity lost because of mental health problems are:
- During the past 14 days, how many hours did you miss from work because of mental health problems? (numerical answer)
- During the past 14 days, how much did mental health problems affect your productivity while you were working? (numerical answer)
And the two questions which ask about the effectiveness of providing mental health resources are:
- "I believe that offering mental health resources to its members is an effective use of the EA Community's resources."
- "I believe that offering mental health resources to effective altruists is NOT likely to be one of the most effective interventions available."
Under a wide range of modelizations / operationalizations, there is ~0 correlation between the two sets of answers. The one exception is if we consider a dummy variable for "hours lost due to mental illness > 0". In that case, respondents who did lose >0 hours are somewhat more likely to support offering mental health resources, but this does not reach significant levels.
This is surprising because a positive opinion of offering mental health resources is strongly correlated with thinking you could benefit from them, thinking you could benefit from them is strongly correlated with having a mental condition, and having a mental condition is strongly correlated with losing hours because of mental health.
Of course, the relation "(significantly) correlated to" is not transitive in theory, and coming up with a nifty example is not difficult. But it is most curious that the relation is not transitive in practice.
> colnames(A)[c(23,24,26)]
[1] "X.I.believe.that.offering.mental.health.resources.to.its.members.is.an.effective.use.of.the.EA.Community.s.resources.."
[2] "X.I.believe.that.offering.mental.health.resources.to.effective.altruists.is.NOT.likely.to.be.one.of.the.most.effective.interventions.available..."
[3] "Do.you.think.you.could.personally.benefit.from.EA.community.mental.health.resources."

> summary(lm(Numerical_23 ~ A[,26]=="No"))
    ## Significantly correlated, with p-value = 6.068e-07
> summary(lm(A[,26] == "No" ~ A$m_ill_or_not))
    ## Significantly correlated, with p-value = 0.0004736
> summary(lm(A$m_ill_or_not ~ hours_lost))
    ## Significantly correlated, with p-value = 5.479e-07
> summary(lm(Numerical_23 ~ hours_lost))
    ## Not significantly correlated!
What is the effect of mental health on productivity, and how does access to healthcare mediate it?
9.1. How does mental health affect productivity?
We can correlate our four markers of mental illness on our two measures of lost productivity. However, the correlation runs both ways: from the data we cannot deduce whether people with mental conditions lose productivity, or whether losing productivity (i.e., losing a job) makes people more likely to be mentally ill.
If we assume that the effect is purely unidirectional (mental illness -> lost productivity), three highlights are:
- Being diagnosed with one or more mental conditions would cause a loss of ~9 hours per 2 weeks.
- Each additional diagnosed mental illness would cause a loss of ~5 hours per 2 weeks.
- On a subjective 10 point scale, answers to the question ("During the past 14 days, how much did mental health problems affect your productivity while you were working?") increase by ~2 points if the respondent perceives they have at least 1 mental condition.
In total, we run 12 regressions, which are fully documented below. The casual reader is welcome to skip them and continue to the next section.
# Call: lm(formula = A$m_ill_or_not ~ hours_lost)

Coefficients:
            Estimate Std. Error t value Pr(>|t|)
(Intercept) 0.403430   0.030657  13.159  < 2e-16 ***
hours_lost  0.009909   0.001886   5.254 2.94e-07 ***
---
Signif. codes:  0 ‘***’ 0.001 ‘**’ 0.01 ‘*’ 0.05 ‘.’ 0.1 ‘ ’ 1


# Call: lm(formula = hours_lost ~ A$m_ill_or_not)

Coefficients:
               Estimate Std. Error t value Pr(>|t|)
(Intercept)       2.010      1.168   1.721   0.0863 .
A$m_ill_or_not    8.998      1.713   5.254 2.94e-07 ***
---
Signif. codes:  0 ‘***’ 0.001 ‘**’ 0.01 ‘*’ 0.05 ‘.’ 0.1 ‘ ’ 1

# Call: lm(formula = hours_lost ~ A$m_ill_or_not2)

Coefficients:
                Estimate Std. Error t value Pr(>|t|)
(Intercept)       0.3951     1.6253   0.243    0.808
A$m_ill_or_not2   8.1099     1.9224   4.219 3.32e-05 ***
---
Signif. codes:  0 ‘***’ 0.001 ‘**’ 0.01 ‘*’ 0.05 ‘.’ 0.1 ‘ ’ 1

# Call: lm(formula = hours_lost ~ A$m_ill_or_not + (A$m_ill_or_not2 &
    !A$m_ill_or_not))

    Coefficients:
                                      Estimate Std. Error t value Pr(>|t|)
(Intercept)                             0.3951     1.5960   0.248    0.805
A$m_ill_or_not                         10.6125     2.0274   5.235 3.24e-07 ***
A$m_ill_or_not2 & !A$m_ill_or_notTRUE   3.4571     2.3352   1.480    0.140
---
Signif. codes:  0 ‘***’ 0.001 ‘**’ 0.01 ‘*’ 0.05 ‘.’ 0.1 ‘ ’ 1

# Call: lm(formula = hours_lost ~ A$num_mental_illnesses)

Coefficients:
                      Estimate Std. Error t value Pr(>|t|)
(Intercept)              2.174      1.051   2.069   0.0395 *
A$num_mental_illnesses    4.856      0.767   6.331 9.58e-10 ***
---
Signif. codes:  0 ‘***’ 0.001 ‘**’ 0.01 ‘*’ 0.05 ‘.’ 0.1 ‘ ’ 1

# Call: lm(formula = hours_lost ~ A$num_mental_illnesses2)

Coefficients:
                       Estimate Std. Error t value Pr(>|t|)
(Intercept)             -0.6053     1.2060  -0.502    0.616
A$num_mental_illnesses2   4.0640     0.5317   7.643 3.33e-13 ***
---
Signif. codes:  0 ‘***’ 0.001 ‘**’ 0.01 ‘*’ 0.05 ‘.’ 0.1 ‘ ’ 1

# Call: lm(formula = hours_lost ~ A$num_mental_illnesses + A$num_mental_illnesses2)

Coefficients:
                       Estimate Std. Error t value Pr(>|t|)
(Intercept)             -0.5355     1.2055  -0.444    0.657
A$num_mental_illnesses    1.4484     1.0981   1.319    0.188
A$num_mental_illnesses2   3.3057     0.7826   4.224 3.25e-05 ***
---
Signif. codes:  0 ‘***’ 0.001 ‘**’ 0.01 ‘*’ 0.05 ‘.’ 0.1 ‘ ’ 1

# Call: lm(formula = A$m_ill_or_not ~ effect_while_working)

Coefficients:
                     Estimate Std. Error t value Pr(>|t|)
(Intercept)           0.10805    0.04885   2.212   0.0278 *
effect_while_working  0.08744    0.01020   8.577 5.56e-16 ***
---
Signif. codes:  0 ‘***’ 0.001 ‘**’ 0.01 ‘*’ 0.05 ‘.’ 0.1 ‘ ’ 1

# Call: lm(formula = effect_while_working ~ A$m_ill_or_not)

Coefficients:
               Estimate Std. Error t value Pr(>|t|)
(Intercept)      3.0062     0.1806  16.644  < 2e-16 ***
A$m_ill_or_not   2.2764     0.2654   8.577 5.56e-16 ***
---
Signif. codes:  0 ‘***’ 0.001 ‘**’ 0.01 ‘*’ 0.05 ‘.’ 0.1 ‘ ’ 1

# Call: lm(formula = effect_while_working ~ A$m_ill_or_not2)

Coefficients:
                Estimate Std. Error t value Pr(>|t|)
(Intercept)       1.9518     0.2402   8.126 1.22e-14 ***
A$m_ill_or_not2   2.9226     0.2828  10.335  < 2e-16 ***
---
Signif. codes:  0 ‘***’ 0.001 ‘**’ 0.01 ‘*’ 0.05 ‘.’ 0.1 ‘ ’ 1

# Call: lm(formula = effect_while_working ~ A$num_mental_illnesses)

Coefficients:
                      Estimate Std. Error t value Pr(>|t|)
(Intercept)             3.1341     0.1630  19.228   <2e-16 ***
A$num_mental_illnesses   1.1130     0.1185   9.394   <2e-16 ***
---
Signif. codes:  0 ‘***’ 0.001 ‘**’ 0.01 ‘*’ 0.05 ‘.’ 0.1 ‘ ’ 1

#  Call: lm(formula = effect_while_working ~ A$num_mental_illnesses2)

Coefficients:
                       Estimate Std. Error t value Pr(>|t|)
(Intercept)             2.43830    0.18171   13.42   <2e-16 ***
A$num_mental_illnesses2  0.95910    0.07998   11.99   <2e-16 ***
---
Signif. codes:  0 ‘***’ 0.001 ‘**’ 0.01 ‘*’ 0.05 ‘.’ 0.1 ‘ ’ 1
So unsurprisingly, having a mental illness decreases both work hours, and self-reported productivity when working. Thus, a pressing question is whether therapy has an effect on that.
Two questions ask about access to treatment:
- "I am currently receiving the mental healthcare I need."
- How satisfied are you with the mental healthcare you've received?
And we can correlate their answers with our measures for lost productivity.
- During the past 14 days, how many hours did you miss from work because of mental health problems? (numerical answer)
- During the past 14 days, how much did mental health problems affect your productivity while you were working? (numerical answer)
9.2.1. Mediated by answers to "I am currently receiving the mental healthcare I need".
Respondents could choose one of the following options, after being prompted by the sentence "I am currently receiving the mental healthcare I need":
[1] "Strongly agree"
[2] "Agree"
[3] "Strongly disagree"
[4] "Disagree"
[5] "I do not currently need mental healthcare."
[6] ""
We can thus define two dummy variables and regress on them.
> Receiving_positive = A[,19]%in%c("Agree", "Strongly agree")*1         ## 1/TRUE if the respondent thinks they're receiving the mental healthcare they need, 0/FALSE otherwise.
> Receiving_negative= A[,19]%in%c("Disagree", "Strongly disagree")*1    ## 1/TRUE if the respondent thinks they're not receiving the mental healthcare they need, 0/FALSE otherwise.
The results seem to indicate that when respondents receive the mental health care they think they need, they improve. Note that both of the coefficients are positive because the intercept refers to respondents who did not feel they needed mental healthcare.
> summary(lm(hours_lost ~ Receiving_positive + Receiving_negative))

Call:
lm(formula = hours_lost ~ Receiving_positive + Receiving_negative)

Coefficients:
                       Estimate Std. Error t value Pr(>|t|)
(Intercept)              0.6435     1.3885   0.463 0.643388
Receiving_positiveTRUE   7.7986     2.0297   3.842 0.000151 ***
Receiving_negativeTRUE  10.3071     2.1209   4.860 1.96e-06 ***
---
Signif. codes:  0 ‘***’ 0.001 ‘**’ 0.01 ‘*’ 0.05 ‘.’ 0.1 ‘ ’ 1

> summary(lm(effect_while_working ~ Receiving_positive + Receiving_negative))

Call:
lm(formula = effect_while_working ~ Receiving_positive + Receiving_negative)

Coefficients:
                       Estimate Std. Error t value Pr(>|t|)
(Intercept)              2.4818     0.2123  11.689  < 2e-16 ***
Receiving_positiveTRUE   2.1182     0.3077   6.884  3.5e-11 ***
Receiving_negativeTRUE   2.9386     0.3185   9.227  < 2e-16 ***
---
Signif. codes:  0 ‘***’ 0.001 ‘**’ 0.01 ‘*’ 0.05 ‘.’ 0.1 ‘ ’ 1
If this was fully rigorous, giving people "the mental healthcare they need" would reduce hours lost per two weeks from 10.3071 to 7.7986, that is, a difference of 2.5 hours per two weeks, or 1.25 hours per week. Results are similar if we:
- ask instead "How satisfied are you with the mental healthcare you've received?"
- exclude people who did not feel they needed mental healthcare (n=191).
- and further restrict the regression to respondents thought they had a mental condition from our list, or who had been diagnosed with one (n=175).
- or restrict it to people (who claim to have been) diagnosed with a mental condition (n=129).
In this last case, the implied effect doubles, to 2.2 hours saved per week, as seen below.
## Here, we restrict the regression to people diagnosed with a mental condition.
> m_ill3= (Receiving_positive | Receiving_negative) & A$m_ill_or_not
> sum(m_ill3)
[1] 124
> summary(lm(hours_lost[m_ill3] ~ Receiving_positive[m_ill3]))

Call:
lm(formula = hours_lost[m_ill3] ~ Receiving_positive[m_ill3])

Coefficients:
                               Estimate Std. Error t value Pr(>|t|)
(Intercept)                      14.833      3.086   4.807 4.67e-06 ***
Receiving_positive[m_ill3]TRUE   -4.428      4.018  -1.102    0.273
---
Signif. codes:  0 ‘***’ 0.001 ‘**’ 0.01 ‘*’ 0.05 ‘.’ 0.1 ‘ ’ 1
Note that, in none of the above cases we've gotten a significant effect. For example, if we consider the whole population, our coefficients for receiving and not receiving satisfactory mental healthcare are significant, but not significantly different from each other.
I think that this is a function of outliers. For example, respondents who lost a job because of mental illness, and thus ~40 hours per week, make the error bars huge. In this case, excluding outliers doesn't make sense at all; instead, knowing where the error comes from, I think it makes sense to not get hung up on p-values. As a proof of concept, here is the same regression as above, but considering the logarithm of hours lost (which gives less weight to outliers); we "suddenly" reach significance (p-value of 0.00698). On the flip-side, the logarithm of hours lost is not an intuitive unit in which to report results.
> summary(lm(log(hours_lost[m_ill3]+1) ~ Receiving_positive[m_ill3]))
Coefficients:
                               Estimate Std. Error t value Pr(>|t|)
(Intercept)                      2.0578     0.1994  10.322  < 2e-16 ***
Receiving_positive[m_ill3]TRUE  -0.7131     0.2596  -2.747  0.00698 **
---
Signif. codes:  0 ‘***’ 0.001 ‘**’ 0.01 ‘*’ 0.05 ‘.’ 0.1 ‘ ’ 1
Alas, we cannot take the above cross-sections at face value. Imagine, for example, that people with lighter mental conditions find it easier to deal with the hassle of finding good treatment, which seems plausible. In that case, the causal arrow would go both ways: (getting good mental healthcare -> healing occurs -> people lose fewer hours each week), but also (having a lighter mental illness -> easier to find good mental healthcare) + (having a lighter mental illness -> lose less work hours). It could also be that, as people regress to the mean with respect to their mental illness, and become happier, they attribute their improvement to whatever therapy they were receiving and become more satisfied with it. If we assume that the bias goes in the direction of amplifying the effect of good mental healthcare, the above figures become an upper estimate of its effect.
In the ideal case, what I'd like to have is an experiment in which:
- Productivity and severity of mental illness are measured across a population. Or just utilons.
- I instantiate a second copy of this world.
- In one copy, I offer the treatment. I notice that some people don't take it, even though they could.
- In another copy, I don't. I notice that some people get something similar to the intervention. If I provide information, maybe some people already knew it. If I provide free treatment, maybe some people are not limited by money, and pay for it themselves. When the treatment is not provided, people don't just sit and do nothing, but try their own things.
- I wait for some time.
- I measure productivity and severity of mental illness again. Or utilons.
- The difference in between what happened in the two worlds is the impact of my intervention, and divided by the cost, the impact per unit of money.
But I can't have that with the current physics, so the most similar possible thing to the above, and what I'd actually like to have, is something like a randomized trial, in which:
- Productivity and severity of mental illness are measured across a population
- I simulate splitting the two worlds by having a treatment and a control group.
- I offer the intervention to the treatment, but not to the control group.
- Some time passes.
- Productivity and severity of mental illness are measured again, both in the control and treatment group. The difference in outcomes is an estimate of the impact of the intervention.
The point being that, at each step that our data deviates from this, errors may arise.
9.3. Correlation of the Work Productivity and Impairment Scale with mental health
We ask essentially the same questions as above, but with a different operationalization.
The Work Productivity and Impairment Scale has had some thought put into it, and in how to represent the results. Quoting directly from their webpage
WPAI outcomes are expressed as impairment percentages, with higher numbers indicating greater impairment and less productivity, i.e., worse outcomes, as follows:
Questions:
1 = currently employed
2 = hours missed due to health problems
3 = hours missed other reasons
4 = hours actually worked
5 = degree health affected productivity while working
6 = degree health affected regular activities
Scores:
Multiply scores by 100 to express in percentages.
Percent work time missed due to health: Q2/(Q2+Q4)
Percent impairment while working due to health: Q5/10
Percent overall work impairment due to health:
Q2/(Q2+Q4)+[(1-(Q2/(Q2+Q4)))x(Q5/10)]
Percent activity impairment due to health: Q6/10
In R, this would be
Percent_missed_due_to_mental_health = as.integer(horus$hours_missed_processed) / (as.integer(horus$hours_missed_processed) + as.integer(horus$hours_worked))

Impairment_while_working_due_to_mental_health = A$During.the.past.14.days..how.much.did.mental.health.problems.affect.your.productivity.while.you.were.working./10

## But because the survey mistakenly provided a scale from 1-10, instead of a scale from 0-10, a correction must be made:
Impairment_while_working_due_to_mental_health = (A$During.the.past.14.days..how.much.did.mental.health.problems.affect.your.productivity.while.you.were.working.-1)/9

Overall_work_impairment = Percent_missed_due_to_mental_health + (1-Percent_missed_due_to_mental_health )*Impairment_while_working_due_to_mental_health
Overall_work_impairment = Overall_work_impairment*100 ## To express this is percentages.
We will use the percent overall work impairment due to mental health as our productivity measure.
Now, we can correlate productivity lost with having or not having a mental illness. Because I'm not sure respondents understood that an answer of 5 on a scale of 1-10 would be interpreted as a 50% reduction in effectiveness, I'm hesitant to interpret this as a percentage. If we speak about points in the abstract:
- When regressing lost productivity on mental conditions diagnosed and intuited: Being diagnosed with a mental condition is correlated with 42 points of lost productivity, and Intuiting one has a mental illness (as opposed to having been diagnosed with one) is correlated with a loss of ~27 points of lost productivity
- Each additional diagnosed mental illness is correlated with a ~15 point in productivity loss.
The regressions carried out are:
> summary(lm(Overall_work_impairment~A$m_ill_or_not))

Call:
lm(formula = Overall_work_impairment ~ A$m_ill_or_not)

Residuals:
    Min      1Q  Median      3Q     Max
-52.766 -23.113  -3.935  20.538  66.134

Coefficients:
               Estimate Std. Error t value Pr(>|t|)
(Intercept)      23.113      2.219  10.414   <2e-16 ***
A$m_ill_or_not   29.653      3.281   9.038   <2e-16 ***
---
Signif. codes:  0 ‘***’ 0.001 ‘**’ 0.01 ‘*’ 0.05 ‘.’ 0.1 ‘ ’ 1

Residual standard error: 26.91 on 269 degrees of freedom
  (32 observations deleted due to missingness)
Multiple R-squared:  0.2329,    Adjusted R-squared:  0.2301
F-statistic: 81.69 on 1 and 269 DF,  p-value: < 2.2e-16

> summary(lm(Overall_work_impairment~A$m_ill_or_not2))

Call:
lm(formula = Overall_work_impairment ~ A$m_ill_or_not2)

Residuals:
   Min     1Q Median     3Q    Max
-47.36 -14.03   0.86  19.30  52.64

Coefficients:
                Estimate Std. Error t value Pr(>|t|)
(Intercept)       10.251      2.908   3.525 0.000497 ***
A$m_ill_or_not2   37.112      3.446  10.771  < 2e-16 ***
---
Signif. codes:  0 ‘***’ 0.001 ‘**’ 0.01 ‘*’ 0.05 ‘.’ 0.1 ‘ ’ 1

Residual standard error: 25.68 on 269 degrees of freedom
  (32 observations deleted due to missingness)
Multiple R-squared:  0.3013,    Adjusted R-squared:  0.2987
F-statistic:   116 on 1 and 269 DF,  p-value: < 2.2e-16

> summary(lm(Overall_work_impairment~A$m_ill_or_not + (A$m_ill_or_not2 & !A$m_ill_or_not)))

Call:
lm(formula = Overall_work_impairment ~ A$m_ill_or_not + (A$m_ill_or_not2 &
    !A$m_ill_or_not))

Residuals:
   Min     1Q Median     3Q    Max
-52.77 -15.43   0.86  17.82  51.59

Coefficients:
                                      Estimate Std. Error t value Pr(>|t|)
(Intercept)                             10.251      2.829   3.624 0.000347 ***
A$m_ill_or_not                          42.515      3.610  11.775  < 2e-16 ***
A$m_ill_or_not2 & !A$m_ill_or_notTRUE   27.402      4.129   6.637 1.77e-10 ***
---
Signif. codes:  0 ‘***’ 0.001 ‘**’ 0.01 ‘*’ 0.05 ‘.’ 0.1 ‘ ’ 1

Residual standard error: 24.98 on 268 degrees of freedom
  (32 observations deleted due to missingness)
Multiple R-squared:  0.3412,    Adjusted R-squared:  0.3363
F-statistic:  69.4 on 2 and 268 DF,  p-value: < 2.2e-16

> summary(lm(Overall_work_impairment~A$num_mental_illnesses))

Call:
lm(formula = Overall_work_impairment ~ A$num_mental_illnesses)

Residuals:
   Min     1Q Median     3Q    Max
-59.17 -21.14  -3.74  17.30  64.21

Coefficients:
                      Estimate Std. Error t value Pr(>|t|)
(Intercept)             25.036      2.007  12.475   <2e-16 ***
A$num_mental_illnesses   14.089      1.454   9.688   <2e-16 ***
---
Signif. codes:  0 ‘***’ 0.001 ‘**’ 0.01 ‘*’ 0.05 ‘.’ 0.1 ‘ ’ 1

Residual standard error: 26.45 on 269 degrees of freedom
  (32 observations deleted due to missingness)
Multiple R-squared:  0.2586,    Adjusted R-squared:  0.2559
F-statistic: 93.85 on 1 and 269 DF,  p-value: < 2.2e-16

> summary(lm(Overall_work_impairment~A$num_mental_illnesses2))

Call:
lm(formula = Overall_work_impairment ~ A$num_mental_illnesses2)

Residuals:
    Min      1Q  Median      3Q     Max
-50.013 -16.426  -5.314  15.953  59.286

Coefficients:
                       Estimate Std. Error t value Pr(>|t|)
(Intercept)             16.4255     2.1752   7.551 6.73e-13 ***
A$num_mental_illnesses2  12.1443     0.9577  12.681  < 2e-16 ***
---
Signif. codes:  0 ‘***’ 0.001 ‘**’ 0.01 ‘*’ 0.05 ‘.’ 0.1 ‘ ’ 1

Residual standard error: 24.31 on 269 degrees of freedom
  (32 observations deleted due to missingness)
Multiple R-squared:  0.3741,    Adjusted R-squared:  0.3718
F-statistic: 160.8 on 1 and 269 DF,  p-value: < 2.2e-16

> summary(lm(Overall_work_impairment~A$m_ill_or_not2 + A$num_mental_illnesses2))

Call:
lm(formula = Overall_work_impairment ~ A$m_ill_or_not2 + A$num_mental_illnesses2)

Residuals:
   Min     1Q Median     3Q    Max
-44.35 -13.30  -0.34  16.14  55.65

Coefficients:
                       Estimate Std. Error t value Pr(>|t|)
(Intercept)              10.251      2.688   3.814 0.000170 ***
A$m_ill_or_not2          16.453      4.387   3.750 0.000216 ***
A$num_mental_illnesses2    8.821      1.288   6.847 5.14e-11 ***
---
Signif. codes:  0 ‘***’ 0.001 ‘**’ 0.01 ‘*’ 0.05 ‘.’ 0.1 ‘ ’ 1

Residual standard error: 23.74 on 268 degrees of freedom
  (32 observations deleted due to missingness)
Multiple R-squared:  0.4053,    Adjusted R-squared:  0.4009
F-statistic: 91.34 on 2 and 268 DF,  p-value: < 2.2e-16
With respect to accessibility, we can consider the following 4 questions:
- How challenging was it to receive the mental healthcare services you needed within the past 12 months?
- How challenging is it to find useful information on mental healthcare services?
- Do you experience financial difficulties as a result of mental healthcare?
- "I am currently receiving the mental healthcare I need."
- How satisfied are you with the mental healthcare you've received?
And aggregate them into an index, by assigning a numerical score to each answer to each question, and adding up the scores for each respondent.
> i=16
> colnames(A)[i]
[1] "How.challenging.was.it.to.receive.the.mental.healthcare.services.you.needed.within.the.past.12.months."
> unique(A[,i])
[1] "Fairly easy"
[2] "I have not needed mental healthcare services in the past 12 months."
[3] "Very hard"
[4] "Fairly hard"
[5] "Moderate"
[6] ""
[7] "I did not seek out mental healthcare services in the past 12 months but believe I could have benefitted from them."
[8] "Very easy"
> switch2(A[,16],unique(A[,16]),c(1,0,-2,-1,0,0,0,2),0) -> I1
> i=17
> colnames(A)[i]
[1] "How.challenging.is.it.to.find.useful.information.on.mental.healthcare.services."
> unique(A[,i])
[1] "Moderate"
[2] "I have not looked for information on mental healthcare services."
[3] "Very hard"
[4] "Fairly easy"
[5] "Fairly hard"
[6] ""
[7] "Very easy"
> switch2(A[,17],unique(A[,17]),c(0,0,-2,1,-1,0,2),0) -> I2
> i=18
> colnames(A)[i]
[1] "Do.you.experience.financial.difficulties.as.a.result.of.mental.healthcare."
> unique(A[,i])
[1] "Never"     "Regularly" "Sometimes" "Rarely"    ""
> switch2(A[,i],unique(A[,i]),c(2,-2,-1,1,0),0) -> I3
> i=19
> colnames(A)[19]
[1] "X.I.am.currently.receiving.the.mental.healthcare.I.need..."
> unique(A[,i])
[1] "Strongly agree"
[2] "Agree"
[3] "Strongly disagree"
[4] "Disagree"
[5] "I do not currently need mental healthcare."
[6] ""
> switch2(A[,i],unique(A[,i]),c(2,1,-2,-1,0,0),0) -> I4
> i=20
> colnames(A)[20]
[1] "How.satisfied.are.you.with.the.mental.healthcare.you.ve.received."
> unique(A[,i])
[1] "Fairly satisfied"
[2] "I have not received mental healthcare services."
[3] "Very dissatisfied"
[4] "Fairly dissatisfied"
[5] "Very satisfied"
[6] ""
> switch2(A[,i],unique(A[,i]),c(1,0,-2,-1,2,0),0) -> I5
> Index = I1+I2+I3+I4+I5
Now, the correlation we want to run is:
Productivity lost ~ Having a mental condition + Having a mental condition * Our index of access
This is because having a mental condition is correlated with having nonzero answers in our index of access. In any case, we'll also want to run the same regression restricting it to people with at least one mental health condition. The results are as follows:
> Index_of_access_mediated_by_mh = Index*A$m_ill_or_not2
> max(Index_of_access_mediated_by_mh, na.rm=TRUE)
[1] 10
> min(Index_of_access_mediated_by_mh, na.rm=TRUE)
[1] -9
> summary(lm(Overall_work_impairment ~ A$m_ill_or_not2 + Index_of_access_mediated_by_mh))

Coefficients:
                               Estimate Std. Error t value Pr(>|t|)
(Intercept)                     10.2508     2.7209   3.767 0.000203 ***
A$m_ill_or_not2                 42.2708     3.3277  12.703  < 2e-16 ***
Index_of_access_mediated_by_mh  -3.0173     0.4818  -6.263  1.5e-09 ***
---
Signif. codes:  0 ‘***’ 0.001 ‘**’ 0.01 ‘*’ 0.05 ‘.’ 0.1 ‘ ’ 1
That is, for respondents who have a mental health condition, having the worst possible score in the index of access, a -10, is correlated with losing -3*(-10) = 30 fewer productivity points, that is, perhaps being 30% less productive. Note that the minimum score was -9. On the other hand, having the best score in the index of access, a 10, is correlated with losing -3*10 = -30 productivity points, that is, perhaps being 30% more productive. That would be on top of a productivity loss of 42% for having a mental illness in the first place.
Repeating myself, I would take these numbers with a grain of salt, because I'm not sure respondents understood that an answer of 5 on a scale of 1-10 would be interpreted as a 50% reduction in effectiveness. If the survey is administered again, I'd prefer for the question to make a reference to percentages explicitly. And still, I would be skeptical, because I don't expect people to estimate percentage of productivity lost with much precision. The reader is welcome to come to their own conclusions.
However, if taken at face value, these answers imply that the value of providing mental health resources might be huge. More precisely, if the above is an upper bound, the upper bound is high enough for continued interest. A lower bound, modulo survey selection effects, is an average loss of 10% of work hours among the respondents, and a loss of 18% of work hours among those diagnosed with a mental condition.
> mean(Percent_missed_due_to_mental_health, na.rm=TRUE)
[1] 0.1032673
> mean(Percent_missed_due_to_mental_health[A$m_ill_or_not2==1], na.rm=TRUE)
[1] 0.1422757
> mean(Percent_missed_due_to_mental_health[A$m_ill_or_not==1], na.rm=TRUE)
[1] 0.1793087
Using the same methodologies as above, the crossectional estimate of providing better information is also large. A productivity improvement of ~10% if information is very easy to come by, respectively a productivity loss of ~10% if finding it is very hard (~12% if restricting the regression to those with a diagnosis)
Alone in terms of work hours, 2 would be gained (resp. lost) every two weeks if respondents find information very easy (resp. very hard) to come by, amongst respondents who have been diagnosed with a mental illness or think they have one. If we only look at respondents with a diagnosis, this estimate increases to ~3 hours.
I personally consider it likely that the effect is so large because the causal mechanism goes in both directions: a less burdensome mental illness -> easier to do things like finding information, or not missing work hours, but also: information is easier to find -> condition gets better -> fewer work hours are missed.
> i=17
> colnames(A)[i]
[1] "How.challenging.is.it.to.find.useful.information.on.mental.healthcare.services."
> unique(A[,i])
[1] "Moderate"
[2] "I have not looked for information on mental healthcare services."
[3] "Very hard"
[4] "Fairly easy"
[5] "Fairly hard"
[6] ""
[7] "Very easy"
> switch2(A[,17],unique(A[,17]),c(0,0,-2,1,-1,0,2),0) -> I2

> summary(lm(Overall_work_impairment ~ I2))
Coefficients:
            Estimate Std. Error t value Pr(>|t|)
(Intercept)   37.791      1.920  19.684   <2e-16 ***
I2            -4.626      2.136  -2.166   0.0312 *
---
Signif. codes:  0 ‘***’ 0.001 ‘**’ 0.01 ‘*’ 0.05 ‘.’ 0.1 ‘ ’ 1

> summary(lm(Overall_work_impairment[A$m_ill_or_not2==1] ~ I2[A$m_ill_or_not2==1]))

Coefficients:
                         Estimate Std. Error t value Pr(>|t|)
(Intercept)                48.659      2.151  22.623   <2e-16 ***
I2[A$m_ill_or_not2 == 1]   -5.438      2.168  -2.509   0.0129 *
---
Signif. codes:  0 ‘***’ 0.001 ‘**’ 0.01 ‘*’ 0.05 ‘.’ 0.1 ‘ ’ 1


> summary(lm(Overall_work_impairment[A$m_ill_or_not==1] ~ I2[A$m_ill_or_not==1]))

Coefficients:
                        Estimate Std. Error t value Pr(>|t|)
(Intercept)               54.396      2.664  20.415   <2e-16 ***
I2[A$m_ill_or_not == 1]   -5.946      2.490  -2.388   0.0185 *
---
Signif. codes:  0 ‘***’ 0.001 ‘**’ 0.01 ‘*’ 0.05 ‘.’ 0.1 ‘ ’ 1

> summary(lm(hours_lost ~ I2))

Coefficients:
            Estimate Std. Error t value Pr(>|t|)
(Intercept)   6.3751     0.9306   6.851 4.61e-11 ***
I2           -0.7227     1.0165  -0.711    0.478
---
Signif. codes:  0 ‘***’ 0.001 ‘**’ 0.01 ‘*’ 0.05 ‘.’ 0.1 ‘ ’ 1

> summary(lm(hours_lost[A$m_ill_or_not2==1] ~ I2[A$m_ill_or_not2==1]))

Coefficients:
                         Estimate Std. Error t value Pr(>|t|)
(Intercept)                8.7592     1.2541   6.985 4.09e-11 ***
I2[A$m_ill_or_not2 == 1]  -0.9925     1.2510  -0.793    0.428
---
Signif. codes:  0 ‘***’ 0.001 ‘**’ 0.01 ‘*’ 0.05 ‘.’ 0.1 ‘ ’ 1

> summary(lm(hours_lost[A$m_ill_or_not==1] ~ I2[A$m_ill_or_not==1]))

Coefficients:
                        Estimate Std. Error t value Pr(>|t|)
(Intercept)               11.443      1.860   6.153 8.74e-09 ***
I2[A$m_ill_or_not == 1]   -1.401      1.716  -0.816    0.416
---
Signif. codes:  0 ‘***’ 0.001 ‘**’ 0.01 ‘*’ 0.05 ‘.’ 0.1 ‘ ’ 1
9.6 For completeness's sake: All the possible correlations impact ~ productivity
For completeness' sake, we report the correlations between our measures of access and our two measures of productivity. To do this, we define two functions which run the linear models:
> correlation_matrix <- function(X,Y){
+   ## X and Y are matrices. X ~ Y
+   n1 = dim(X)[2]
+   n2= dim(Y)[2]
+   M = matrix(nrow=n1, ncol=n2)
+   for(i in c(1:n1)){
+     for(j in c(1:n2)){
+       lm(X[,i]~Y[,j])$coefficients[2] -> M[i,j]
+     }
+   }
+   colnames(M) = colnames(Y)
+   rownames(M) = colnames(X)
+   return(M)
+
+ }
> correlation_matrix_p_values <- function(X,Y){
+   ## X and Y are matrices. X ~ Y
+   n1 = dim(X)[2]
+   n2= dim(Y)[2]
+   M = matrix(nrow=n1, ncol=n2)
+   for(i in c(1:n1)){
+     for(j in c(1:n2)){
+       summary(lm(X[,i] ~ Y[,j]))$coefficients[2,4] -> M[i,j]
+     }
+   }
+   colnames(M) = colnames(Y)
+   rownames(M) = colnames(X)
+   return(M)
+
+ }
We report:
- The coefficients for the general population
- For people diagnosed with a mental condition:
- And for people who have either been diagnosed with one or who think they have one:
The Effective Altruism Forum doesn't deal with width beautifully, so the following renders more legibly in my github.
Here are the coefficients for the general population (MHS = "Mental health services").
Coefficients
                             Index Challenging to receive MHS Information Financial diffs Receiving MHS Satisfied with MHS
hours_lost              -0.9492239                  -1.664492  -0.7227279       -3.291063    -0.7653226          -1.588250
Overall_work_impairment -3.2373464                  -5.223169  -4.6262763      -10.067441    -4.0892950          -4.511133

p-values
                               Index Challenging to receive MHS Information Financial diffs Receiving MHS Satisfied with MHS
hours_lost              6.777912e-04                 0.09849592  0.47768328    1.440813e-06    0.38272096         0.08794883
Overall_work_impairment 1.599339e-08                 0.01459374  0.03117023    2.417075e-13    0.02585968         0.02255311
For people diagnosed with a mental condition:
Coefficients
                       Index Challenging to receive MHS Information Financial diffs Receiving MHS Satisfied with MHS
hours_lost_m_ill -0.9956094                  -2.230846   -1.400980       -2.572942     -1.675877          -2.798331
OWI_m_ill        -3.0273272                  -7.754313   -5.946413       -5.717414     -6.406658          -8.781692

p-values
                        Index Challenging to receive MHS Information Financial diffs Receiving MHS Satisfied with MHS
hours_lost_m_ill 2.302578e-02               0.1595372489  0.41580331      0.03207855   0.246363280       6.700219e-02
OWI_m_ill        1.202185e-06               0.0009597469  0.01846288      0.00100412   0.002386186       9.873393e-05
And for people who have either been diagnosed with one or who think they have one:
Coefficients
                       Index Challenging to receive MHS Information Financial diffs Receiving MHS Satisfied with MHS
hours_lost_m_ill2 -0.9472378                  -1.941253  -0.9925338       -2.824257    -0.9204575          -2.219678
OWI_m_ill2        -3.0172680                  -6.067586  -5.4382773       -7.243670    -4.4996800          -6.806081

p-values
                       Index Challenging to receive MHS Information Financial diffs Receiving MHS Satisfied with MHS
hours_lost_m_ill2 4.657930e-03                0.105408672  0.42847492    9.500027e-04    0.38496906       0.0487938200
OWI_m_ill2        1.246629e-07                0.004133647  0.01294885    6.681036e-07    0.01494088       0.0006040557
10. How does access to mental health resources vary with a wide variety of factors?
Access is asked about in the following five questions:
- How challenging was it to receive the mental healthcare services you needed within the past 12 months?
- How challenging is it to find useful information on mental healthcare services?
- Do you experience financial difficulties as a result of mental healthcare?
- "I am currently receiving the mental healthcare I need."
- How satisfied are you with the mental healthcare you've received?
The main limitation of these questions is that the answers will depend on the subjective experience and capabilities of the respondents.
I find questions 17 and 18 to be the most informative variants, and have used them to codify access to healthcare. I also see the latter three questions to be logically disjunctive, that is, one could in principle have found it very easy to get information, but be really unsatisfied with the mental healthcare one ends up receiving. However, running regressions, we see that they're all significantly correlated with each other (but there's still variability left). For example, if we correlate the first with the rest, after transforming verbal answers to a numerical scale, we get:
Call:
lm(formula = I1 ~ I2 + I3 + I4 + I5)3

Residuals:
     Min       1Q   Median       3Q      Max
-2.18679 -0.32863 -0.05572  0.34069  1.97955

Coefficients:
            Estimate Std. Error t value Pr(>|t|)
(Intercept) -0.07572    0.05586  -1.356   0.1763
I2           0.23485    0.05101   4.604 6.15e-06 ***
I3           0.06572    0.03158   2.081   0.0383 *
I4           0.27290    0.04292   6.358 7.66e-10 ***
I5           0.19958    0.04818   4.142 4.48e-05 ***
---
Signif. codes:  0 ‘***’ 0.001 ‘**’ 0.01 ‘*’ 0.05 ‘.’ 0.1 ‘ ’ 1
More generally, here follow first all the correlations between answers to any two questions, and the p-values. (Again, this is rendered better by github.)
> Data = cbind(I1,I2,I3,I4,I5)
> colnames(Data) = c("Challenging to receive MHS", "Information", "Financial difficulties","Receiving MHS", "Satisfied with MHS")
> rcorr(Data)
                           Challenging to receive MHS Information Financial difficulties Receiving MHS Satisfied with MHS
Challenging to receive MHS                       1.00        0.41                   0.16          0.47               0.43
Information                                      0.41        1.00                   0.17          0.24               0.37
Financial difficulties                           0.16        0.17                   1.00          0.09              -0.03
Receiving MHS                                    0.47        0.24                   0.09          1.00               0.38
Satisfied with MHS                               0.43        0.37                  -0.03          0.38               1.00

n= 303


P
                           Challenging to receive MHS Information Financial difficulties Receiving MHS Satisfied with MHS
Challenging to receive MHS                            0.0000      0.0050                 0.0000        0.0000
Information                0.0000                                 0.0028                 0.0000        0.0000
Financial difficulties     0.0050                     0.0028                             0.1356        0.6409
Receiving MHS              0.0000                     0.0000      0.1356                               0.0000
Satisfied with MHS         0.0000                     0.0000      0.6409                 0.0000
and the covariance matrix:
                           Challenging to receive MHS Information Financial difficulties Receiving MHS Satisfied with MHS
Challenging to receive MHS                  0.7597753   0.3140778             0.18351802     0.4249885         0.35953927
Information                                 0.3140778   0.7630319             0.19582322     0.2195922         0.31106157
Financial difficulties                      0.1835180   0.1958232             1.71407339     0.1159268        -0.03387756
Receiving MHS                               0.4249885   0.2195922             0.11592682     1.0615697         0.38125369
Satisfied with MHS                          0.3595393   0.3110616            -0.03387756     0.3812537         0.92527266
Thus, because they are correlated, but not perfectly, an index of this questions might be meaningful, that is, taking answers from each question, mapping them into a scale, and summing the scores from each scale. Initially, I considered only questions 14 and 15 when answering this section, and only later did I add the index; thus, I am reporting both results (though they're pretty similar).
10.1. By countries or continent.
With 52 countries and 303 respondents, we don't have the power to say anything. We still don't have anything to say if we aggregate by continent instead, except that unsurprisingly, respondents find it more difficult to access mental healthcare in Africa than in any other continent. However, the effect was not significant, given that very few respondents were from Africa.
This holds both if we consider questions separately and if we consider an index.
10.2. By race/ethnicity.
Perhaps unsurprisingly, white people find it less challenging to receive mental healthcare, and to find information about it. The effect is magnified when considering only respondents with a mental condition.
> summary(lm(switch2(A[,16][M_ILL2], c("Very easy", "Fairly easy", "Moderate", "Fairly hard", "Very hard"), c(3,1,-1,-3),0) ~ A$Race.ethnicity[M_ILL2]))

Coefficients:
                                                Estimate Std. Error t value Pr(>|t|)
(Intercept)                                      -1.6667     1.1053  -1.508    0.134
A$Race.ethnicity[M_ILL2]Asian                     0.9167     1.2960   0.707    0.481
A$Race.ethnicity[M_ILL2]Hispanic or Latino/a/x    0.6667     2.2105   0.302    0.763
A$Race.ethnicity[M_ILL2]Mixed race/Multi-racial   1.1667     1.4621   0.798    0.426
A$Race.ethnicity[M_ILL2]White                     1.7576     1.1178   1.572    0.118
---
Signif. codes:  0 ‘***’ 0.001 ‘**’ 0.01 ‘*’ 0.05 ‘.’ 0.1 ‘ ’ 1


> summary(lm(switch2(A[,16], c("Very easy", "Fairly easy", "Moderate", "Fairly hard", "Very hard"), c(3,1,-1,-3),0) ~ A$Race.ethnicity))

Coefficients:
                                        Estimate Std. Error t value Pr(>|t|)
(Intercept)                             -0.41667    0.39899  -1.044    0.297
A$Race.ethnicityAsian                    0.15580    0.49218   0.317    0.752
A$Race.ethnicityBlack                    0.41667    1.05562   0.395    0.693
A$Race.ethnicityHispanic or Latino/a/x   0.21667    0.73569   0.295    0.769
A$Race.ethnicityMiddle Eastern           0.41667    1.05562   0.395    0.693
A$Race.ethnicityMixed race/Multi-racial  0.08333    0.69106   0.121    0.904
A$Race.ethnicityWhite                    0.46730    0.40896   1.143    0.254
---
Signif. codes:  0 ‘***’ 0.001 ‘**’ 0.01 ‘*’ 0.05 ‘.’ 0.1 ‘ ’ 1
This broadly holds if we consider an index, though now Hispanics get better access the rest.
> summary(lm(Index ~ A$Race.ethnicity))

Coefficients:
                                        Estimate Std. Error t value Pr(>|t|)
(Intercept)                               0.4615     0.8882   0.520   0.6037
A$Race.ethnicityAsian                     1.1635     1.1028   1.055   0.2923
A$Race.ethnicityBlack                     1.0385     2.4324   0.427   0.6697
A$Race.ethnicityHispanic or Latino/a/x    1.9385     1.6852   1.150   0.2510
A$Race.ethnicityMiddle Eastern            0.5385     2.4324   0.221   0.8250
A$Race.ethnicityMixed race/Multi-racial   1.5385     1.5013   1.025   0.3063
A$Race.ethnicityWhite                     1.5505     0.9110   1.702   0.0898 .
---
Signif. codes:  0 ‘***’ 0.001 ‘**’ 0.01 ‘*’ 0.05 ‘.’ 0.1 ‘ ’ 1
I think that this is an artifact of people from Spain being confused about whether to describe themselves as "Hispanic".
10.3. By mental health
Among all our markers, having worse mental health is correlated with finding it more challenging to receive mental healthcare, and to find information about it. Sometimes the effect is significant, p<0.05, but it is never large (the largest is a change of -0.16 in a -3 to +3 scale). This also holds if we consider an index.
10.4. By age
No effect. No effect with index, by which I mean that the coefficient is close to 0 and that the standard error is also small.
10.5. By involvement in EA.
No effect considering questions 14-15. If we consider an index, more involvement with EA is correlated with slightly better access to healthcare.
### This is an index  with the first 4 questions of our survey.
> A[,3]+((A[,4]=="No")*0 + (A[,4]=="No, but I regularly participate in an EA online group")*1 + (A[,4]=="Yes, occasionally")*2 + (A[,4]=="Yes")*3) +A[,5]+(A[,6]=="Yes")*1 -> Involvement_in_EA
> summary(lm(Index ~ Involvement_in_EA))
Coefficients:
                  Estimate Std. Error t value Pr(>|t|)
(Intercept)        0.24229    0.69103   0.351    0.726
Involvement_in_EA  0.16547    0.06625   2.498    0.013 *
---
Signif. codes:  0 ‘***’ 0.001 ‘**’ 0.01 ‘*’ 0.05 ‘.’ 0.1 ‘ ’ 1
If we disaggregate where this comes from, we see that the effect is coming from more involvement with EA being correlated EAs experiencing less financial difficulties because of mental illness, and with being more satisfied with the healthcare they get. However, this is difficult to tell, because all the factors are correlated with each other.
> summary(lm(Involvement_in_EA ~ I1 + I2 + I3 + I4 + I5))

Coefficients:
            Estimate Std. Error t value Pr(>|t|)
(Intercept)  9.78822    0.22237  44.017   <2e-16 ***
I1           0.01158    0.22948   0.050    0.960
I2           0.09307    0.20785   0.448    0.655
I3           0.16772    0.12557   1.336    0.183
I4           0.23564    0.18026   1.307    0.192
I5           0.09623    0.19526   0.493    0.623
---
Signif. codes:  0 ‘***’ 0.001 ‘**’ 0.01 ‘*’ 0.05 ‘.’ 0.1 ‘ ’ 1
D. Crucial considerations for mental health in EA.
Some of the questions asked their respondents for their thoughts, and I really appreciated some of the long and insightful answers. Here, I paraphrase and expand on some of the key ideas. I have found these comments very useful as a way to think about the problem of mental health in EA overall.
1. Selection effects in EA.
Some respondents suggested that EA attracts people with mental illnesses. Perhaps there is a snowball effect going on, perhaps it selects from demographic which have higher rates of mental illness. Thus, a particularly cost-effective way to fight mental health in EA might be to do outreach amongst people who do not have mental health issues.
This model is consistent with finding out that, among effective altruists, more effective altruism is not correlated (or correlated weakly) with better mental health (see section 3.)
2. Do mental health problems stem from EA-specific beliefs?
A respondent asked about how to deal with workaholism when your work actually matters. Some people have talked with me about how, if ideas related to existential risk are internalized, Angst might occur. Thus, for EA specific problems, therapists familiar with EA ideas might help more than regular therapists.
What follows are my own thoughts.
This model is not consistent with finding out that, among effective altruists, more effective altruism is not correlated (or correlated weakly) with better mental health (see section 3). That is, if effective altruism caused mental illness, we have lost part of the probability mass which comes from (more effective altruism -> more mental illness). Instead, only the probability mass corresponding to (if a certain level of effective altruism is reached -> more mental illness).
For a toy model, consider for example whether mental illness is caused by involvement in effective altruism and mediated by understanding x-risk, that is, suppose that understanding x-risk led to (a chance of developing) depression/anxiety and that higher levels of effective altruism led to higher chances of understanding x-risk. For example, suppose that numerical answers to "How involved are you in the EA community?", from 1 to 6 were such that: Answering 1 (not very involved) leads to a 10% probability of understanding x-risk, 2->20%, ..., 6-> 60%. Imagine then that our survey has serious selection effects (such that people with more mental illness and people more familiar with effective altruism are more likely to participate). Then the effect would be amplified by these selection effects, and we would see a correlation between effective altruism and worse mental health.
The fact that we don't is indicative of other models, like models in which EA selects for people with mental conditions.
Furthermore, maybe obsessive thoughts relating to EA are exactly like any other obsessive thoughts. Maybe minds with mental conditions / high neuroticism minds look for ideas to be depressed or anxious about, and effective altruism happens to provide some such ideas.
Crucially, the counterfactual would not be not freaking out about stuff, it would be having fixated on something else to freak out about, like American politics, climate change, sexual assault, not being lovable, chance of a civil war, etc. Pithily expressed by a person in the orbit of the EA community: "If it's not utilitarian guilt, it's feminist guilt, if it's not feminist guilt, it's kindness guilt, and so on". The content and origin of the idea being fixated on might be beside the point. Under this model, EA therapists might be counterproductive.
3. EA may not have a comparative advantage in providing mental health resources.
Either the market or other organizations, like universities or other NGOs specifically dedicated to mental health (CAMH, Zendo are mentioned, but I am not familiar with them).
4. EA France has something going on
EA France has a group in which they read Feeling Good, by David Burns. I personally have benefited from the book, and know that it's available on libgen (or a mirror, like b-ok.org).
Here is a formal invitation to EA France to talk about how the group is organized.
5. Visceral comparison with global poverty
A respondent notes that they think someone who has nothing to eat in a developing country still has it worse than someone living with depression, and that they'd rather donate a 100 euros to cure two blind people from blindness than spend it on an hour of therapy for themselves. I empathize with this, and I also like second order effects. That is, going to therapy might allow someone to earn and donate more money, and thus cure more blind people, but this depends on the specifics of how much time is saved, how much money the person makes, how much therapy costs, and how much effort it takes to organize the whole thing.
See also: Mental Health Shallow Review
6. Moral hazard.
Some people may join EA just to use these resources. Or some EAs who were paying for their therapy might choose to get it for free instead.
7. Layers of indirectness and pathways to impact.
A respondent mentions that providing mental health resources goes through two layers of indirectness: therapy may not help mental health, which may not help productivity. The comment stops here; what follows are my own thoughts.
Additionally, offering therapy does not mean that therapy is taken up, and an increase in productivity might not mean that the world will be made better.
Thinking about this further, the case for providing EAs with mental healthcare seems to rest on several distinct pathways to impact:
- Providing mental healthcare to anyone with a mental condition makes them happier, and this in itself makes the world better.
- Providing mental healthcare to effective altruists earning to give makes them work more and thus earn more money, which they then donate to effective charities, and this makes the world better.
- Providing mental healthcare to effective altruists working in really effective projects makes them more likely to succeed in their undertakings. If these undertakings succeed, this makes the world better.
- Others, like "flourishing of the community". Although its specific impact might be difficult to measure, providing mental health, together with other measures, makes the community flourish, and this leads to a better world.
With regards to pathway 1, perhaps effective altruists are not the best demographic to worry about.
With regards to pathway 2, we have a rough upwards cross-sectional estimate of 2 hours of work saved per week if satisfactory mental healthcare is provided (with a more realistic estimate being 1 hour/week). If therapy lasts one hour per week, and the therapist has to be paid for one hour, and 10% of the counterfactual gain is donated, the math doesn't check out. However, this is only indicative, and one could argue that:
- The distribution is more important than the mean. That is, the average person does not exist; we may have a small number of people who could be a lot more effective if they had mental health, and a lot of people who wouldn't benefit that much (see image below)
- This requires to argue that filtering and organizational costs are not likely to be significant. I am skeptical of this if organized centrally, and less skeptical if local EA groups organize it themselves.
- Gains because of therapy continue after therapy has ended
- As opposed to regression to the mean? That is, the gains of therapy might not be people getting better, but people getting better sooner.
- People who recover from a mental illness because of help from the EA community might not donate 10% of the counterfactual gain, but more.
- The gain is not only in the form of hours missed but in productivity gained while working.
With regards to pathway 3, it is my impression that people in top charities and EA organizations already get good mental healthcare, though about rogue effective altruists I cannot say much.
With regards to other fuzzier pathways, they would have to be outlined first.
In each of the first three cases, there are many different steps in the process of providing mental healthcare, until impact is reached. I do not think this is a case of the conjunctive fallacy, but more of a case of attrition. All in all, the whole logical model would be:
- Mental healthcare is offered to EAs.
- Some, but not all the EAs who need it apply for it.
- Some non-EAs also apply. They are somehow filtered.
- Some EAs who would have paid for healthcare out of their own pocket get it for free instead.
- Note that people with mental conditions, the limiting factor may not be money, but spoons/energy/not procrastinating.
- Mental healthcare works and improves the patient's mental health somehow.
- In pathway 1, the process ends here.
- In pathway 2, better mental health leads to a degree of higher work efficiency / more work hours -> More donations to effective charities, f.ex., GiveDirectly -> Impact pathway of GiveDirectly.
- In pathway 3, better mental health -> higher likelihood of success -> pathway to impact of the effective project. The project presumably has to be at some point assessed.
All in all, although the questions in our survey only ask about "offering mental health resources to effective altruists" in the abstract, the specific pathway to impact matters, because the several outlined here are different. In particular, if none of them work, being fuzzy about which one is in effect wouldn't help.
8. A support group for EAs with ADHD
A commenter talked about forming a support group for EAs with ADHD. Here is a formal invitation to create one.
9. Providing mental health resources is creepy
In personal conversation, a person in the outer orbit of the EA community has pointed out to me that providing mental health is creepy, and that they feel cringe when thinking about the idea. The word "cult" is mentioned. It is not implausible that providing mental health may put prospective EAs off.
10. Power law distribution
Some commenters postulated that impact among effective altruists follows a power law distribution, and that mental health might disproportionally affect those who do not have the highest impact. If that were the case, providing mental health resources to EAs might not be an effective undertaking. Other respondents were of the opinion that EA should be less elitist.
11. Cheap resources.
Whereas therapists are relatively expensive, it's relatively cheap to make Nate Soares' writings on Replacing guilt more widely known. I personally have also recently gotten some value out of Kaj Sotala's blog posts on psychological frameworks; there is a certain power in hearing other people talk about their struggles with mental conditions.
SlateStarCodex's list of mental health professionals, resources by r/raisedbynarcissists, and in particular this list of books for building your life, are free. I've personally gotten some value out of these Strategies and tools for getting through a breakup, from LessWrong. Julia Wise seems to have some useful things. The aforementioned Feeling Good, by David Burns is also free if found online (b-ok.org).
The point being that there are a lot of mental health resources and information online, if only one knew where to find them, and >10% of survey respondents answered that finding information on mental health resources was hard or very hard.
Thus, it is a high tractability, high neglectedness, medium impact task to create such a list of mental resources for the EA community, even if collated and scavenged from other sources. If such a resource already exists, plenty of respondents do not seem to know about it.


Thanks for this. A statistical note:
As best as I can tell, linear regressions are used throughout. This is not an appropriate method for when the dependent variable is binary (e.g. 'mentally ill or not'. Logistic regression should be used instead - and may find some further associations, given linear methods will intuitively be underpowered.
Thanks!
As it happens, running a logistic instead of a linear regression for 'mentally ill or not' ~ involvement in EA doesn't change the results. I'll run the others at some point.
Try with
family = "binomial"