"Consistent Growth in Donations: There has been a consistent increase in overall donations year over year, with the EA Infrastructure and Long-Term Future funds experiencing notable growth in 2021 and 2022."
@emre that's a good point but I think there is a couple things to unpack here:
1- In this particular section I am referring to the "grants" that EA Funds gives to beneficiaries and not "donations" they receive, which is what the graph you shared is referring to. If you look at the first graph, besides the drop in 2023 (data incomplete when I ran the analysis) the grants they gave followed an upward trajectory.This may be a language/semantic issue from my end as I use these interchangeably, but I'll look over the text and try to make sure this is clear.
2- The graph you shared, I am assuming it corresponds only to individual donors donating to EA funds. This is one of my suggestions for EA funds, that they could be more explicit about this on the website so the information is easier to interpret. Either way, individual donations has clearly gone down, however overly grant giving has gone up. The two most obvious explanations for this are (1) they had built up a larger cash position that is being drawn down now and (2) they are receiving or have received more institutional funding that isn't represented in that graph.
Re 2: Yes this is correct. It does not include institutional funds. I'm also not sure if it includes non-cash donations from individuals either; I think the dashboard was created back when there was only one way to donate to EA Funds. I'll check.
The dashboard includes all individual giving through Giving What We Can, which is a partner of EA Funds that offers the public frontend that most people who want to donate to EA Funds see.
Some of individual donors to the different funds, particularly the largest ones, choose to donate to various funds within EA Funds through other ways, eg every.org or more idiosyncratic ways (which we're more willing to work with for larger donors).
We don't currently have a public dashboard to expose all of our donations, unfortunately.
Awesome work Ricardo! And take even more applause for making the code open source!!!
Minor correction, both on the website and on the Grant Database CSV they provide, the numbers I have don't quite match yours? It especially seems to undercount GH&D, they seem to have made two funds in 2023 totalling £3.35m, and 8 in 2022 totalling £11.14m. Maybe they've updated this since you extracted your data, or perhaps there's some difference between the csv and the endpoint you requested data from? Or maybe you apply a filter in your code that removes them accidentally?
I think that's probably a point EA Funds could do, is say when the grant database is fully up-to-date historically with what has been granted.
They probably updated the information. I ran the original analysis in early December but delayed publishing due to a request from EA funds as they wanted to update the database.
Agreed that knowing when the last update was made helps to understand what is being reflected on the websites.
Thank you Ricardo, this is an insightful analysis.
I'd like to see more EA Forum posts with this level of investigation invested into them.
In particular, the balance of more longtermist and less global health funding is in contrast with other analyses on the forum.
I think your write-up could be improved more than the underlying analysis.
To make this more accessible to others, and your work higher impact, I'd recommend the following.
Include your most important takeaways, and less information on your methods (eg the link to the notebook) in the tl;dr. Very few of your readers will have the time to dig into your code, and those who do are also likely to read the whole post. Almost all your readers want to know about your conclusions though.
Relatedly, your conclusions are quite meta (eg the stats page could be clearer), but don't highlight your important findings (eg: 2023 had a lot less money distributed, GHD is declining and LTFF is increasing).
For reference, the GHDF has now updated the amounts they granted in 2022 and 2023. On December 20, in agreement with your analysis, the amounts granted in 2022 and 2023 were 4.8 and 0 M$, whereas now they are 11 and 3.4 M$.
@calebp, I wonder why the amount granted in 2022 took 1 year to be updated to the correct value. It is also the case that it was not flagged in the website that the amount for 2022 had yet to be updated.
Global Health & Development Fund: Despite the general uptick in 2022, the GH&D Fund did not share in this surge and has yet to distribute any grants in 2023.
I think some of the growth from 2020 to 2022 was due to the FTX Foundation. Since FTX increased overall funding, Open Phil could also grant more to EA Funds. However, there was no growth in the GH&D fund because it has traditionally been majorly supported by direct donations. Open Phil still increased their funding of the area of GH&D by increasing their grants to GiveWell. Open Phil said the following in November 2021:
Today we are excited to announce our largest-to-date support for GiveWell’s recommendations: $300 million for 2021, up from $100 million last year, with tentative plans[1] to donate an additional $500 million per year in 2022 and 2023.
The growth plans did not materialise partly due to the collapse of FTX.
For what it's worth my guess is that a key reason people aren't giving as much to our GH&D fund is due to the influx of healthy competitors. Ie, it's not offering much of a differentiated product from what people could get elsewhere. I haven't interviewed our donors about this so I can't be sure, but my impression is that when the GH&D fund first launched, there weren't any plausible competitors for donors for the niche of "I want to figure out my own cause prioritization, but I want to defer to external experts to source and prioritize interventions and projects." But these days GiveWell manages a number of their own funds (as opposed to "just" writing up public recommendations for charities to suggest people give to), Giving What We Can has their own Global Health&Wellbeing fund, etc.
In contrast, EA Funds' other funds still retain an edge as arguably being the default place to donate to for those cause areas, for a reasonable subset of engaged donors.
Let its donors know that donating to GHDF in its current form has a similar effect to donating to AGF (if that is in fact the case).
Consider appointing additional fund managers independent from GiveWell.
Consider accepting applications.
In any case, the goal of this post is mostly about starting a discussion about the future of GHDF rather than providing super informed takes about it. So feel free to share your thoughts or vision below!
However, GiveWell’sAll Grants Fund was only launched in August 2022, GWWC's Global Health and Wellbeing Fund was only launched in late 2023, and there might be some lag between decreased donations and decreased grants, so I do not think new competitors alone could explain GHDF's 52 % (= 1 - 4.8/10) decrease in grants from 2021 to 2022 reported by Ricardo.
Importantly, GHDF has now updated the amounts they granted in 2022 and 2023. On December 20, in agreement with Ricardo's analysis, the amounts granted in 2022 and 2023 were 4.8 and 0 M$, whereas now they are 11 and 3.4 M$. I wonder why the amount granted in 2022 took 1 year to be updated to the correct value.
I came across EA Funds and wanted to understand better what they were granting and how.
I wanted my analysis to be replicable so decided to do everything in Python (assisted by chatGPT-4) and make it open-source. The Google Colab notebook used for data analysis can be found here.
While my insights might not be new to those more familiar with the Effective Altruism community, I found that visualizing the data really deepened my understanding of how the funds operate
I also share some (personal) suggestions for the EA Funds team on enhancing the clarity of their grantmaking activity.
Note: Data analyzed is from December 2023, so this may have been updated already
Intro & Personal Motivation
The objective of this post will be to have a high-level overview of what EA Funds is supporting with its grantmaking activity.
As someone fairly new to the Effective Altruism community, I found myself navigating the complex landscape of various EA organizations, each with its unique focus and approach to grant-making. I was quite familiar with OpenPhil's broad and ambitious 'hits-based' approach across multiple cause areas; GiveWell's deep commitment to supporting evidence-based projects; and Giving What We Can 's mission to get more people to take the pledge to give 10% or more of their life-time income to effective causes and charities.
However, I wasn't too familiar with EA Funds itself and its work when I came across the organization recently. After reading various sections of the website, I decided the best way to understand their work was to look at a snapshot of what actually is being funded. Thankfully, they have a public database that one can quickly access.
I wanted this analysis to be useful for the wider EA community so I decided to share my findings in this post. I also wanted the analysis to be replicable (now and in the future) by anyone that had the same curiosity about EA Funds' grants. To achieve this, I embraced the challenge of conducting the analysis using Python, with help from ChatGPT 4.0, and made it open-source.
Please feel free to offer any feedback, be it about my code, my reasoning, or my writing style. And a quick heads-up: I don't have much experience in Python , so the coding might be a bit rough around the edges. I prioritized functionality over elegance, so the code does its job but it might not be the neatest.
Data Analysis
Chart set #1
Assessing total grant amount per year per fund.
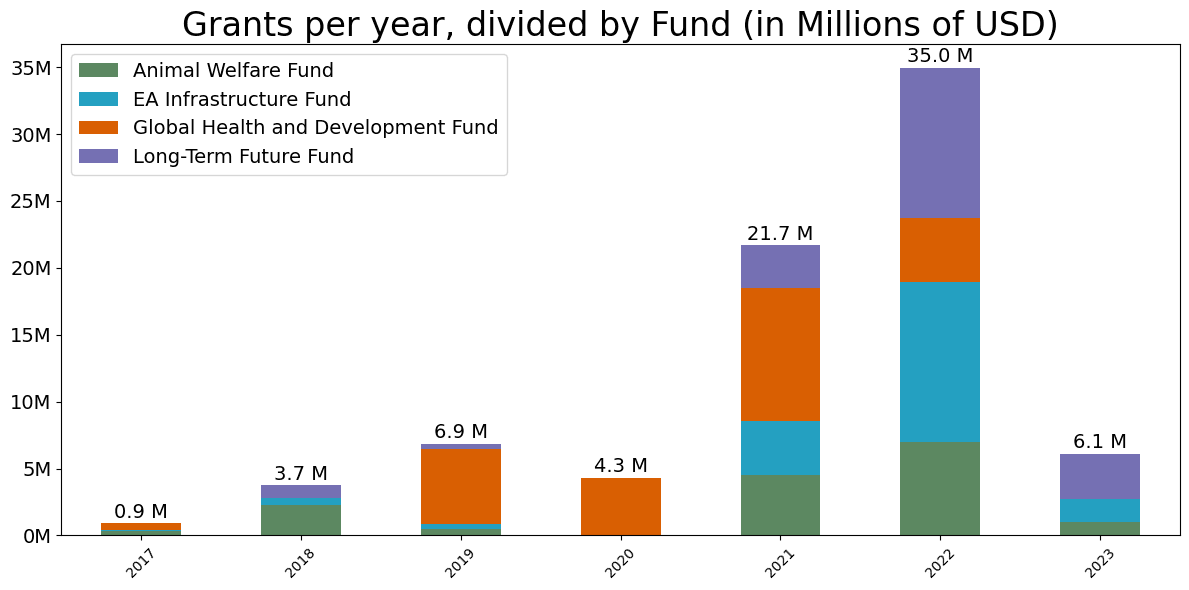
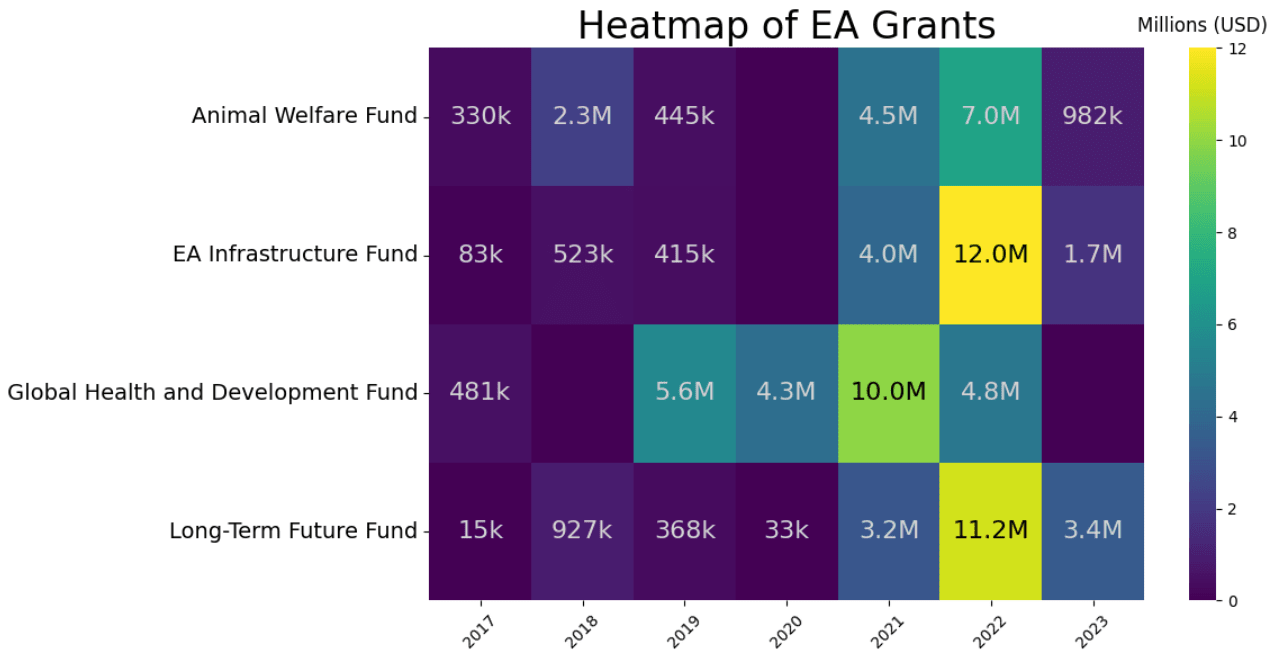
By delving into the public EA Funds grants database, we can track the progression of grant disbursements across the four primary focus areas: Global Health & Development, Animal Welfare, Long-Term Future and EA Infrastructure.
From the graphs above. my first high-level observations were:
Consistent Growth in Donations: There has been a consistent increase in overall donations year over year, with the EA Infrastructure and Long-Term Future funds experiencing notable growth in 2021 and 2022.
A Quiet Year in 2023: In contrast to this growth, 2023 has seen a marked reduction in grant disbursements across the board.
Global Health & Development Fund: Despite the general uptick in 2022, the GH&D Fund did not share in this surge and has yet to distribute any grants in 2023.
Most of these things might be more readily explained by people who have more knowledge about the Effective Altruism movement, but my best explanation for these three points were the following:
The EA Infrastructure & Long-Term Future Funds have historically received substantial institutional support (from OpenPhil & others) relative to the other two funds that are mainly funded through direct donations. Regarding the spike in 2021/2, this post on organizational update on EA Funds attributes some of that to tech stocks / crypto boom.
Note the same post highlighted these funds are anticipated to have less available funding due to changes in their funding mechanisms.
The lack of grants in 2023 is most likely due to information lag, as grant data is probably not uploaded continuously. [1] Even so, I found it quite strange to have such little grant information for 2023 considering I am running this analysis in mid Dec. 2023.
Chart set #2
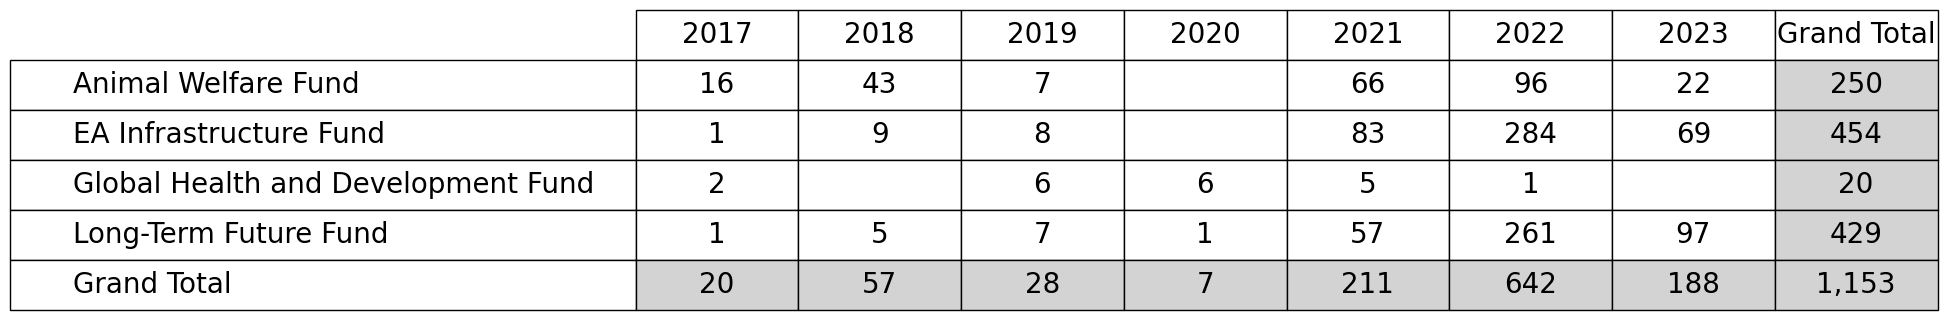
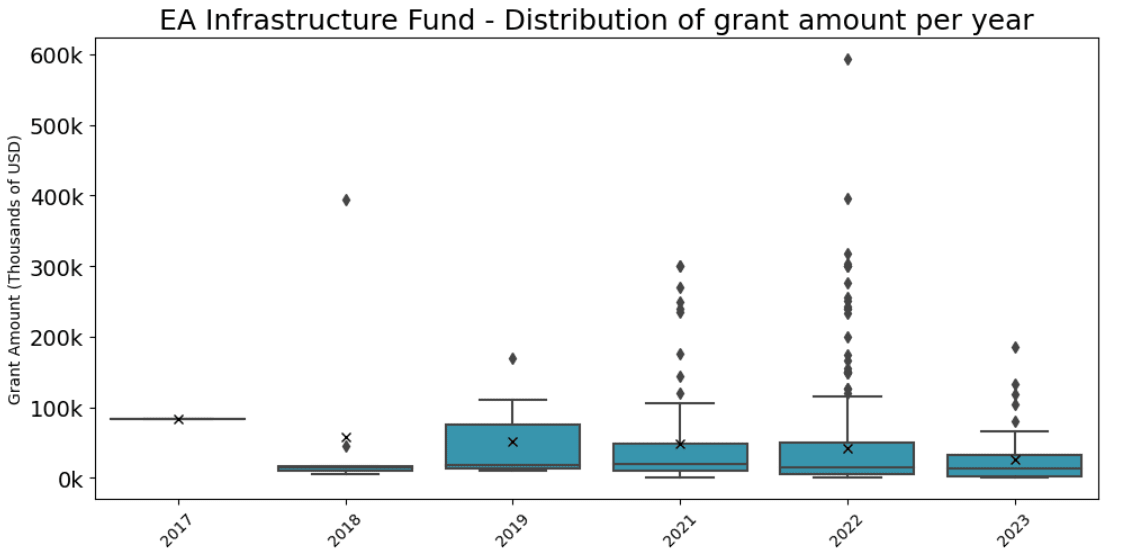
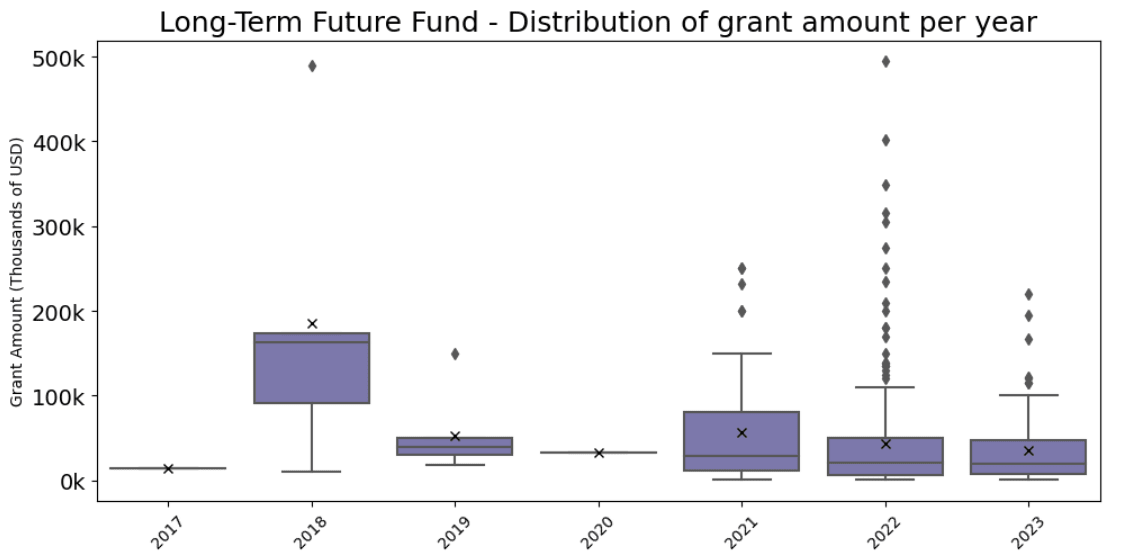
Assessing number of grants over time & distribution of grant amounts per fund per year.
To continue my understanding of the funding landscape, I turned to the volume and distribution of grants doled out over time within each fund. This helps to discern any trends or patterns in grant-making behavior. [2]
Note: This image shows how to interpret box and whisker plots that follow.
EA Infrastructure and Long-Term Future Funds: These funds stand out with a higher total number of grants, which predominantly fall in the lower hundreds of thousands. Yet, they also exhibit a noteworthy number of outliers, indicating sporadic grants of much larger amounts.[3]
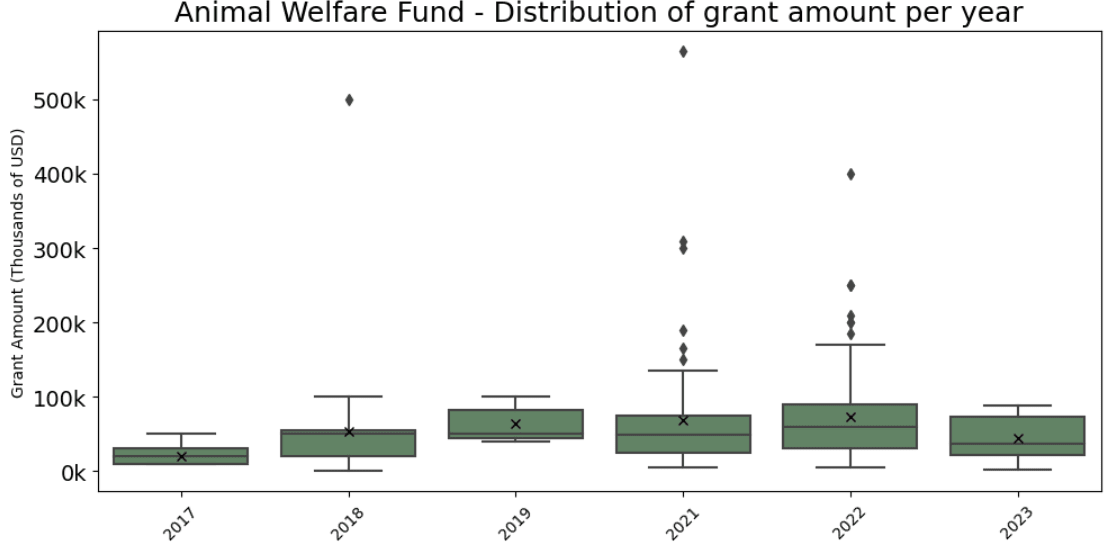
Animal Welfare Fund: This fund has approximately half the number of grants compared to the above-mentioned funds. Its distribution also skews towards the lower thousands, but it presents fewer outliers, suggesting a more consistent grant size.
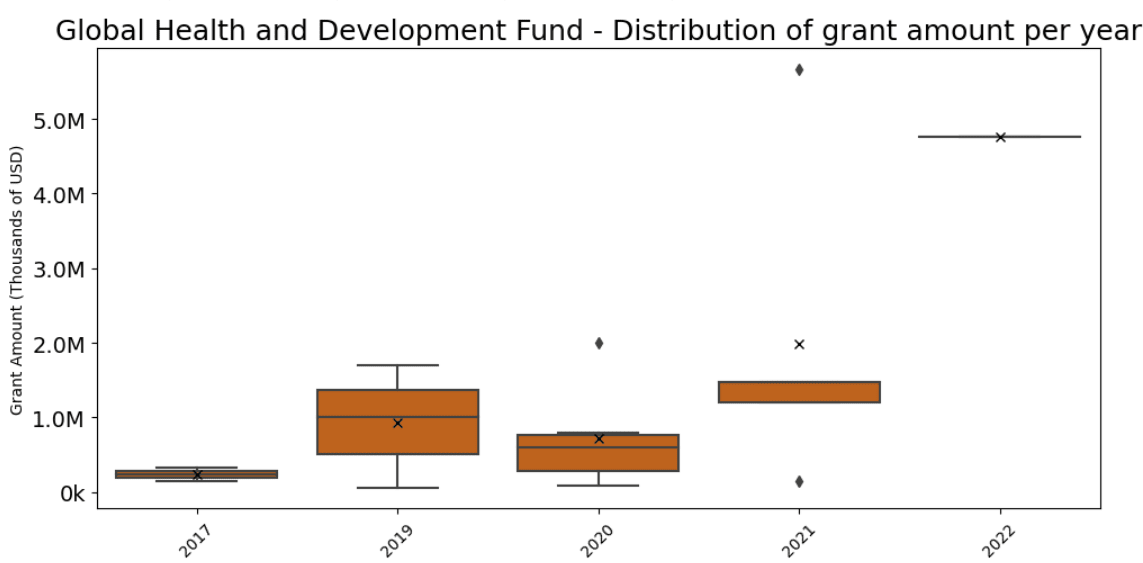
Global Health & Development Fund: Exhibiting a unique pattern, this fund issues fewer grants, but those it makes are of very high value. Given the small dataset, a box and whisker plot offers limited insight, but it's included to maintain analytical consistency.
The above charts helped explain a bit more about the logic of grantmaking for each EA Fund, and I would argue that this is in accordance with the operational logic of each fund, considering their specific mandates, risk appetites, and the background of their fund managers.[4]
The Global Health & Development space has a much more robust evidence base, so the focus is supporting highly effective and established organizations. These organizations are probably flagged by the GiveWell staff, given that they manage the fund, who most likely conduct extensive research into each organization before deciding on any specific grant. This can reasonably justify a couple of large grants into a limited number of grantees.
The Long-Term Funds & EA Infrastructure funds are mainly field-building funds, focusing on early-stage organizations, individuals or research. Therefore, a much more scattered 'hits-based approach' is likely justifiable.
The Animal Welfare fund sits somewhere in between these two categories, supporting a mix of early-stage and established organizations, as well as advocacy groups or campaigns.
Chart set #3
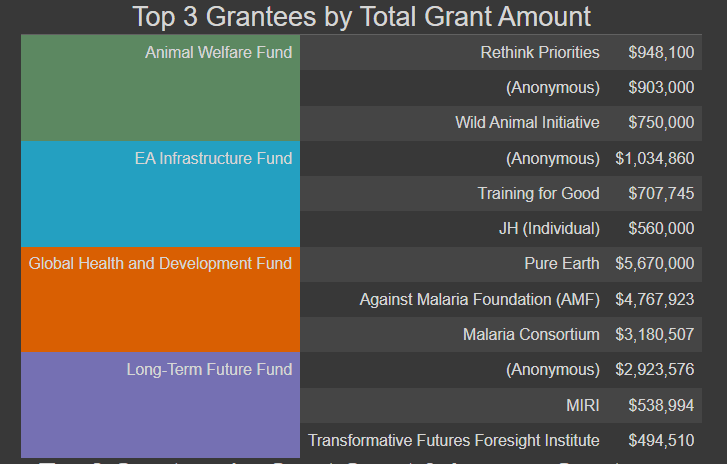
Assessing top grantees & a (basic) keyword analysis of grant descriptions
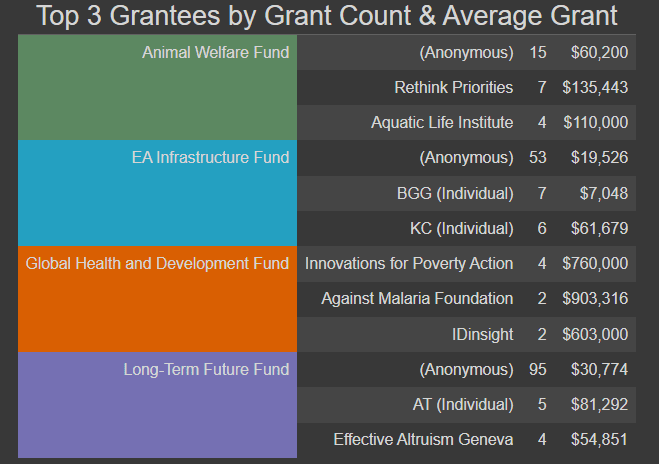
Understanding the "who" and "what" behind the grants can shed light on the strategic priorities of EA Funds. To this end, I explored the leading grantees in two ways: first, by the total amount of funding they received, and second, by the number of grants awarded, noting the average size of these grants.[5]
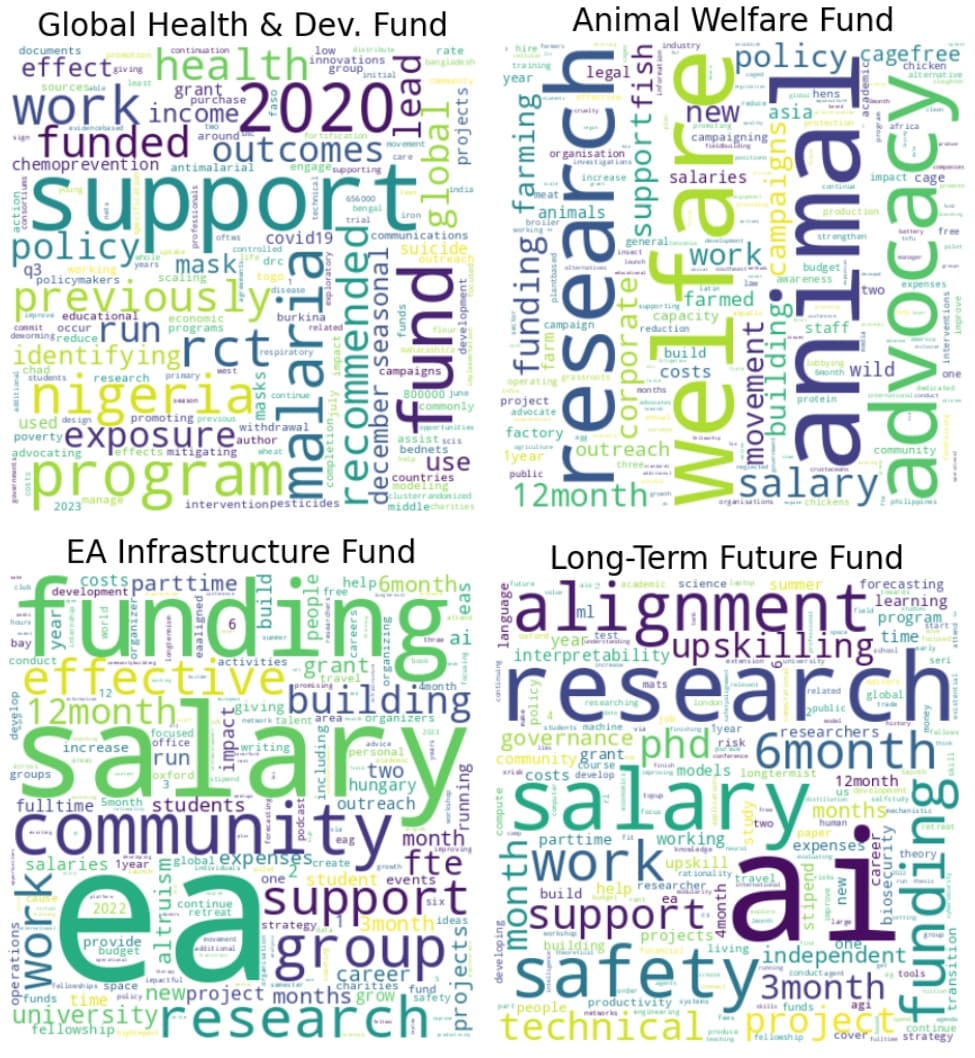
Delving into the grant descriptions, a keyword analysis was conducted to parse out common themes.
Perhaps unsurprisingly, the top grantees & keyword analysis revealed patterns that mirror the strategic directions of the respective funds.
EA Funds Stats
While much of the information I've discussed can be pieced together from the EA Grants website, visualizing the grant data through charts has been instrumental in connecting the dots about the grantmaking strategies of fund managers.
Nevertheless, I remained curious whether the apparent decrease in grants for 2023 could be entirely attributed to an information gap. For this, I turned to the (incoming) Donations charts and the Payouts charts at EA Funds' website.
"Donations" (into each specific EA Fund), albeit lower in 2023 than the previous 3 years, was roughly in line with $2M-$5M collected in almost every fund. So, the drop in payouts in 2023 (or the large increases in 2022) wasn't explained by this alone.
This also came with the realization that these graphs were most likely only showing private donations and not including institutional donations.
"Total grants" in 2023 on their website are marginally higher than what my analysis indicated, suggesting the public database might have a delay over their own internal systems.
The final graph that caught my attention was EA Funds "Fund Balance [across all funds]" which states that that fund balance as of Dec. 2023 seems to be roughly where it began the year. I interpreted this to mean that they should be granting at more or less the same rate at which they are receiving donations.[6]
If the final part is true, I would expect total grants in 2023 to be within the $15M - $20M range.[7]
Conclusions
After sifting through the data and sharing the insights, here are my key takeaways and some suggestions for the EA Funds team:
Much of the analysis might resonate with those already acquainted with EA Funds, yet it's a valuable reinforcement of what's known and an update on recent trends.
While 2023 seems to be trailing slightly behind the high marks of 2021 and 2022, the overall trajectory for EA Funds suggests sustained growth in funding and grant distribution.
I feel the EA Funds team effectively presents general statistics, particularly the inflow of donations. However, a concise depiction of what grants are being made and their recipients could further enhance transparency.
The stats page would benefit from more detailed descriptions, such as clarifying that "Donations" reflect private contributions, not institutional funding.
With expected shifts in institutional funding, timely updates to the stats page could inform stakeholders of these changes, even something as simple as referencing the EA Forum post in the description at the top.
Publicizing a (tentative) schedule for updating grant information could greatly aid in setting expectations and ensuring data timeliness.
Considering EA Funds is one of the more public-facing EA organizations, I found there to be a noticeable scarcity of quantifiable outcomes or projected impacts for the funds.
This observation is extremely nuanced as I have conflicting views on this[8], but given EA Funds flagged they will need to spend more time fundraising, this may well be a good way to attract potential donors.
As someone new to the EA community, the overlap in initiatives, especially in well-established areas like Global Health & Development, prompts curiosity about the potential for more strategic coordination or complementary efforts.[9]
Possible follow-ups on this post:
Visual Enhancements: Improving the aesthetics of the data visualizations and considering interactive elements could make the information more engaging and accessible.
Advanced NLP Analysis: A deeper dive into grant descriptions using Natural Language Processing could reveal more nuanced insights into funding patterns and priorities.[10]
Code clean-up: There's room to refine the Python code used for analysis, eliminating redundancies, and enhancing its adaptability to database updates.
Thank you @Vasco Grilo for your feedback & comments.
I also looked at total grant amounts by quarter for every year to see if I found any particular pattern, the reasoning being that some fund managers might have focused grants in a specific quarter for operational reasons or because of the nature of their work. I noticed a slightly higher Q1 & Q4, making me wonder if this is "year-end" pressure for Q4 and a residual of some grants being dragged to Q1. Nonetheless, I didn't spot a clear trend for this, so I have excluded this from my analysis.
Outliers are data points that fall above the 3rd quartile plus 1.5 times the Interquartile Range (IQR), or below the 1st quartile minus 1.5 times the IQR, where IQR is the difference between the 3rd and 1st quartiles. For more information on how to interpret these graphs see this post from Tableau.
I mention some of the most high-level aspects of each fund that are more relevant to my analysis, but for anyone curious to learn more, I recommend going the EA Funds website and clicking on \"Learn More\" for each fund where you can find a more detailed description (example for Global Health & Development Fund)
I don't feel comfortable posting individual's names here as it isn't the objective of this post. I am just showing (Anonymous) when the code flags an individual's name.
The year started at $6.5M (Dec 31st, 2022) and is currently at $8,6M. Although this is a substantial increase, my argument is that it is marginal compared to the $10M+ raised by private donors alone.
This is a very simple guestimate considering total private donations (inflows) in 2023, accounting for a boost given institutional donors and correcting for the fact that their own post from August suggests that the dynamic of with some of their funders will change and that the Long-Term Future & EA Infrastructure will be underfunded in their view (so likely below 2022). Although I am only 70% confident in this range.
For Global Health & Development, this outcome disclosure is done indirectly by referencing the reports by grantees. Given this is one of the funds with more robust evidence-base, I feel the direct impact could be better communicated.
For the other funds, I couldn't find any outcomes, but they appear to do a more detailed write-up of their grants in their Payout Reports section. For the more field/community building funds, I understand this visibility request is (a) harder to define & (b) less useful. However, a retrospective focusing on outcomes (with a reasonable delay) is useful to help guide strategic positioning.
I generally agree with the EA Funds posture of empowering fund managers to have reasonable autonomy when it comes to certain areas (same logic as described in Open Philanthropy ) as I believe for early-stage projects speed for and lower number of touch points is better for projects that extensive oversight. I believe this empowerment would also mean they don't need an extensive grant write up for every single grant, but a certain criteria of when & when not to write up might help, given again, they are highly dependent on individual donors.
I've read some of the push-back faced when it was announced public reports were now optional for grantees; however, I feel that given the scope of the funds and the nature of their work, this wouldn't affect the transparency the funds were already showing. My reasons being (i) all grants as being published in grants database; (ii) anonymous grants despite being a high-number of grants, are also subject to disclosure of what is being funded and why; (iii) for most funds except for LTFF they still represent less than 10% of total grants.
I agree that different approaches to the same problem are generally beneficial, but I am curious if in more established areas like Global Health & Development, a better coordination or complementary approach can be achieved to be more efficient.
I guess the relevance of using a importance, tractability & neglected (ITN) framework in this cause selection is that even if this is 50% as effective, it's still much better than being 90% effective in a less pressing area.
This could include a sentiment analysis of grant descriptions or results. Note that the payout report formats and what is listed varies by fund, so any future analysis will need to take this into consideration. I have less conviction on the usefulness of this analysis as across different funds given their different scopes. I see this as slightly more valuable if one were analyzing a specific fund although I am also skeptical this would yield any actionable information for the general public.
AI Use Note: Main body text entirely human written. Claude (Opus 4.8) helped develop models of animal life histories in the appendix.
Cross-posted from Good Structures.
Executive Summary
* Animal advocates sometimes make claims like “there are X of this animal...
“How long have you been v*g*n?”
This is one of the most common icebreakers at animal protection events. It’s a baseline assumption, and it mostly holds true: if you’re out advocating for animals not to be tortured or abused, realistically these days you are v**n, or close. And it makes for good conversation. It seems fairly safe to assume when you meet strangers.
But this assumption is hurting the movement in a way which we don’t always notice: someone new comes into the sp...
Summary
Back in November 2023 I posted here to launch Spiro and raise our first $198k. Two and a half years later this is an update and a fundraiser for the next step.
The short version: we've now reached over-5,900 people with TB preventive medicine, including over 3,000 children under five years old. Our early results have held up well an...

"Consistent Growth in Donations: There has been a consistent increase in overall donations year over year, with the EA Infrastructure and Long-Term Future funds experiencing notable growth in 2021 and 2022."
This doesn't seem right to me. Data from EA Funds dashboard:
@emre that's a good point but I think there is a couple things to unpack here:
1- In this particular section I am referring to the "grants" that EA Funds gives to beneficiaries and not "donations" they receive, which is what the graph you shared is referring to. If you look at the first graph, besides the drop in 2023 (data incomplete when I ran the analysis) the grants they gave followed an upward trajectory.This may be a language/semantic issue from my end as I use these interchangeably, but I'll look over the text and try to make sure this is clear.
2- The graph you shared, I am assuming it corresponds only to individual donors donating to EA funds. This is one of my suggestions for EA funds, that they could be more explicit about this on the website so the information is easier to interpret. Either way, individual donations has clearly gone down, however overly grant giving has gone up. The two most obvious explanations for this are (1) they had built up a larger cash position that is being drawn down now and (2) they are receiving or have received more institutional funding that isn't represented in that graph.
(I work for EA Funds)
Re 2: Yes this is correct. It does not include institutional funds. I'm also not sure if it includes non-cash donations from individuals either; I think the dashboard was created back when there was only one way to donate to EA Funds. I'll check.
(Thanks for your hard work on the post btw!)
Quick update: