I wonder how these compare with fitting a Beta distribution and using one of its statistics? I’m imagining treating each forecast (assuming they are probabilities) as an observation, and maximizing the Beta likelihood. The resulting Beta is your best guess distribution over the forecasted variable.
It would be nice to have an aggregation method which gave you info about the spread of the aggregated forecast, which would be straightforward here.
It's not clear to me that "fitting a Beta distribution and using one of it's statistics" is different from just taking the mean of the probabilities.
I fitting a beta distribution to Metaculus forecasts and looked at:
Median forecast
Mean forecast
Mean log-odds / Geometric mean of odds
Fitted beta median
Fitted beta mean
Scattering these 5 values against each other I get:
We can see fitted values are closely aligned with the mean and mean-log-odds, but not with the median. (Unsurprising when you consider the ~parametric formula for the mean / median).
The performance is as follows:
brier
log_score
questions
geo_mean_odds_weighted
0.116
0.37
856
beta_median_weighted
0.118
0.378
856
median_weighted
0.121
0.38
856
mean_weighted
0.122
0.391
856
beta_mean_weighted
0.123
0.396
856
My intuition for what is going on here is that the beta-median is an extremized form of the beta-mean / mean, which is an improvement
Looking more recently (as the community became more calibrated), the beta-median's performance edge seems to have reduced:
For a quick foray into this we can see what would happen if we use our estimate the mean of the max likelihood beta distribution implied by the sample of forecasts p1,...,pN.
The wikipedia article on the Beta distribution discusses this maximization problem in depth, pointing out that albeit no closed form exists if α and β can be assumed to be not too small the max likelihood estimate can be approximated as ^α≈12+^GX2(1−^GX−^G1−X) and ^β≈12+^G1−X2(1−^GX−^G1−X), where GX=∏ip1/Ni and G1−X=∏i(1−pi)1/N.
The mean of a beta with these max likelihood parameters is ^α^α+^β=(1−G1−X)(1−GX)+(1−G1−X).
By comparison, the geometric mean of odds estimate is:
p=∏Ni=1p1/Ni∏Ni=1p1/Ni+∏Ni=1(1−pi)1/N=GXGX+G1−X
Here are two examples of how the two methods compare aggregating five forecasts
I originally did this to convince myself that the two aggregates were different. And they seem to be! The method seems to be close to the arithmetic mean in this example. Let's see what happens when we extremize one of the predictions:
We have made p3 one hundred times smaller. The geometric mean is suitable affected. The maximum likelihood beta mean stays close to the arithmetic mean, unperturbed.
This makes me a bit less excited about this method, but I would be excited about people poking around with this method and related ones!
How would you aggregate forecasts for extinction risk, spanning many orders of magnitude, which are based on fitting the same data to different probability distributions? I suspect your diagram would suggest using the mean, as each distribution relies on mutually exclusive assumptions, but I am not confident. I am asking in the context of this and this analyses, where I used the median (see discussion). Feel free to share your thoughts there.
Interesting case. I can see the intuitive case for the median.
I think the mean is more appropriate - in this case, what this is telling you is that your uncertainty is dominated by the possibility of a fat tail, and the priority is ruling it out.
I'd still report both for completeness sake, and to illustrate the low resilience of the guess.
Thanks for the feedback! I am still standing by the median, but it would be nice to empirically investigate similar cases, and see which method performs better!
Thanks for this post - I think this was a very useful conversation to have started (at least for my own work!), even if I'm less confident than you in some of these conclusions (both because I just feel confused and because I've heard other people give good-sounding arguments for other conclusions).
In the two large scale empirical evaluations I am aware of [1][2], it surpasses the mean of probabilities and the median (*).
But it seems worth noting that in one of those cases the geometric mean of probabilities outperformed the geometric mean of odds.
You later imply that you think this is at least partly because of a specific bias among Metaculus forecasts. But I'm not sure if you think it's fully because of that or whether that's the right explanation (I only skimmed the linked thread). And in any case the basic fact that geometric mean of probabilities performed best in this dataset seems worth noting if you're using performance in that dataset as evidence for some other aggregation method.
Thanks for this post - I think this was a very useful conversation to have started (at least for my own work!), even if I'm less confident than you in some of these conclusions
Thank you for your kind words! To dismiss any impression of confidence, this represents my best guesses. I am also quite confused.
I've heard other people give good-sounding arguments for other conclusions
I'd be really curious if you can dig these up!
You later imply that you think [the geo mean of probs outperforming the geo mean of odds] is at least partly because of a specific bias among Metaculus forecasts. But I'm not sure if you think it's fully because of that or whether that's the right explanation
I am confident that the geometric mean of probs outperformed the geo mean of odds because of this bias. If you change the coding of all binary questions so that True becomes False and viceversa then you are going to get worse performance that the geo mean of odds.
This is because the geometric mean of probabilities does not map consistently predictions and their complements. With a basic example, suppose that we have p1=0.01,p2=0.3. Then √p1∗p2+√(1−p1)∗(1−p2)≈0.89<1.
So the geometric mean of probabilities in this sense it's not a consistent probability - it doesn't map the complement of probabilities to the the complement of the geometric mean as we would expect (the geometric mean of odds, the mean of probabilities and the median all satisfy this basic property).
So I would recommend viewing the geometric mean of probabilities as a hack to adjust the geometric mean of odds down. This is also why I think better adjustments likely exist, since this isn't a particularly well motivated adjustment. It does however seem to slighly improve Metaculus predictions, so I included it in the flowchart.
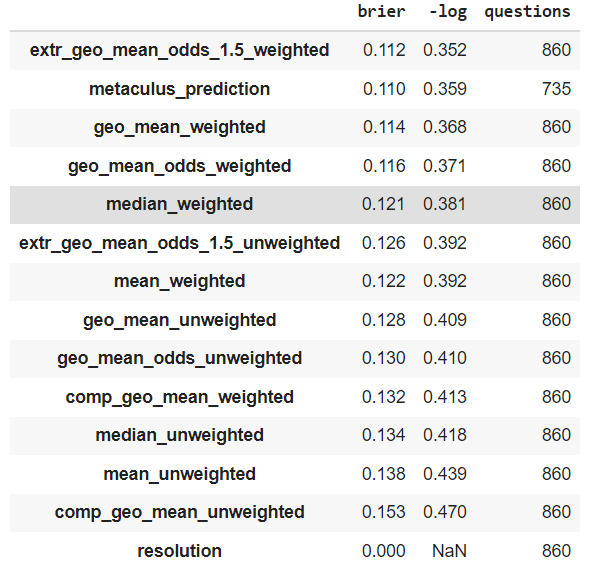
To drill this point even more, here is what we would get if we aggregated the predictions in the last 860 resolved metaculus binary questions by mapping each prediction to their complement, taking the geo mean of probs and taking the complement again:
The complement of the geometric mean of complement probabilities is called comp_geo_mean
As you can see, this change (that would not affect the other aggregates) significantly weakens the geo mean of probs.
I found some revelant discussion in the EA Forum about extremizing in footnote 5 of this post.
The aggregation algorithm was elitist, meaning that it weighted more heavily forecasters with good track-records who had updated their forecasts more often. In these slides, Tetlock describes the elitism differently: He says it gives weight to higher-IQ, more open-minded forecasters. The extremizing step pushes the aggregated judgment closer to 1 or 0, to make it more confident. The degree to which they extremize depends on how diverse and sophisticated the pool of forecasters is. The academic papers on this topic can be found here and here. Whether extremizing is a good idea is controversial; according to one expert I interviewed, more recent data suggests that the successes of the extremizing algorithm during the forecasting tournament were a fluke. After all, a priori one would expect extremizing to lead to small improvements in accuracy most of the time, but big losses in accuracy some of the time.
The post in general is quite good, and I recommend it.
If you are not aggregating all-considered views of experts, but rather aggregating models with mutually exclusive assumptions, use the mean of probabilities.
Models can have more or less mutually exclusive assumptions? I guess the less they do, the more it makes sense to rely on the median or geometric mean of odds instead of the mean. In practice, how do you decide? I am asking following a discussion about how to aggregate welfare ranges.
In addition, there is not a strong distinction between all-considered views and the outputs of quantitative models, as the judgements of people are models themselves. Moreover, one should presumably prefer the all-considered views of the modellers over the models, as the former account for more information?
(speculating) The key property you are looking for IMO is to which degree people are looking at different information when making forecasts. Models that parcel reality into neat little mutually exclusive packages are more amenable , while forecasts that obscurely aggregate information from independent sources will work better with geomeans.
In any case, this has little bearing on aggregating welfare IMO. You may want to check out geometric rationality as an account that lends itself more to using geometric aggregation of welfare.
Do you have any thoughts on the best way to aggregate forecasts of quantities which are not between 0 and 1 (e.g. global number of deaths during 2030)?
Depends on whether you are aggregating distributions or point estimates.
If you are aggregating distributions, I would follow the same procedure outlined in this post, and use the continuous version of the geometric mean of odds I outline in footnote 1 of this post.
If you are aggregating point estimates, at this point I would use the procedure explained in this paper, which is taking a sort of extremized average. I would consider a log transform depending on the quantity you are aggregating. (though note that I have not spent as much time thinking about how to aggregate point estimates)
I am aggregating arrays of Monte Carlo samples which have N samples each. There is a sense in which each sample is one point estimate, but for large N (I am using 10^7) I guess I can fit a distribution to each of the arrays.
Without more context, I'd say that fit a distribution to each array and then aggregate them using a weighted linear aggregate of the resulting CDFs, assigning a weight proportional to your confidence on the assumptions that produced the array.
This is the third in a sequence of posts taken from my recent report: Why Did Environmentalism Become Partisan?
Summary
Rising partisanship did not make environmentalism more popular or politically effective. Instead, it saw flat or falling overall public opinion, fewer major legislative achievements, and fluctuating executive actions.
Public Opinion...
This post presents the executive summary from Giving What We Can’s impact evaluation for 2025. At the end of this post we share links to more information, including the full report and...
Why building and backing Welfare Tech companies may be one of the most promising things we can do for billions of animals.
I used AI to assist in writing this post, but I’ve rewritten it extensively and endorse it.
* Announcing the launch of Spring Innovation Fund, a not-for-profit venture philanthropy studio and fund built specifical...
In short: I still recommend using the geometric mean of odds as the default aggregation method, but I give my best guess on exceptions to this rule.
Since writing about how the geometric mean of odds compares to other forecasting aggregation methods I have received many comments asking for a more nuanced approach to choosing how to aggregate forecasts. I do not yet have a full answer to this question, but here I am going to outline my current best guess to help people with their research and give a chance to commenters to prove me wrong.
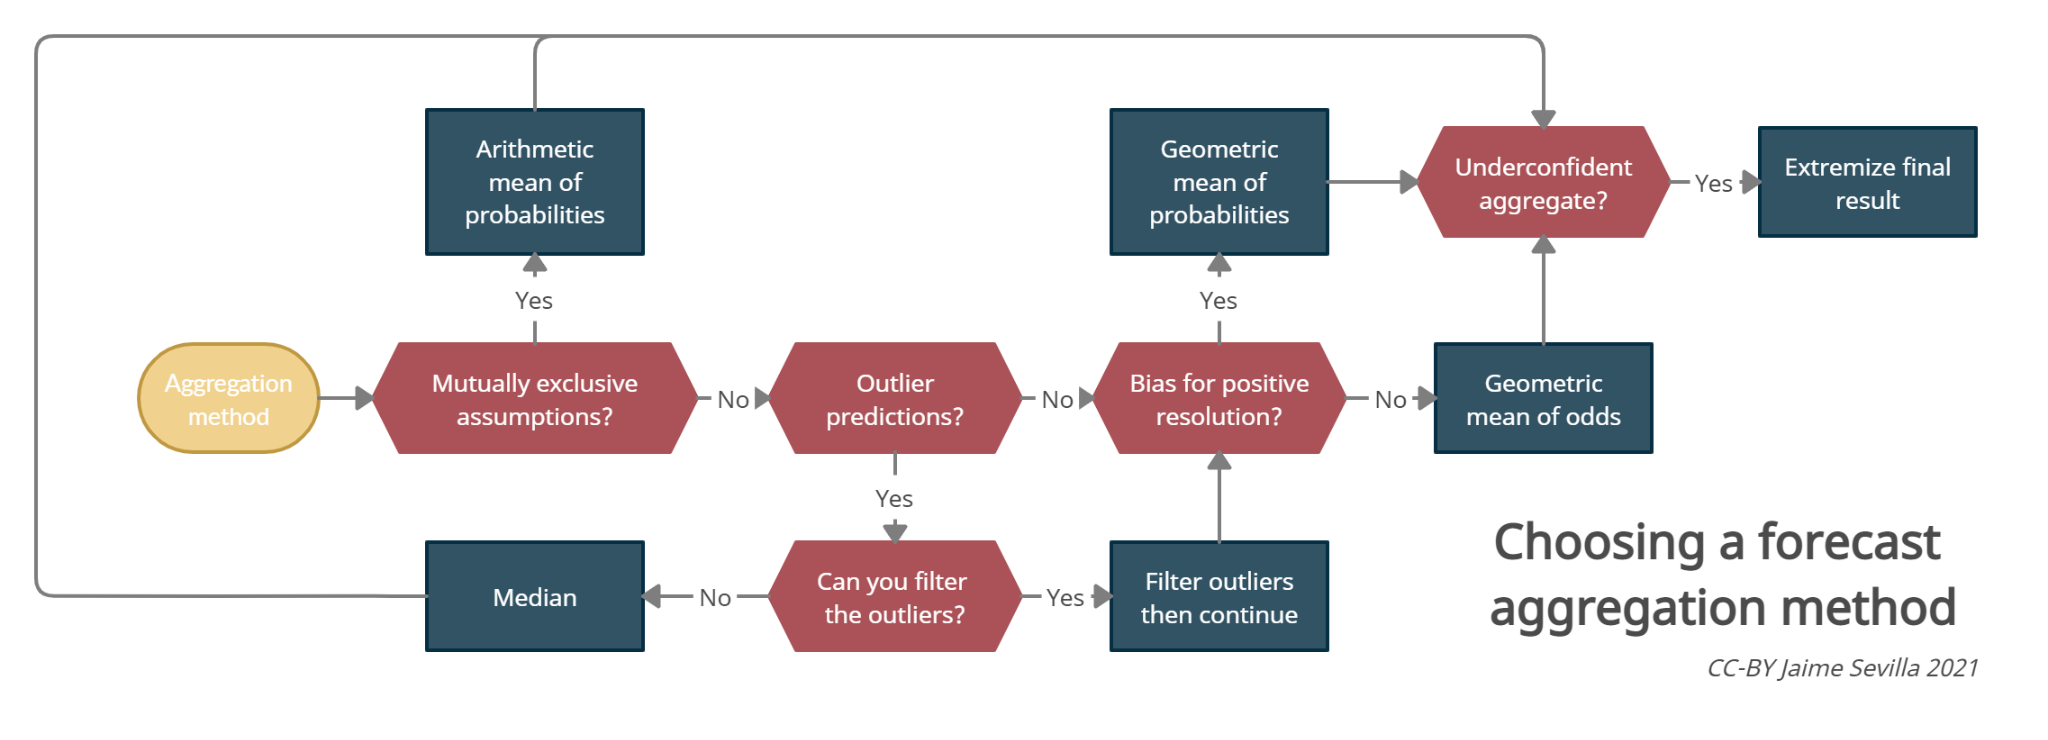
In short, here is my current best guess in the form of a flowchart:
Flowchart to choose a forecast aggregation method. Start from the yellow box and follow the arrows. You can right click the image and select "open image in new tab" for a bigger version.
Some explanations are in order:
I currently believe that the geometric mean of odds should be the default option for aggregating forecasts. In the two large scale empirical evaluations I am aware of [1][2], it surpasses the mean of probabilities and the median (*). It is also the only method that makes the group aggregate behave as a Bayesian, and (in my opinion) it behaves well with extreme predictions.
If you are not aggregating all-considered views of experts, but rather aggregating models with mutually exclusive assumptions, use the mean of probabilities. For example, this will come up if you first compute your timelines for Transformative AI assuming it will be derived from transformer-like methods, and then assuming it will come from emulated beings, etc. In this case, P(Event)=P(Assumption1)P(Event|Assumption1)+P(Assumption2)P(Event|Assumption2)+....
When the data includes poorly calibrated outliers, if it's possible exclude them and take the geometric mean. If not, we should use a pooling method resistant to outliers. The median is one such popular aggregation method.
If there is a known bias in the community of predictors you are polling for predicting positive resolution of binary questions, you can consider correcting for this. One correction that worked on metaculus data is taking the geometric mean of the probabilities (this pulls the aggregate towards zero compared to the geometric mean of odds). Better corrections are likely to exist. [EDIT: I rerun the test recently and the geo mean of probabilities does no longer outcompete the geo mean of odds. Consequently, I no longer endorse using the geometric mean of probabilities]
If there is a track record of underconfidence in past aggregate predictions from the community, consider extremizing the final outcome. This has been common practice in academia for a while. For example, (Satopää et al, 2014) have found good performance using extremized logodds. To choose an extremizing factor I suggest experimenting with what extremizing factors would have given you good performance in past predictions from the same community (EDIT: Simon M lays out a case against extremizing, EDIT 2: I explain here a more robust way of choosing an extremizing factor).
There are reasons to believe I will have a better idea of which aggregation methods work best in a given context in a year. For example, it is not clear to me how to detect and deal with outliers, none of the current aggregation methods give consistent answers when annualizing probabilities and there is a huge unexplored space of aggregation functions that we might tap into with machine learning methods.
In conclusion and repeating myself: for the time being I would recommend people to stick to the geometric mean of odds as a default aggregate. I also encourage emphasizing the 10%, 50% and 90% percentile of predictions as well as the number of predictions to summarize the spread.
If you have a good pulse on a problem with the data, above I suggest some solutions you can try. But beware applying them blindly and choosing the outcome you like best.
Acknowledgements:
Thanks to Simon M for his analysis of aggregation and weighting methods on Metaculus data. I thank Eric Neyman, Ozzie Gooen and Peter Wildeford for discussion and feedback.
Footnotes
(*) (Seaver, 1978) also performs different experiments comparing different pooling methods, and founds similar performance between the mean of probabilities and geometric mean of odds. However I suspect this is because the aggregated probabilities in the experiments were in a range where both methods give similar results.


I wonder how these compare with fitting a Beta distribution and using one of its statistics? I’m imagining treating each forecast (assuming they are probabilities) as an observation, and maximizing the Beta likelihood. The resulting Beta is your best guess distribution over the forecasted variable.
It would be nice to have an aggregation method which gave you info about the spread of the aggregated forecast, which would be straightforward here.
It's not clear to me that "fitting a Beta distribution and using one of it's statistics" is different from just taking the mean of the probabilities.
I fitting a beta distribution to Metaculus forecasts and looked at:
Scattering these 5 values against each other I get:
We can see fitted values are closely aligned with the mean and mean-log-odds, but not with the median. (Unsurprising when you consider the ~parametric formula for the mean / median).
The performance is as follows:
My intuition for what is going on here is that the beta-median is an extremized form of the beta-mean / mean, which is an improvement
Looking more recently (as the community became more calibrated), the beta-median's performance edge seems to have reduced:
Hmm good question.
For a quick foray into this we can see what would happen if we use our estimate the mean of the max likelihood beta distribution implied by the sample of forecasts p1,...,pN.
The log-likelihood to maximize is then
logL(α,β)=(α−1)∑ilogpi+(β−1)∑ilog(1−pi)−NlogB(α,β)
The wikipedia article on the Beta distribution discusses this maximization problem in depth, pointing out that albeit no closed form exists if α and β can be assumed to be not too small the max likelihood estimate can be approximated as ^α≈12+^GX2(1−^GX−^G1−X) and ^β≈12+^G1−X2(1−^GX−^G1−X), where GX=∏ip1/Ni and G1−X=∏i(1−pi)1/N.
The mean of a beta with these max likelihood parameters is ^α^α+^β=(1−G1−X)(1−GX)+(1−G1−X).
By comparison, the geometric mean of odds estimate is:
p=∏Ni=1p1/Ni∏Ni=1p1/Ni+∏Ni=1(1−pi)1/N=GXGX+G1−X
Here are two examples of how the two methods compare aggregating five forecasts
I originally did this to convince myself that the two aggregates were different. And they seem to be! The method seems to be close to the arithmetic mean in this example. Let's see what happens when we extremize one of the predictions:
We have made p3 one hundred times smaller. The geometric mean is suitable affected. The maximum likelihood beta mean stays close to the arithmetic mean, unperturbed.
This makes me a bit less excited about this method, but I would be excited about people poking around with this method and related ones!