"We can’t decisively rule out scale shifts. Obviously, it’s in the nature of something subjective that we can’t objectively check it. As with assessing validity, we have to reason about what’s likely - the fact something is possible doesn’t mean it's likely."
There is an objective way to test for scale shifts across countries and over time: Measurement invariance testing (or testing for "differential item functioning," to use the item response theory vocabulary). Though I agree "we have to reason about what's likely," as the test makes strong statistical and substantive assumptions.
There is evidence that subjective well-being measures violate invariance across countries. I do not know of studies examining invariance of well-being across generations off the top of my head, but there is evidence that scale-shifts do occur across generations for other traits, such as narcissism.
"The other part of the explanation appeals to hedonic adaptation and the fact that we do get used to lots of things"
Without taking a stance on the broader thesis of this report, I think the evidence of hedonic adaptation is easy to overstate. Latent state-trait models show that changes in circumstances have detectable changes on well-being at least 10 years later, especially for affective measures. Winning the lottery also has long-term effects of well-being (though more so on life satisfaction), contra the Brickman study that played a role in popularizing hedonic adaptation.
More supportive of your thesis is evidence that the relationship between wealth and happiness is mostly driven by stable factors .
"Also in this context, the research by my own organisation, the Happier Lives Institute, finds that cash transfers to the very poor — those on the global poverty line — actually do have a small but significant effect on subjective wellbeing, one that continues over several years (McGuire, Kaiser, Bach-Mortensen, 2022)."
I would suggest also citing the evidence that this result may be an artifact of publication bias.
It might also be worth checking other measures of or proxies for wellbeing against GDP, like suicide rates, substance (ab)use rates, mental illness rates, violence and other crime, life expectancy, etc.. Lots of confounders to worry about, though, including attitudes and stigma. Maybe some kind of random effects model, fixed effects model or mixed effects model should be used?
I think the standard approach here would be a two-way fixed effects models with whatever time-varying covariates you can get access to. It makes strong assumptions though:
The cutting edge here is probably the general cross-lagged panel model, which in the tutorial below could not distinguish the long-run effect of national income on national well-being from zero.
[Note, I can't speak for Michael, but I work with Michael at the Happier Lives Institute.]
Without taking a stance on the broader thesis of this report, I think the evidence of hedonic adaptation is easy to overstate. Latent state-trait models show that changes in circumstances have detectable changes on well-being at least 10 years later, especially for affective measures. Winning the lottery also has long-term effects of well-being (though more so on life satisfaction), contra the Brickman study that played a role in popularizing hedonic adaptation.
Fair enough, hedonic adaptation in its stronger form, the claim that people will quickly return to a set point of wellbeing, has holes. But I don't think the strong form was what was referenced in the text. I also see it as pretty uncontroversial that many things we could buy as a country would only give us fleeting enjoyment -- which is, I think, Michael's point.
The claim I think most consistent with the paradox and existing evidence is that people do not fully adapt to higher levels of income, AND they also don't fully adapt to their neighbors getting richer (see Kaiser, 2020). So really, what we care about isn't adaptation per se but whether the benefits of income gains for everyone last. And maybe if everyone else gets more prosperous at the same time by similar amounts (unlike in most lottery studies or cash transfer RCTs), those benefits don't last. How long benefits and harms last is a complex topic that I think the literature doesn't study enough. But even if we had an excellent model of individual adaptation to change, I'm not sure how well that'd predict what happens when everyone's circumstances change.
"Also in this context, the research by my own organisation, the Happier Lives Institute, finds that cash transfers to the very poor — those on the global poverty line — actually do have a small but significant effect on subjective wellbeing, one that continues over several years (McGuire, Kaiser, Bach-Mortensen, 2022)."
I would suggest also citing the evidence that this result may be an artifact of publication bias.
In our meta-analysis, we did check for publication bias using methods that existed at the time of the analysis -- and found nothing major. The Bartos et al. (2022) comment utilises a novel method with unclear merit that reaches a puzzling finding: cash transfers to impoverished people don't make them happier. I'm not sure what to make of it. If they're right, I wouldn't be surprised if most social science meta-analyses suffered the same fate.
Thanks very much for writing this — I'm inclined to agree that results from the happiness literature are often surprising and underrated for finding promising neartermist interventions and thinking about the value of economic growth. I also enjoyed hearing this talk in person!
The "aren't people's scales adjusting over time?" story ('scale norming') is most compelling to me, and I think I'm less sure that we can rule it out. For instance — if I'm reading you right, you suggest that one reason to be skeptical that people are adjusting their scales over time is that people mostly agree on which adjectives like "good" correspond with which numerical scores of wellbeing. This doesn't strike me as strong evidence that people are not scale norming, since I wouldn't be surprised if people adjust the rough meaning of adjectives roughly in line with numbers.
If people thought this task was meaningless, they’d answer at random, and the lines would be flat.
I don't see a dichotomy between "people use the same scales across time and context for both words and adjectives" and "people view this task as meaningless".
You also suggest a story about what people are doing when they come up SWB scores, which if true leaves little room for scale norming/adjustment. And since (again, if I'm reading you right) this story seems independently plausible, we have an independently plausible reason to be skeptical that scale norming is occurring. Here's the story:
the way we intuitively use 0 to 10 scales is by taking 10 to be the highest realistic level (i.e. the happiest a person can realistically be) and 0 as the lowest (i.e. the least happy a person could realistically be) (Plant 2020). We do this, I claim, so that [...] we can use the same scales as other people and over time. If we didn’t do this, it would make it very difficult for our answers to be understood.
I think I don't find this line of argument super compelling, and not even because I strongly disagree with that excerpt. Rather: the excerpt underdetermines what function you use to project from an extremely wide space onto a bounded scale, and there is no obvious such 'Schelling' function (i.e. I don't even know what it would mean for your function to be linear). And indeed people could change functions over time while keeping those 0 and 10 pegs fixed. Another thing that could be going on is that people might be considering how to make their score informationally valuable, which might involve imagining what kind of function would give a relatively even spread across 0–10 when used population-wide. I don't think this is primarily what is going on, but to the extent that it is, such a consideration would make a person's scale more relative to the population they understand themselves to be part of[1], and as such to re-adjust over time.
Two extra things: (i) in general I strongly agree that this question (about how people's SWB scales adjust across time or contexts) is important and understudied, and (ii) having spoken with you and read your stuff I've become relatively less confident in scale-norming as a primary explanation of all this stuff.
I would change my mind more fully that scale norming is not occuring if I saw evidence that experience-sampling type measures of affect also did not change over the course of decades as countries become/became wealthier (and earned more leisure time etc). I'd also change my mind if I saw some experiment where people were asked to rate how their lives were going in relation to some shared reference point(s), such as other people's lives descibed in a good amount of detail, and where people's ratings of how their lives were going relative to those reference points also didn't change as countries became significantly wealthier.
(Caveat to all of above that I'm writing in a hurry!)
[Caveat I'm not an expert on this topic, just interested]
I think if people make their scales consistent with others they speak to, and use that same scale across time, for that to not imply similar scales across generations would mean that people don't really speak to people outside of their generation. Which could be plausible, I'm not really sure. It seems like a relatively heavy lift to ask someone "Hey, could you make sure the best and worst life you reference is the same as your grandparents?"
But really I think what we need is more data! We can speculate til the cows come home.
(i.e. I don't even know what it would mean for your function to be linear)
That people attach equal value to each unit change in a scale?
And indeed people could change functions over time while keeping those 0 and 10 pegs fixed.
That'd be pretty odd, wouldn't it? I think it's likelier that the scale stretches or shifts instead of the reporting function changing.
I would change my mind more fully that scale norming is not occuring if I saw evidence that experience-sampling type measures of affect also did not change over the course of decades as countries become/became wealthier (and earned more leisure time etc).
Why do you think that ESM scales wouldn't change over the course of time if other scales did? Alas, I'm not sure this data exists. I think the closest thing is looking at time use data. Using time use happiness data Han & Kaiser (2021) seem to suggest that Americans are a tiny tiny bit happier since the 80s?
I'd also change my mind if I saw some experiment where people were asked to rate how their lives were going in relation to some shared reference point(s), such as other people's lives descibed in a good amount of detail, and where people's ratings of how their lives were going relative to those reference points also didn't change as countries became significantly wealthier.
Interesting point. What about if there was evidence that people across ages tended to use subjective wellbeing scales in similar ways?
One thing that occurred to me is that, if people's subjective well-being was determined by their sense of their positioning relative to others, there are potential interventions we could do. For example, we could have an educational campaign to let people know about others who are less well off than them. Or we could encourage people to adopt a wide variety of different hierarchies, such that more people can be near the top of what they perceive to be the relevant metric.
I haven't really thought of this before! At first this felt like "cheating" in some way, but on reflection it seems more reasonable. Maybe this is what most gratitude interventions get at?
Thanks for this, Michael. It's really valuable to have someone carefully digging into these results. After reading Stevenson and Wolfers I'd sort of dismissed the paradox. This updated me against that view and has me more worried again.
I think I have more credence on the possibility that people's scales are shifting over time than you do. In particular, questions like the Cantril ladder asks people to think about a 10/10 as the "best possible life". But with growth, it's plausible to me that the best possible life is getting better over time. Perhaps people are interpreting that as best possible (attainable) life, rather than as the cosmically-absolute best possible life. And someone living the best possible (attainable) life in 2022 can go to space, travel the world, eat every kind of food, and access every possible entertaining movie and game ever made. None of these was possible in 1922, even for people living their best possible lives.
To account for this, people would have to be shifting their scales over time. Or, it is plausible to me that my 10/10 is different than my grandparents', and in an objective sense my 10/10 is better than my grandparents'.
I think there might be a confusion here between quality of life and satisfaction with life.
As you say, the best possible life in 2022 contains many pleasant experiences and time-saving innovations that were unavailable to previous generations. However, it seems to me that modern lives are subject to more unmet desires and expectations are higher than in the past. As such, even though the lives of the current generation are materially better, this doesn't mean that people are more satisfied than their grandparents.
John Clifton, CEO of Gallup, wrote in The Economist recently:
Fifteen years ago, before the widespread use of social media, 3.4% of people rated their lives a 10 (the best possible life) and only 1.6% rated their lives a zero (the worst possible life). Now the share of people with the best feasible lives has more than doubled (to 7.4%), and the share of people with the worst possible lives has more than quadrupled (to 7.6%).
If you group the world into wellbeing quintiles, this inequality is even more evident. In 2006, the top quintile for life ratings averaged 8.3; the lowest quintile averaged 2.5. Now, look at 2021. The top quintile averaged 8.9, and the lowest quintile averaged 1.2. The gap in those life ratings is now 7.7 points—the highest in Gallup’s history of tracking.
This wellbeing inequality is as serious as income inequality, in my view. It reflects a growing divide in emotions rather than possessions. And this type of inequality is plainly evident when you ask people to rate how their lives are going. Life could hardly be better for one fifth of the world, and for another fifth it could hardly be worse. It may be that the people at the top appreciate what they have more than ever before. For the most unhappy, they are more aware of what they lack than ever before.
The biggest reason that the Easterlin Paradox isn't a paradox is to look at what has changed the least: Human biology and nature have changed very little throughout the centuries of progress, especially with reward, so there is no real paradox in that more stuff doesn't cause the brain to update on that nearly as much.
So progress studies need to get genetic engineering, nanotechnology, whe brain emulation and more researched more.
This is great, thanks Michael. I wasn't aware of the recent 2022 paper arguing against the Stevenson/Wolfers result. A couple questions:
In this talk (starting around 6:30), Peter Favaloro from Open Phil talks about how they use a utility function that grows logarithmically with income, and how this is informed by Stevenson and Wolfers (2008). If the scaling were substantially less favorable (even in poor countries), that would have some fairly serious implications for their cost-effectiveness analysis. Is this something you've talked to them about?
Second, just curious how the Progress Studies folk responded when you gave this talk at the Austin workshop.
Is there data on SWB vs growth in African countries, especially Sub-Saharan Africa? That would be of most interest to those concerned with global health and poverty, but I guess you would have mentioned such data if you had them.
Yes, but it only exists for the past 20 years. I'm not sure anyone has done an analysis just looking at growth and changes to subjective wellbeing in low income countries over the past two decades. At HLI we started a project related to this last summer but it stalled and we haven't picked it up since. I'm afraid 20 years isn't enough time.
I do not know of such evidence. I would note the Gallup world data suggesting that the very down and out are the exception to the "most people are happy most of the time" generalization.
Allow me to pitch the Maslow Hypothesis: money matters insofar as it addresses the bottom two levels of Maslow’s Hierarchy of Needs: food, clean air & water, shelter, clothing, health care, safety & security… That's the rounding-off point of ~$75k in Figures 1 & 2. After that, Grant’s Razor kicks in, and the only thing that matters at that point are relationships.
This is why smaller, self-contained communities (Blue Zones, Amish/Mennonite communities, indigenous tribes…)—even without modern comforts and technology— are happier and live longer than those living in modern society; they have unconditional love and belonging, experience no loneliness, and are never forced to bear stress or hardship alone.
In our culture (and especially in the EA space!), there is this insidious belief that one needs to earn their place on the planet through their behaviors or achievements. Thinking you have a debt to pay every time you wake up in the morning is emotionally exhausting and an untenable way to live life over the long term.
The key difference between our modern society and those happier tribal societies: we have made it possible to live life playing a series of finite games—best illustrated by the cooperation dilemma (aka the prisoner's dilemma). Whereas in tribal society, everyone is playing the infinite game collectively. Sure, individuals can choose to give up the infinite game, but that means getting kicked out of the tribe.
Excellent post thank you! I want to add a couple things.
While focusing on things besides economic growth sounds very important, I’m not sure focusing on these things at the expense of economic growth would be good. Some of the proposals for increasing happiness in this post such as job security sometimes decrease economic growth. Decreasing the rate of economic growth negatively upends people’s expectations in the ways recessions do, producing the kind of decrease in happiness observed within business cycles. According to the Congressional Budget Office, real median household income in the US increased by 64% between 1979 and 2018. Yet for many people this was not enough to compensate them for the loss of the faster rate in increase in incomes of the postwar period. I don’t have a statistic on the faster rate of increase in incomes during the postwar period, but the difference has been cited by enough economists such as Duflo and Banerjee to make me confident it was larger. People often cite this loss when explaining their support for populist candidates like Trump and Sanders.
As we search for better things to focus on than growth, I want to caution that very different solutions could be better in different countries. I read in my economics textbook that the average American would be only 85% as well off if they lived in the average Western European country, accounting for the value Americans place on income, income inequality, and health (but sadly they didn’t measure the value Americans put on economic mobility, which according to a talk I went to by the UN is typically better in Western Europe). This casts doubt on the idea that expanding the welfare state substantially would increase American’s happiness.
Thank you for a super, clear, comprehensive and well-argued talk setting out your up to date understanding of the Easterlin paradox. Great to have the references which I have been checking out. I am pleased you went in to depth on scale shifts as I suspect that generational changes in what is meant by a good life is the biggest challenge to definitively concluding that economic growth does little for life satisfaction.
Nice, super interesting. Some very scattered thoughts:
Scale shift seems significant to me.
It would be really surprising if increased health, material comfort, increased leisure not all lead to increased well-being, right?
A theme in some 20th century history podcasts I listened to: It's pretty astonishing how a new generation fully blanks out the horrors that happened only a few decades ago. Kinda points to your pet theory and people having a different reference class for the "least happy a person could realistically be"
Also anecdotally, a few people I know from LMIC grew up watching a lot of US movies and shows (there's probably some selection bias here as those people ended up living in Western countries), which plausibly affects what type of life seems normal or adequate to them?
People don't only value well-being (or they underrate it?) and use their wealth for other things
As you said relative wealth seems a big factor.
I somewhat buy the story that (given basic needs like sufficient diet and safety are met) relative wealth evolutionarily determined a lot about e.g. who you were able to mate with. Robin Hanson's main thesis in The Elephant in the Brain also points in this direction: a lot of our motivation is driven by signalling to others that we're better companions than others.
Financial safety seems another desire that probably can swallow up a ton of money.
People also do not seem super skilled at using their wealth to increase their well-being (yet, growth mindset!)
I somewhat buy the Buddhist story that human psychology is to a large part driven by somewhat futile attempts at trying to avoid unpleasantness. E.g. I kinda sympathize with classic criticisms of consumerism that it doesn't bring lasting joy, that it's kinda a nice but short-lasting rush to get shiny new things, etc.
Relatedly, I have the vague impression that it's somewhat recent that wellbeing is given a much more central position among educated & wealthier people? For example I imagine this group of people to spend more time in meditation retreats today compared to 30 years ago?
Do you, or anybody, happen to know whether there are longitudinal surveys that ask "What do you most value in life?". Maybe then one could see what people use their wealth for?
It's kinda obvious, but I wanted to point out anyway that many of your suggestions for increasing well-being also seems to require significant levels of wealth to pull off:
In some sense, this is the story we all seem to accept: that we do need resources, but only up to a point, and after that point we're just showing off. Hence, we should focus on how society is organised, as opposed to how wealthy it is.
More concretely, in his 2021 book, An Economist’s Lessons on Happiness, Easterlin suggests that job security, a comprehensive welfare state, getting citizens to be healthy, and encouraging long-term relationships would increase average wellbeing. All of those seem fairly plausible to me. [...]
We should also take mental health and palliative care more seriously […] We could also consider improved air quality, reduced noise, more green and blue space (blue spaces being water), and getting people to commute smaller distances
Thank you so much - this is the most helpful text I've read about this question!
I'd love it if someone were to write
-- an equally detailed post about developing countries (rather than just something the length of section 4.4)
-- summarized how well it's possible to boost growth in developing countries without doing so in developed countries.
The thought is that the best case for economic growth leading to happiness would be along the following lines (excluding the link between growth and catastrophic/existential risk): - growth doesn't hurt happiness in rich countries - growth promotes happiness in poor countries - growth in poor countries isn't possible without growth in rich countries
Thanks for writing this Michael! I think economists are too quick to jump to the conclusion that economic growth will mean more happiness. This is a really clear and useful summary on where we currently are. I do have a few half-baked critical thoughts:
Easterlin’s long run view is still much too short: most people in EA, and I assume the progress studies community, don’t discount the future much, if at all. This means they will care about timescales of millions and even billions of years. The compounding nature of economic growth means that increased growth could mean people far in the future become much richer than they otherwise would have been. So instead of considering if growth has made us happier over the past few decades it might be more helpful to compare our happiness now to what it likely was like hundreds or even thousands of years ago. Obviously we don’t have subjective wellbeing data stretching back that far, but we can still consider that other metrics such as infant mortality, disease etc. have dropped significantly over this time, and that part of the reason for this is economic progress. Further growth could reap similar benefits in the future. Generally I’m worried that interventions such as those carried out by StrongMinds are simply far too shorttermist, only improving the wellbeing of current generations. I’d like to see more research on how to improve wellbeing over an undiscounted future. I have already shared this with you, but I think that further research into innovative mental health treatments could be high impact.
Scale effects over long time periods are very plausible: it seems very plausible to me that a hunter gatherer would rate themselves as a 8/10 because they simply don’t know how good life can be. As Fin said, I’m not sure your argument against scale effects is convincing, and I’d like to see more work on this. Also, I used to be on the side of life satisfaction data, but issues such as scale effects have tilted me to think that more affective measures such as happiness might be more useful as they could be less prone to such biases. More research is likely needed here though.
You cannot ignore population ethics when it comes to these questions: you mention at the end of your post that the Easterlin paradox is only relevant for average wellbeing. This means it’s most useful for those who subscribe to an average utilitarian population axiology, or similar. There are serious problems with average utilitarianism (sadistic conclusion). I suppose the Easterlin paradox may be relevant for those with a person-affecting view, but it is unlikely to be that informative to a total utilitarian as economic growth likely increases the number of people who will live. I think one should be explicit if a paradox only bites under certain population axiologies.
Reactions to the "cardinal comparability" objection (4.2):
Unlike validity, this is not a well-studied topic. When I came to look at it for my PhD, I struggled to find much of a literature on it. There were bits and pieces, but nothing that seemed to convincingly offer an overall assessment of the issue (see Plant 2020 where I try to offer one).
Understudied topics are where non-expert input is more likely to be useful. However, in this case, we do have a literature on the topic. The term is "scope insensitivity." It's one of the key cognitive biases Kahneman and others have examined in the behavioral economics literature. People will say they'd pay $80, $78, and $88 to protect 2,000, 20,000, or 200,000 birds from drowning in oil ponds. Just so, they'll report an 8/10 score for their marriage just about no matter how happy it makes them.
Although this is a weedy topic, it might be the key area where the intuitions of growth advocates diverge. Scale shifts mean anchoring on a default value for self-reports. There are cultural defaults for how to describe or quantify your relationship with your spouse, kids, parents, hometown, job, and sports team. These defaults are independent of their true quality. When people's circumstances worsen or improve, the normal way to describe them stays the same.
People's culture and identity informs their default response. If they see themselves as a grateful person, that means they have to give grateful-sounding responses, regardless of circumstances. This is the explicit, fundamental teaching of many philosophies and religions. They don't just teach that you should learn to feel happy in challenging circumstances. They teach that you should start by describing those circumstances with equanimity. They, along with psychologists, also talk about the difficulty of noticing and honestly reporting your true feelings. This challenge is the basis for the perennial human potential movement.
Default responses also help people preserve their mental wellbeing. Too much complaining makes people feel worse. It would just feel sarcastic to claim life's 10/10 when it's not - and realistically can't be, since nothing's ever perfect. So we default to a description somewhere from 4/10-8/10 in most cases. When things are worse, we search for a way to see them as better than they are. When they're better, we find a way to commisserate.
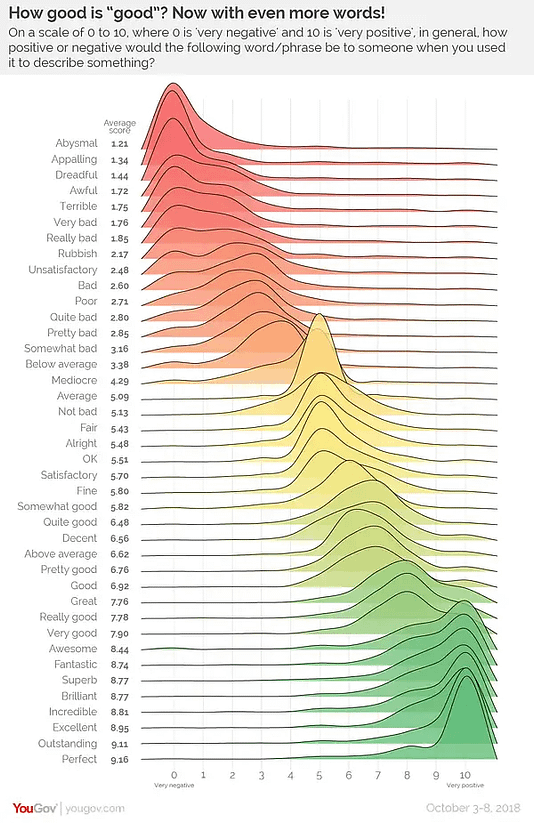
In broad terms, I think we should be somewhat reassured about the cardinal comparability of subjective data. As one piece of evidence, see Figure 9 below, taken from a YouGov poll. Here, American individuals were asked to give ratings from 0 (very negative) to 10 (very positive) for different words like: “very bad”, “terrible”, “outstanding”, “excellent”, and “perfect.”
The ‘bumps’ represent the proportion of people that give each answer. The overlap isn’t perfect, but it’s pretty good. If you ask people to score ‘perfect’, basically everyone says it means 10/10. If people thought this task was meaningless, they’d answer at random, and the lines would be flat. So, it seems that people are sensibly able to compare verbal labels and numerical labels and do so in the same sort of way.
This supports the hypothesis that people can put their language on a scale. It doesn't mean they are. There are no cultural or emotional stakes in this study. At most, it leaves the possibility open that people are able to report their real subjective wellbeing. It doesn't surprise me that the cultural default in some countries is a 2-3, while in others it's a 7-8, which is how I interpret figure 3. That data is perfectly compatible with both the idea that people are scaling their happiness according to, say, relative wealth, and that these countries simply have stable default reporting values, which cluster geographically as so many other cultural traits do.
People aren't using "bespoke scales which change from moment to moment." They're using broken scales that stay fixed across time, regardless of their true feelings or changing circumstances.
As you point out:
There’s some evidence from memory data that individuals keep the same scales over their own lives (this is from Prati and Senik 2020, which I discuss in Plant 2020).
Scale shift could still happen generationally: an 8/10 to someone born in 1950 represents a lower level of whatever subjective thing is being measured than an 8/10 to someone born in 2000. I can’t think of any research that addresses this specific concern. It doesn’t strike me as particularly likely, though. It implies that if me, my parents, and my grandparents were each to say we were 10/10 happy, we would assume I would be happier than my parents, who would be happier than their grandparents.
I would absolutely believe that your 10/10 represents a higher level of felt happiness or satisfaction than your grandparents experienced. This corresponds perfectly to the idea of an intergenerational fixed default report.
An alternative to arguing about possible scale changes would be to take a general theory of how happiness works, how economic growth changes our lives and society, and whether we should expect it to increase or reduce happiness as a result. For my money, the most promising option is to conceive of happiness and unhappiness as “Mother Nature’s” reward and punishment mechanisms for evolutionary fitness. In this light, we want to consider humanity’s environment of evolutionary adaptation, i.e. from about 100,000 years ago, to the present day but it’s not obvious this analysis favours the growth-advocate. Notably, Hidaka (2012) argues that depression is rising as a result of modernity, and points to the fact that “modern populations are increasingly overfed, malnourished, sedentary, sunlight-deficient, sleep-deprived, and socially-isolated”.[5]
Evolutionary fitness is the number of offspring you produce, and how many they produce, and so on ad infinitum. This predicts that people will report greater happiness the more children they have. In fact two children, which is below replacement, is the preferred number across many countries.
Overfed? Sounds evolutionarily adaptive to me. Malnourished? Your breakfast cereal is fortified, nobody gets scurvy, and vitamin shops are everywhere. Sedentary? Relaxed. Sunlight-deficient? It's brighter in my house than it is outside at the moment. Sleep-deprived? Watching Netflix while not sick with cholera. Socially isolated? People have options about whether and whom to be friends with.
Weirdly, I feel somewhat anxious in saying this, as though I've broken a mild taboo by responding in these ways to Hidaka's list. That's what I get for violating the cultural default report.
Thanks for a great post! I think it's very reasonable to focus on what is growing, instead of thinking that more equals better, no matter what. I find that best cases might be more interesting than averages, so I've written a post about how individuals can use a surplus of money to actually increase happiness: https://medium.com/@goranhaden/ten-ways-to-buy-happiness-395cea718440
Thanks for the great post and for bringing this topic on the forum!
I found this and this recent talks by Easterlin on the topic very interesting (especially the first one).
I do wonder, if economic growth does not drive increased SWB at the population level, what does? I'm really curious about your view on the topic, and if it relates to HLI research agenda. [edit: I had somehow missed section 5 🤦, with some tentative suggestions] [edit2: https://www.happierlivesinstitute.org/2022/07/01/2022-summer-research-fellows/ apparently it's the focus of one of the 2022 summer research internships]
This is the third in a sequence of posts taken from my recent report: Why Did Environmentalism Become Partisan?
Summary
Rising partisanship did not make environmentalism more popular or politically effective. Instead, it saw flat or falling overall public opinion, fewer major legislative achievements, and fluctuating executive actions.
Public Opinion...
This post presents the executive summary from Giving What We Can’s impact evaluation for 2025. At the end of this post we share links to more information, including the full report and...
Why building and backing Welfare Tech companies may be one of the most promising things we can do for billions of animals.
I used AI to assist in writing this post, but I’ve rewritten it extensively and endorse it.
* Announcing the launch of Spring Innovation Fund, a not-for-profit venture philanthropy studio and fund built specifical...
This is a transcript of a talk I gave at the Moral Foundations of Progress Studies workshop at the University of Texas in March 2022. Or rather, it’s a re-recorded and edited version of the talk that was subsequently produced for a Global Priorities Institute reading group on ‘progress’ and then updated in light of many helpful comments from that seminar. The original slide deck can be viewed here.
1. Introduction
As I understand it, Progress Studies is a nascent intellectual field which starts by asking the question, “Since we seem to have gotten a lot of progress over the last couple of hundred years, where did this come from, and what can we do to get more of it?” (Vox, 2021).
Progress Studies has been popularised by academics such as Tyler Cowen and Steven Pinker. However, the Easterlin Paradox presents a real challenge to the claim that if we want more progress, we just need to improve the long-run growth rate - a view that Cowen argues for in his book Stubborn Attachments. This is a possible version of Progress Studies and the one I'm responding to.
So what is the Easterlin Paradox? Quoting Easterlin and O'Connor (2022), the Easterlin Paradox states:
At a point in time, happiness varies directly with income both among and within nations, but over time the long-term growth rates of happiness and income are not significantly related.
There is a common view that economic growth is going to make our lives better, but the Easterlin Paradox challenges this.
What's paradoxical is that at a given point in time, richer people are more satisfied than poorer people and richer countries are more satisfied than poorer countries, but over the course of time, countries which grow faster don't seem to get happier faster. In other words, if I get richer, that will be good for me, but if we all get richer, that won’t do anything for us collectively.
While subjective wellbeing (self-reported happiness and life satisfaction) has gone up in previous decades, the challenge of the Easterlin Paradox is that countries which grow faster do not seem to be getting happier faster; growth per se seems unrelated to average subjective wellbeing. If the paradox holds, the result would be striking and significant. It would suggest that, if we want to increase average wellbeing, we must not rely on growth, but go back to the drawing board and see what really works.
There's been quite a bit of debate over the nature and existence of the Paradox. The topic first emerged in 1974 when Richard Easterlin published a paper called, Does Economic Growth Improve the Human Lot? It's been particularly challenged by Stevenson and Wolfers (2008), who claim the paradox is an illusion and growth is making us happier. However, after looking into this myself, I actually think that Easterlin has the better half of the debate and the paradox does propose a real challenge to the idea that economic growth alone will make us happier.
My main purpose here is to explain what the Easterlin Paradox is and why - despite doubts - we need to take it seriously. My second purpose is to show that we can work out how to improve subjective wellbeing in society and make some tentative suggestions about this. However, this project is only starting to be taken seriously and there is lots more work to be done.
2. Evidence for the Paradox
So where does the Easterlin Paradox data come from? It's based on survey questions such as:
Taking all things together, how would you say things are these days?
Would you say you're very happy, pretty happy, or not too happy?[1]
All things considered, how satisfied are you with your life as a whole nowadays, from one, dissatisfied to ten, satisfied?[2]
The Cantril Ladder, which asks individuals to imagine a ladder with different steps where the top step is the best possible life, the bottom step is the worst possible life, and individuals are asked which step they’re on.[3]
What makes the paradox a paradox is that happiness is related to income at a time (in the cross-section) but not over time (in the time series).
To set up the paradox, let’s quickly look at the cross-sectional data first…
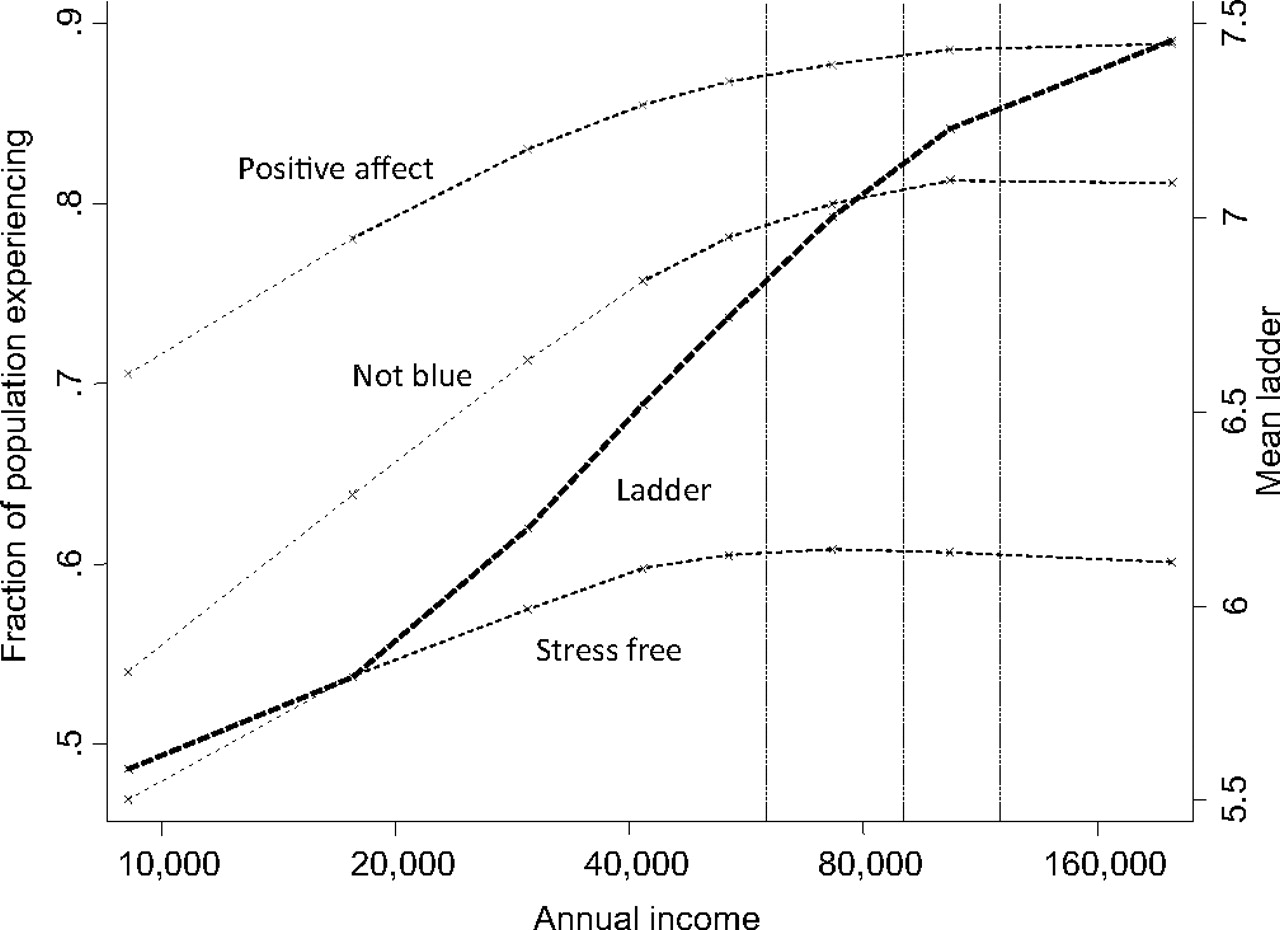
There are quite a few bits of evidence which suggest that richer people are happier and/or more satisfied than poorer people. The ‘classic’ result is Kahneman and Deaton (2010) indicated in the figure below.
If you look at the thick dotted line, which is the Cantril Ladder of Life, you see that the higher your income the more satisfied you are. Notice too that the x-axis is logarithmic, so it doubles at each point. But if you look at positive affect, which was measured using a basket of indicators of positive emotion, then this starts to plateau around $65,000 dollars of household income. There’s a similar story for measures of stress.
What people took from this finding was that if you get richer you’ll get more satisfied, but happiness - which is distinct from satisfaction - flattens out at some point.
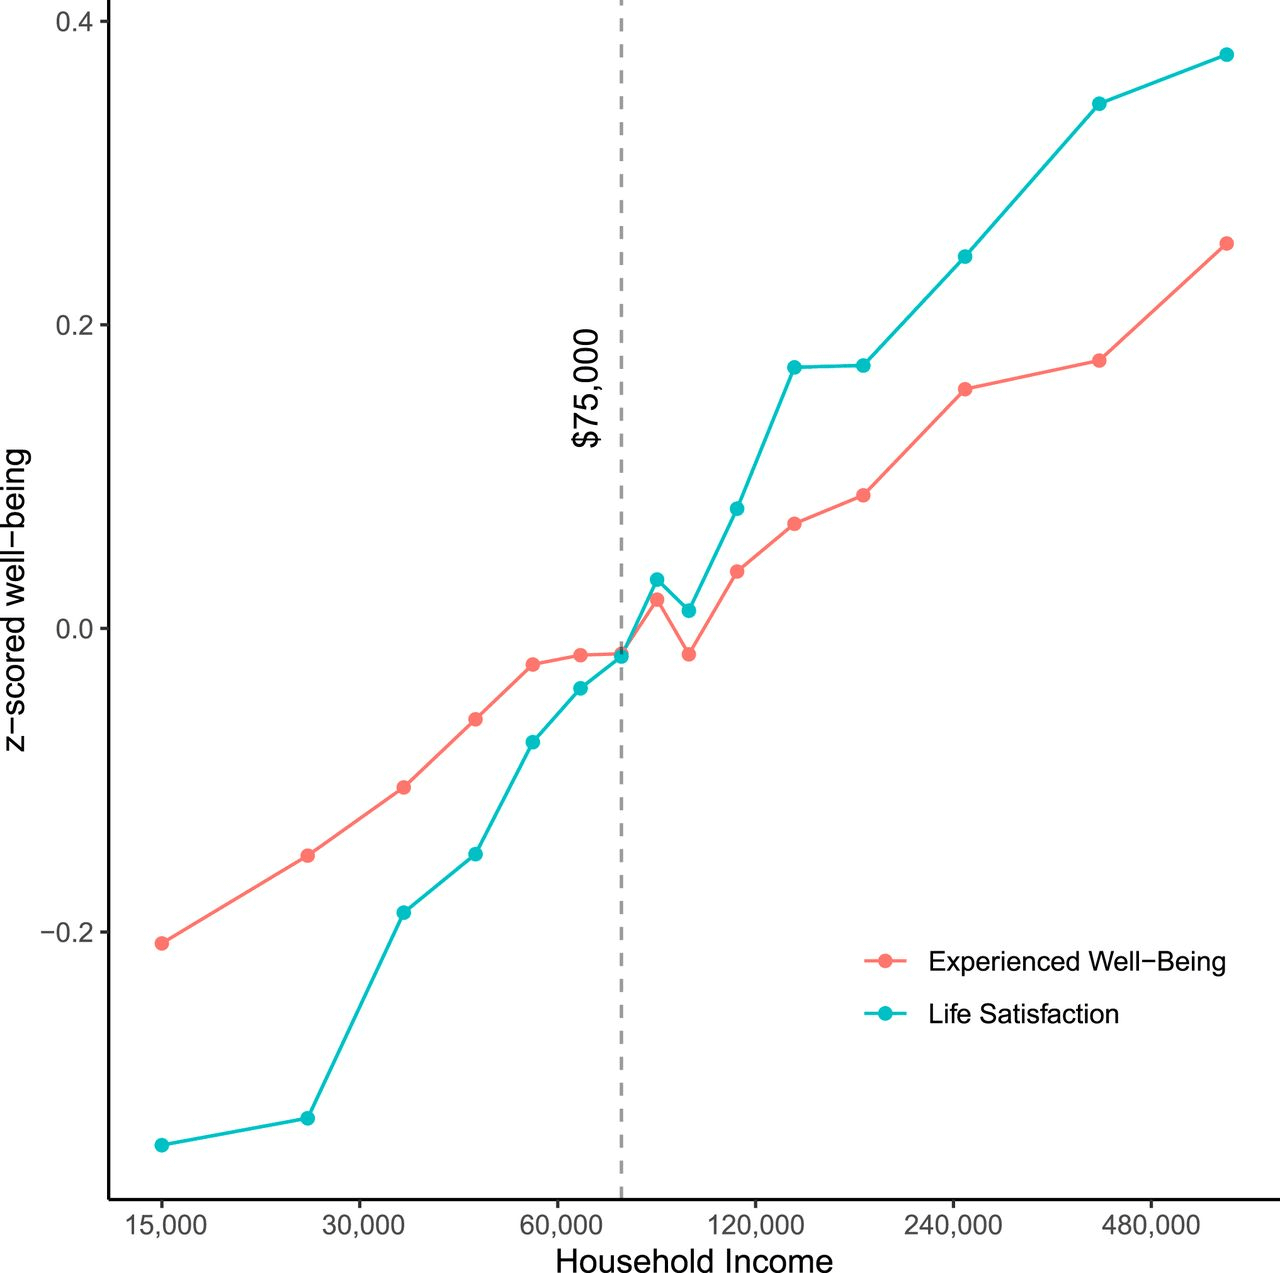
Since then there’s been new evidence from Killingsworth (2021) which has caused quite a stir. Using smartphone data where people report how they feel in the moment, Killingsworth finds that both experienced wellbeing and life satisfaction keep going up with larger amounts of household income. Again, note the logarithmic x-axis.
Figure 2: The relationship between household income and wellbeing (Killingsworth, 2021)
That’s an indication of the relationship between money and wellbeing at a time within a country. What about at a time between countries?
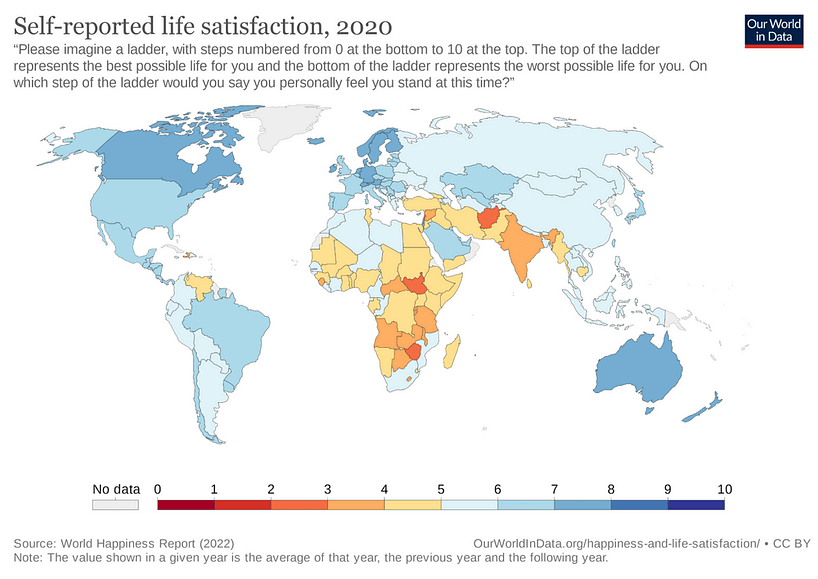
For this, we can look at self-reported life satisfaction across the world as shown in this figure from Our World in Data using data from the World Happiness Report 2020. The colours represent different levels of life satisfaction. At a glance, there is a more or less believable pattern, with the more developed countries being more satisfied than the less developed countries.
So, more money leads to more happiness, right? Well, if you look at what happens over time, we get a different, indeed paradoxical picture.
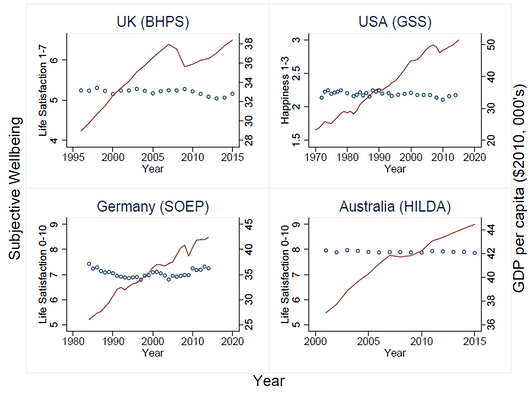
Below are a few different bits of evidence from a few rich countries — different data sets where the white dots represent the average subjective wellbeing (using slightly different measures) and the red line is GDP per capita. The figure is from the excellent book Origins of Happiness (Clark et al., 2019). We can see that GDP per capita goes up sharply over time whereas the subjective wellbeing scores seem to go nowhere in particular.
This is the sort of thing which motivates the paradox. It's better to be richer at any given moment, but as we all get richer, it seems like average wellbeing doesn't increase.
Figure 4: The relationship between GDP per capita and subjective wellbeing (Clark et al., 2019)
Now it's worth really stressing here that the Easterlin Paradox is about what happens over the long run. It's really not at all controversial that if you're looking at the short run over the business cycle, you would expect wellbeing to go up in a boom and down in a bust. But the interesting thing - to really test the effect of our increasing resources - is to see what happens over the longer term.
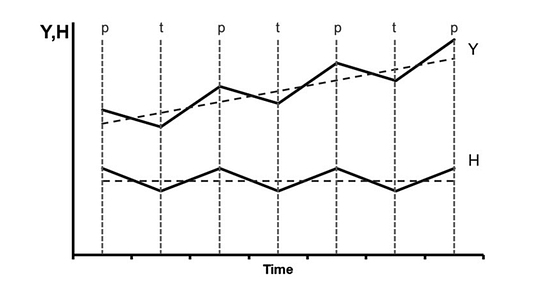
As this figure from Easterlin and O'Connor (2022) indicates, you need to look over longer time periods to know if you're in situation Y or situation H. You've got to look beyond the initial fluctuations to really test the paradox, so we can’t just look at only a handful of years.
Figure 5: Short-term fluctuations and long-term trends in happiness (H) and income (Y) (Easterlin and O'Connor, 2022)
Easterlin and O'Connor (2022) argue, I think convincingly, that to test the paradox we need to look over the long run. We also need to look at many different countries, because if we look at an individual country, there could be all sorts of different things which are only happening there during a given period of time. So, as a better test of this question, we need to look over a wider basket of countries and then compare changes in subjective wellbeing to GDP growth rates. And we really want to know whether subjective wellbeing grows faster when GDP growth is higher.
Now, a challenge in doing this is the data we have. We've only started to measure subjective wellbeing fairly recently in the course of human history, since the 1950s, and there are not many long-running datasets for different countries. In the available data sets, a problem that Easterlin and O'Connor (2022) make a big song and dance about is that there are lots of European countries that are only observed post-transition from socialism to capitalism. When the USSR collapsed there were big convulsions in those countries - society is sort of torn asunder and then put back together. There's also a big drop in the economy as a result of this which then improves over time. Clearly, there’s something a bit odd about looking at countries which are recovering after a trough (‘expansion-only countries’) compared to those which are going completely through a trough (‘full-cycle’ countries).
In response, Easterlin and O'Connor (2022) distinguish between expansion-only countries versus full-cycle countries - those which have boom and bust, not just boom. This might seem like a controversial assumption they make just to support their conclusion, but it strikes me as appropriate given what they are trying to test. Other researchers make the same point (e.g. Bartolini and Sarracino, 2014; Kaiser and Vendrik, 2019).
Below, we can see some more figures from Easterlin and O'Connor (2022)...
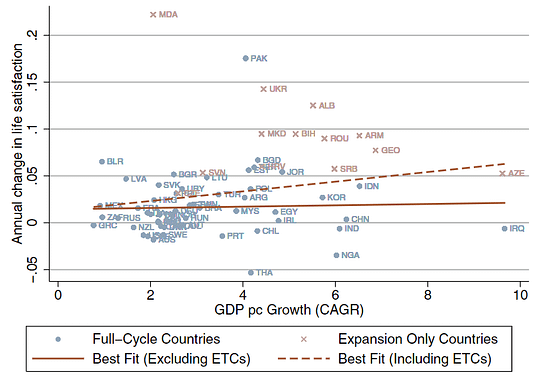
Figure 6 presents data from the World Values Survey of over 54 countries and with an average 28-year duration comparing the compound annual growth rate to changes in life satisfaction. First, you can see that there are countries all over the place, and if you look at the thick brown line, which excludes the boom-only countries, then you can see that the relationship is basically nil. In other words, a higher rate of GDP growth doesn't correlate with countries getting happier. There is a positive relationship if all the expansion-only countries are included but, again, that doesn’t seem the right test because we want to see what the relationship is over the longer run when economies expand and contract.
Figure 6: Growth rates of life satisfaction and GDP per capita with and without expansion only countries. WVS/EVS Data. 1981-2019 (Easterlin and O'Connor, 2022)
Of course, lots of other things can be happening in countries besides economic growth, a point Easterlin and O’Connor make. Those other things are probably what will explain the changes in happiness.
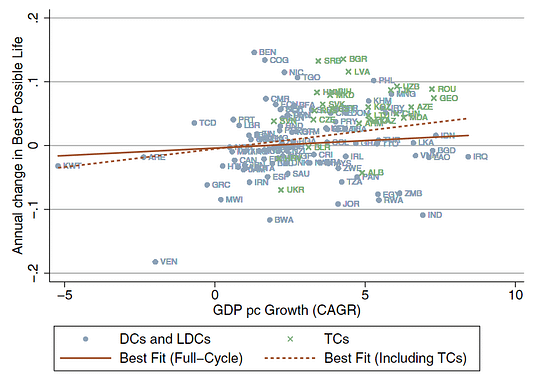
Below we can see a similar data set from the Gallup World Poll which includes a wider range of countries over a shorter time period than the World Values Survey. It's a pretty similar story. The thick brown line for the full cycle countries is, again, somewhat underwhelming. Easterlin and O'Connor say that the regression lines for full cycle countries are positive, but statistically and “economically insignificant” (I think it would be better if they said “practically insignificant” but never mind).
Figure 7: Growth rates of best possible life and GDP per capita with and without transition countries. Gallup Data. 2005-2019. (Easterlin and O'Connor, 2022)
What does “economically insignificant” mean? From their regressions, Easterlin and O’Connor (2022) estimate that an extra 1% percentage point of GDP growth rate would take a thousand years to raise life satisfaction by one point on the World Values Survey data, and 500 years to raise life satisfaction by one point on the Gallup World Poll data.
This might be a bit abstract, so imagine we have a country with a starting average life satisfaction of 6/10. Then, given an increase from a 2% to 3% growth rate we can ask, how long is it going to take for the country to go from 6/10 to 7/10? Well, on the World Value Survey, it would take a thousand years and on the Gallup World Poll, it would take 500 years.
If you take Tyler Cowen’s view that we only really need to worry about economic growth - because then we’ll have so many resources we can make our lives go better and address all of society's other problems - then this is a really serious challenge posed by Easterlin and others who have argued for the paradox. Their evidence is that growth rates per se have not, over recent decades, shown any interesting and detectable relationship to average wellbeing.
It’s worth pointing out that these figures are the best test we can do for the Easterlin Paradox right now. To test it, we need to look at the longest data sets with the widest number of countries, and the Gallup World Poll and the World Values Survey are those two data sets. This is why I think Easterlin and O'Connor (2022) have the final word on this, at least for now.
3. Explaining the Paradox
At this point, you may be wondering, “Well, okay this is peculiar. Can we explain this?” There are indeed a couple of explanations people have offered, which make the paradox seem less mysterious.
The first explanation draws on the effect of social comparison. The effect of additional money on how we feel about our lives is not just about how wealthy we are in absolute terms, but how wealthy we are compared to other people (Clark et al., 2008; Latif, 2015). It's not that surprising to think that we will never get used to being richer than other people, because it indicates status. We are social beings and sensitive to status.
The other part of the explanation appeals to hedonic adaptation and the fact that we do get used to lots of things (Diener, Lucas, and Scolon, 2006; Graham and Oswald, 2010). To put it bluntly, we are basically naked apes and have evolved to survive without needing many material belongings. As we've gone from having iPhone 5s to iPhone 6s, to iPhone 7s, to iPhone 8s and so on, these have not made a lasting improvement to our wellbeing because we just quickly get used to them. I know economists will find this conclusion almost heretical, but so much the worse for economics.
We do keep noticing the social comparisons - it’s annoying to me that you have the fancier iPhone - and so, between these, we can make sense of the fact that we're all getting richer but not really noticing it, because we’re paying attention to the relative social comparisons instead.
What’s perhaps in tension with this is the finding by De Neve et al. (2018) that life satisfaction does seem to go down during recessions. If we’re all getting richer and that doesn’t make us happier on average, shouldn’t it also make no difference if we’re all getting poorer?
I’m not sure there is a tension here. We’ve already said, over the short run, economic cycles can affect wellbeing: part of the comparison we make is not just to others now, but to our earlier selves. Recessions seem to be worse than growth which Easterlin attributes to the fact that people plan their economic lives around things getting better, so it’s suddenly a real crunch point when you aren’t able to pay for the thing you’ve committed to - your mortgage, rent, your car, your children, etc.
Maybe by this point, you are starting to believe that the Easterlin Paradox might be a real thing. Should we be surprised that we were surprised? Well, after a bit of reflection, perhaps not so much.
Research from psychology suggests that we are not so good at predicting how we will feel (Wilson and Gilbert, 2005; Kahneman et al., 2006). These are known as failures of affective forecasting.
One of the biases described by Daniel Kahneman is a focusing illusion: when we think about other people's lives, there are certain details which are more salient and drive our mental simulations, more so than they really should. Kahneman argues that part of the reason we overestimate the effects of money is because it’s so easy to visualise.
Another bias is immune neglect, where we don’t account for the fact we will adapt to some things, but not others. As an example, imagine how you would feel driving around in your new Ferrari. If you did get a Ferrari, you’d be driving around thinking, “Wow I've got a Ferrari” for the first few weeks, and after that, you’ll just be thinking “Oh my god, when is this light going to turn green” like everyone else on the road. That's the difference between how we imagine things are and then how they are once we've adapted to them.
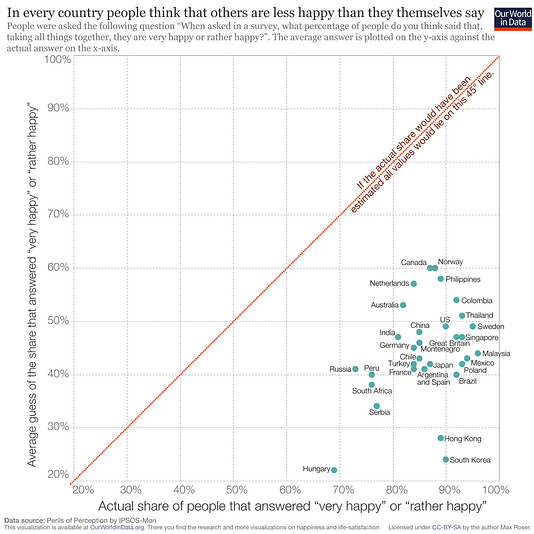
Further evidence that our predictions about happiness are not so hot comes from the figure below. You can ask people in a country “how happy are you, taking all things together?” and then ask “what percentage of people in your country would say the same?” The results are rather divergent. In the US, 90% of people say they are “very happy” or “rather happy,” but in fact, US citizens guess that only 50% of their fellow countrymen say they are “very happy” or “rather happy” — quite a large difference between what people say about themselves and what other people say.
Figure 8: The relationship between predicted levels and actual levels of happiness in the US population
4. Objections
Let's turn now to some criticisms of the Easterlin Paradox. I’ll consider four.
4.1 Can we trust subjective wellbeing data?
The paradox is based on subjective wellbeing data: self-reports where we ask people “How satisfied are you with your life?” and so on. But can we trust them? Someone might say something like “We knew these were stupid all along and the Easterlin Paradox proves it.”
I understand this as a reaction from those who are not familiar with the ins and outs of subjective data. But it’s much too fast. As you might expect, lots of people have worried about the question of whether self-reports are valid, that is, whether they are accurate, and it’s been investigated in great detail by social scientists over the years (see OECD 2013 for an excellent review). The basic idea is that you don’t just automatically believe that your measures are valid, you have to go out into the world and see if they give you believable results - the sort of results they would give you if they really were working.
It turns out that higher levels of happiness and life satisfaction are correlated with: higher income (at a time!), reports from others (if you're happy, your friends will also say you’re happy), better health outcomes, being in areas of low pollution, being near green spaces, being in relationships, having a job, and being in low areas of crime. Furthermore, people are more likely to commit suicide if they have lower levels of life satisfaction, and are also more likely to leave jobs or relationships and so on (Diener, Ingelhart and Tay, 2013; Kahneman & Krueger, 2006; OECD, 2013). In other words, it turns out that asking people how happy they are really does seem to tell us how happy they are.
As an aside, the underlying theory in the philosophy of science is construct validation, where we test if a measure is valid by seeing if it behaves in the way you expect it to given your best understanding of what you’re trying to measure (Alexandrova and Haybron, 2016). It’s the same approach which is used in science to test measures of anything, not just self-reports of feelings.
At this point, if we’ve already accepted that our measures of happiness and life satisfaction work in general, it’s very puzzling to say they don’t work when it comes to measuring a particular thing. It’s a bit like saying your thermometer works in your living room but not your kitchen, or your bathroom scales don’t work once you’ve eaten chocolate cake. At the very least, the sceptic needs to provide a story here for us to believe them.
Perhaps the sceptic thinks, for some reason, we should give up on happiness data altogether - they don’t buy the construct validation story. But, why stop here? We ask people for subjective ratings all the time: Uber drivers, restaurants, job satisfaction, mental health diagnoses, pain scores, etc. Are these all nonsense too? Surely not.
4.2 Are subjective wellbeing (SWB) data comparable over time?
A second criticism is that, although we can generally trust SWB data, we can’t take the numbers at face value. More technically, the worry is about cardinal comparability: if two people said they were 3/10, then report 5/10 later, can we assume they started at the same level of SWB and had the same size increase? The specific version of this criticism that the ‘growth-advocate’ needs to make is that people are genuinely getting happier and/or more satisfied, but they are changing how they report those feelings over time. For example, perhaps in response to rising economic standards, a score of 8/10 in 1990 might represent a lower level of SWB than the same score of 8/10 in 2020. Same number, different level of happiness.
To address this issue, we need to get quite a long way into the weeds. Those who aren’t worried about this can skip ahead to the next objection.
There are quite a few things to say here. Unlike validity, this is not a well-studied topic. When I came to look at it for my PhD, I struggled to find much of a literature on it. There were bits and pieces, but nothing that seemed to convincingly offer an overall assessment of the issue (see Plant 2020 where I try to offer one). Often the only thing researchers will point to is that we should expect classical measurement error: if errors are random, they will ‘wash out’ as random noise. However, we might wonder if errors are non-random: what if different people, or people in different countries, use different scales or they use different scales over time?
We need to distinguish hedonic adaptation from scale shifts. Hedonic adaptation occurs when you require more and more of something to feel as happy, and can be linked to increasing aspirations. For example, you might need to go to fancier and fancier restaurants to have the same feeling of satisfaction. This is different from actually enjoying the fancier restaurants more and more but consistently rating your enjoyment as 7/10 because your conception of how enjoyable a 10/10 restaurant would be has changed. That’s a scale shift. For the purpose of testing the Easterlin Paradox, it’s not a problem if we’re getting used to stuff - indeed, the claim is that the iPhone 10, etc. didn’t lastingly make us happier - but it would be a problem if we were actually getting happier but changing our reporting style so that it looked like we weren’t getting happier.
We can’t decisively rule out scale shifts. Obviously, it’s in the nature of something subjective that we can’t objectively check it. As with assessing validity, we have to reason about what’s likely - the fact something is possible doesn’t mean it's likely.
In broad terms, I think we should be somewhat reassured about the cardinal comparability of subjective data. As one piece of evidence, see Figure 9 below, taken from a YouGov poll. Here, American individuals were asked to give ratings from 0 (very negative) to 10 (very positive) for different words like: “very bad”, “terrible”, “outstanding”, “excellent”, and “perfect.”
The ‘bumps’ represent the proportion of people that give each answer. The overlap isn’t perfect, but it’s pretty good. If you ask people to score ‘perfect’, basically everyone says it means 10/10. If people thought this task was meaningless, they’d answer at random, and the lines would be flat. So, it seems that people are sensibly able to compare verbal labels and numerical labels and do so in the same sort of way.
Building on this, the map of life satisfaction scores around the globe we saw earlier in Figure 3 suggests that people are using the same scale. My pet theory on this is that the way we intuitively use 0 to 10 scales is by taking 10 to be the highest realistic level (i.e. the happiest a person can realistically be) and 0 as the lowest (i.e. the least happy a person could realistically be) (Plant 2020). We do this, I claim, so that our answers always fit within the limits and so we can use the same scales as other people and over time. If we didn’t do this, it would make it very difficult for our answers to be understood. If everyone used bespoke scales which changed from moment to moment, so 7/10 one day meant 2/10 the next, we wouldn't do a very good job of communicating. But the purpose of language is of course to communicate.
Figure 9: Assigning numerical values to words (YouGov)
None of this decisively rules out the possibility that not only are their rising aspirations and hedonic adaptation - we need more stuff to feel as good - but also that we are changing our scale use over time.[4] There’s some evidence from memory data that individuals keep the same scales over their own lives (this is from Prati and Senik 2020, which I discuss in Plant 2020). Scale shift could still happen generationally: an 8/10 to someone born in 1950 represents a lower level of whatever subjective thing is being measured than an 8/10 to someone born in 2000. I can’t think of any research that addresses this specific concern. It doesn’t strike me as particularly likely, though. It implies that if me, my parents, and my grandparents were each to say we were 10/10 happy, we would assume I would be happier than my parents, who would be happier than their grandparents. Of course, the meaning of particular words changes over time, but we notice this from context. I assume we would have noticed if there were substantial differences in how different ages communicated the intensity of their feelings. If anything, I’m inclined to believe that it would go the other way from what the growth-advocate needs: older people are more reserved, so their 10/10 would be more intense than mine.
An alternative to arguing about possible scale changes would be to take a general theory of how happiness works, how economic growth changes our lives and society, and whether we should expect it to increase or reduce happiness as a result. For my money, the most promising option is to conceive of happiness and unhappiness as “Mother Nature’s” reward and punishment mechanisms for evolutionary fitness. In this light, we want to consider humanity’s environment of evolutionary adaptation, i.e. from about 100,000 years ago, to the present day but it’s not obvious this analysis favours the growth-advocate. Notably, Hidaka (2012) argues that depression is rising as a result of modernity, and points to the fact that “modern populations are increasingly overfed, malnourished, sedentary, sunlight-deficient, sleep-deprived, and socially-isolated”.[5]
4.3 There is no Paradox
The third criticism is that there is no paradox. This challenge comes from Stevenson and Wolfers (2008) and Sacks, Stevenson and Wolfers (2012) who argue that Easterlin has misinterpreted the data and, on closer examination, growth is associated with higher wellbeing.
The reply that Easterlin and O’Connor (2022) make is that Stevenson, Wolfers, and co. are looking over too short a time horizon. They point out that the critique looks at segments of ten years and to really test the paradox requires looking over a longer time period, which is what Easterlin and O'Connor (2022) do themselves. Easterlin and O'Connor (2022) write that they don't really understand why Stevenson and Wolfers are using these short time segments rather than the longer ones.
As noted before, I think Easterlin and O'Connor (2022) have the better side of this debate and we really do want to be looking over the longer time period. After all, the longer time period is exactly what we’re trying to test and what we find on the longest available datasets indicates a surprisingly non-existent relationship between subjective wellbeing and GDP.
4.4 The Paradox doesn’t apply to poor countries
A fourth criticism is that the paradox may apply to rich countries, who have already reached a certain level of wealth, but does not and will not apply to poor countries. This is half an objection, really, as it concedes the paradox does occur in richer countries. The motivation for it is that the richer countries are more satisfied but presumably, they became more satisfied by becoming richer.
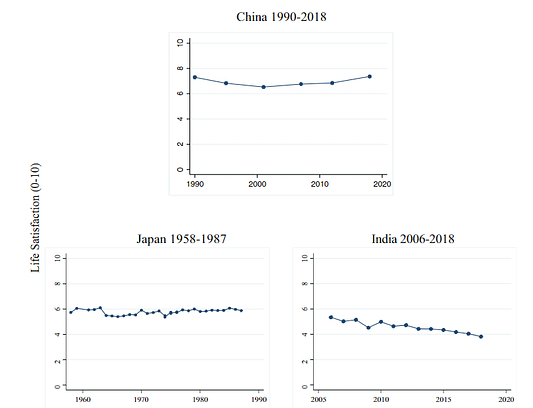
This issue is open to debate. The figure below, from Easterlin and O'Connor (2022), shows different data sets looking at subjective wellbeing over time from China, Japan, and India which have all experienced rapid economic growth over different time periods; for China that's 1990 to 2018, or around 30 years. Over that period we can see life satisfaction goes down and then up again. Japan is around a 30 year period as well, and we can see that the relationship is basically flat too. And finally, India in recent time periods has seen life satisfaction go down.
This leaves the question as to how they should be interpreted, which I think is very much open for debate. The answer put forward by Easterlin is that times of enormous economic expansion are accompanied by societal upheaval. People leave villages, where they have good family networks, and go to work in cities, which are often dirty and unfriendly, and where they don't know anyone.
Easterlin’s analysis, in the case of China, suggests that the social support systems were taken away and only later do they start to get put back in. That’s the human story to all of this — you may experience lots of growth, but that is often less important to people than tears in the social fabric of society.
A key challenge is that there really isn’t a lot of data to go on. There are some data on some larger countries which have developed a lot, but there are not lots of data on other less developed and less satisfied countries, and there might not be for another 20 years until we know how and whether they change over time.
Figure 10: Happiness in three formerly poor countries during subsequent periods of rapid economic growth (Easterlin and O'Connor, 2022)
Also in this context, the research by my own organisation, the Happier Lives Institute, finds that cash transfers to the very poor — those on the global poverty line — actually do have a small but significant effect on subjective wellbeing, one that continues over several years (McGuire, Kaiser, Bach-Mortensen, 2022).
So it could be the case that, for the very poor, economic growth does do quite a bit to raise wellbeing, but at a certain point money stops having a significant effect in absolute terms. In some sense, this is the story we all seem to accept: that we do need resources, but only up to a point, and after that point we're just showing off. Hence, we should focus on how society is organised, as opposed to how wealthy it is. The issue is that the empirical evidence on subjective wellbeing hasn’t identified exactly where that point is. So we're back to speculating.
5. What can we do to improve the human lot?
My thesis so far has been negative. I’ve been arguing that the common belief that economic growth will improve the human lot seems to be false.
Is there something more positive to say about how to increase aggregate wellbeing? This, I have to confess, is something of a new question and the growing field of wellbeing science is only starting to bear fruit and identify how our priorities should differ from the status quo. Depending upon your perspective, you can either see that as frustrating or as an exciting opportunity to do valuable academic research.
It must be recognized that in this first Global Happiness Policy Report, written when there are still relatively few examples of rigorously evaluated happiness policies to review, our catalogue will have many tentative entries, as well as many places where the relevant policies remain to be developed and supported with evidence.
The literature here is small, with notable contributions including Diener et al. (2019), Easterlin (2021), and Frijters and Krekel (2021).
In other words, this is all quite new. If you're trying to directly measure outcomes in terms of people's subjective wellbeing, while many factors are still going to matter, you might get a substantially different story for some issues, such as the value of economic growth. There is clearly lots more work to be done to figure out where our intuitive stories about wellbeing and where our evidence-based stories about wellbeing come together and come apart.
Here are some tentative suggestions. Unsurprisingly, the overarching one is that we should measure outcomes and set priorities using subjective wellbeing. Whatever your view is on what matters morally, presumably people’s subjective wellbeing (their happiness and/or life satisfaction) is going to form some part of that story, and you’re going to want to account for the best evidence regarding it.
More concretely, in his 2021 book, An Economist’s Lessons on Happiness, Easterlin suggests that job security, a comprehensive welfare state, getting citizens to be healthy, and encouraging long-term relationships would increase average wellbeing. All of those seem fairly plausible to me.
We should also take mental health and palliative care more seriously — as suggested by the Global Happiness Policy Reports (2018, chapter 3; 2019, chapter 3). We could also consider improved air quality, reduced noise, more green and blue space (blue spaces being water), and getting people to commute smaller distances (Diener et al. 2019). Social interactions could be enhanced via urban design, reducing corruption, increasing transparency, supporting healthy family relationships, and maybe even things like progressive taxation (Global Happiness Policy Report 2018, chapter 6). These seem sensible but are tentative suggestions. I'm not really committed to any of them as concrete methods of improving wellbeing. These are just to get the juices flowing and indicate there could be a path ahead.
6. Wrapping up
Let’s take stock. I take it that the Easterlin Paradox poses a challenge for the view that a laissez-faire approach to policy will lead to progress. If you were inclined to the view, “let's just focus on economic growth and forget about everything else”, I think you should be pretty sceptical that this will improve the average person’s wellbeing.
That’s not to say that we can't improve people's wellbeing, but economic growth alone doesn't seem to do that much and we ought to be thinking about which particular interventions are most cost-effective.
Of course, more or less economic growth might be relevant for other sorts of global priorities. If you're taking a longtermist perspective you might think that a far larger economic pie is better for engaging in activities like space colonisation. On the other hand, you might wonder if a faster rate of economic growth is more likely to lead to existential catastrophes, for example by speeding up the takeoff of unsafe artificial intelligence. The Easterlin Paradox is just referring to average wellbeing, rather than these other sorts of concerns.
It’s also worth noting that the Easterlin Paradox seems to apply more clearly to richer countries. It still may apply to poor countries, but the evidence is less decisive for them (see Objection 4).
Finally, a wellbeing policy agenda based on subjective wellbeing data rather than our intuitions about what we think would improve people's lives, is only really starting. In years to come, perhaps we will have more things to say about how we can achieve progress in terms of our collective quality of life. This is a topic which I invite people who are interested in Progress Studies to engage with.
The response Easterlin and O’Connor (2022) offer is that if people were getting happier over time, we’d expect to see ‘ceiling effects’, where lots of people end up saying they are 10/10 because they’ve ‘run out of room on their own scale’. This doesn’t address the concern: there’s no need for people to reach the end of the scale to scale shift. I thank the audience of the Global Priorities Insitute’s Progress Studies seminar for pressing this point. ↩︎
A further paradox to resolve would be how to combine the apparent Easterlin result that happiness is rising – but not as a result of growth rates – with the apparent result that depression is rising – as a result of modernity. One way to render these consistent would be if the distribution of happiness had widened over time; then there might be more very unhappy people but an unchanged average. I have not checked this and I am unsure what else to say on this issue. ↩︎


"We can’t decisively rule out scale shifts. Obviously, it’s in the nature of something subjective that we can’t objectively check it. As with assessing validity, we have to reason about what’s likely - the fact something is possible doesn’t mean it's likely."
There is an objective way to test for scale shifts across countries and over time: Measurement invariance testing (or testing for "differential item functioning," to use the item response theory vocabulary). Though I agree "we have to reason about what's likely," as the test makes strong statistical and substantive assumptions.
There is evidence that subjective well-being measures violate invariance across countries. I do not know of studies examining invariance of well-being across generations off the top of my head, but there is evidence that scale-shifts do occur across generations for other traits, such as narcissism.
"The other part of the explanation appeals to hedonic adaptation and the fact that we do get used to lots of things"
Without taking a stance on the broader thesis of this report, I think the evidence of hedonic adaptation is easy to overstate. Latent state-trait models show that changes in circumstances have detectable changes on well-being at least 10 years later, especially for affective measures. Winning the lottery also has long-term effects of well-being (though more so on life satisfaction), contra the Brickman study that played a role in popularizing hedonic adaptation.
More supportive of your thesis is evidence that the relationship between wealth and happiness is mostly driven by stable factors .
"Also in this context, the research by my own organisation, the Happier Lives Institute, finds that cash transfers to the very poor — those on the global poverty line — actually do have a small but significant effect on subjective wellbeing, one that continues over several years (McGuire, Kaiser, Bach-Mortensen, 2022)."
I would suggest also citing the evidence that this result may be an artifact of publication bias.
It might also be worth checking other measures of or proxies for wellbeing against GDP, like suicide rates, substance (ab)use rates, mental illness rates, violence and other crime, life expectancy, etc.. Lots of confounders to worry about, though, including attitudes and stigma. Maybe some kind of random effects model, fixed effects model or mixed effects model should be used?
Agreed re: other measures of well-being.
I think the standard approach here would be a two-way fixed effects models with whatever time-varying covariates you can get access to. It makes strong assumptions though:
https://doi.org/10.1017/pan.2020.33
The cutting edge here is probably the general cross-lagged panel model, which in the tutorial below could not distinguish the long-run effect of national income on national well-being from zero.
https://doi.org/10.1177%2F1094428119847278
[Note, I can't speak for Michael, but I work with Michael at the Happier Lives Institute.]
Fair enough, hedonic adaptation in its stronger form, the claim that people will quickly return to a set point of wellbeing, has holes. But I don't think the strong form was what was referenced in the text. I also see it as pretty uncontroversial that many things we could buy as a country would only give us fleeting enjoyment -- which is, I think, Michael's point.
The claim I think most consistent with the paradox and existing evidence is that people do not fully adapt to higher levels of income, AND they also don't fully adapt to their neighbors getting richer (see Kaiser, 2020). So really, what we care about isn't adaptation per se but whether the benefits of income gains for everyone last. And maybe if everyone else gets more prosperous at the same time by similar amounts (unlike in most lottery studies or cash transfer RCTs), those benefits don't last. How long benefits and harms last is a complex topic that I think the literature doesn't study enough. But even if we had an excellent model of individual adaptation to change, I'm not sure how well that'd predict what happens when everyone's circumstances change.
In our meta-analysis, we did check for publication bias using methods that existed at the time of the analysis -- and found nothing major. The Bartos et al. (2022) comment utilises a novel method with unclear merit that reaches a puzzling finding: cash transfers to impoverished people don't make them happier. I'm not sure what to make of it. If they're right, I wouldn't be surprised if most social science meta-analyses suffered the same fate.