CEA has recently conducted a series of analyses to help us better understand how people of different genders and racial backgrounds experienced EA Global events in 2022 (not including EAGx). In response to some requests (like this one), we wanted to share some preliminary findings.
This post is primarily going to report on some summary statistics. We are still investigating pieces of this picture but wanted to get the raw data out fast for others to look at, especially since we suspect this may help shed light on other broad trends within EA.
High-level summary
- Attendees:
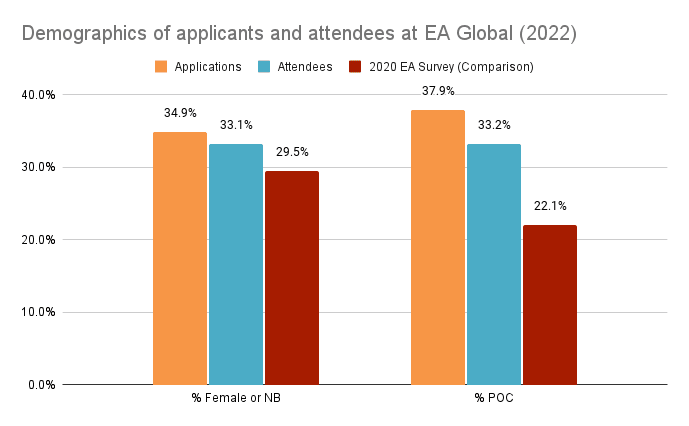
- 33% of registered attendees (and 35% of applicants) at EA Global events in 2022 self-reported as female or non-binary.
- 33% of registered attendees (and 38% of applicants) self-reported as people of color (“POC”).
- Experiences:
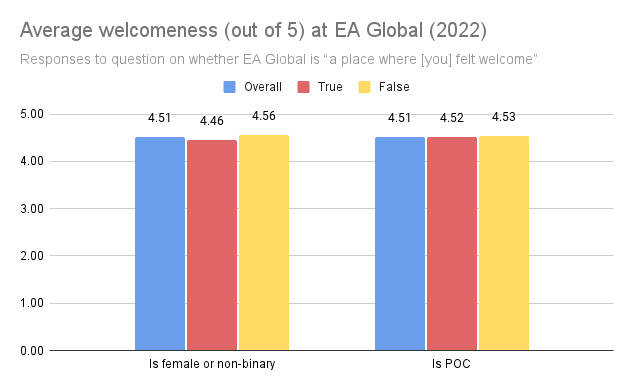
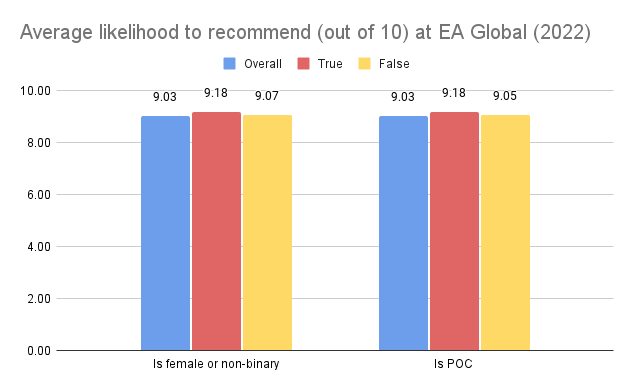
- Attendees generally find EA Global welcoming (4.51/5 with 1–5 as options) and are likely to recommend it to others (9.03/10 with 0–10 as options).
- Women and non-binary attendees reported that they find EA Global slightly less welcoming (4.46/5 compared to 4.56/5 for men and 4.51 overall).
- Otherwise, we found no statistically significant difference in terms of feelings of welcomeness and overall recommendation scores across groups in terms of gender and race/ethnicity.
- Speakers:
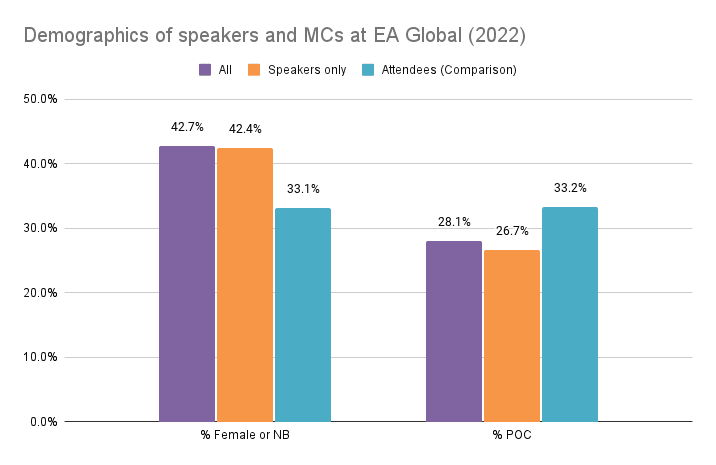
- 43% of speakers and MCs at EA Global events in 2022 were female or non-binary.
- 28% of speakers and MCs were people of color.
- Some initial takeaways:
- A more diverse set of people apply to and attend EAG than complete the EA survey.
- Welcomingness and likelihood to recommend scores for women and POC were very similar to the overall scores.
- There is a small but statistically significant difference in welcomingness scores for women.
- We are not sure what to make of the fact that the application stats for POC were higher than the admissions stats. We are currently investigating whether this demographic is newer to EA (our best guess) and if that might be influencing the admissions rate.
- One update for our team is that women / non-binary speaker stats are higher compared to the applicant pool and this is not the case for POC. We had not realized that prior to conducting this analysis.
- The 2022 speaker statistics appear to be broadly in line with our statistics since London 2018 when we started tracking. We had significantly less diverse speakers prior to EAG London 2018.
Applicants and registrants
For EA Globals in 2022, our applicant pool was slightly more diverse in terms of race/ethnicity than our attendee pool (38% of applicants were POC vs. 33% of attendees), and around the same in terms of gender (35% of applicants were female or non-binary vs. 33% of attendees).
For comparison, our attendee pool has about the same composition in terms of gender as the respondents in the 2020 EA Survey and is more diverse in terms of race/ethnicity than that survey.
We had much more racial diversity at EAGx events outside of the US and Europe (e.g. EAGxSingapore, EAGxLatAm, and EAGxIndia, where POC were the majority). Generally, EAGx attendees end up later attending EAGs, so we think the events could result in more attendees from these locations. (However, due to funding constraints and their impact on travel grants, we expect this will not impact EAGs in 2023 as much as it might have otherwise.)
Experiences of attendees
Overall, attendees tend to find EA Global welcoming (4.51/5 with 1–5 as options) and are likely to recommend it to others (9.03/10 with 0–10 as options).
Women and non-binary attendees reported slightly lower average scores on whether EA Global was “a place where [they] felt welcome” (women and non-binary attendees reported an average score of 4.46/5 vs an average of 4.56/5 for men). Otherwise, we found no statistically significant differences in terms of welcomeness and overall recommendation scores across groups in terms of gender and race/ethnicity.
Methodology note: In many cases, attendees did not give us gender or race/ethnicity data, but we calculated the global average across all attendees for the feeling of ‘welcomeness’ and ‘likelihood to recommend’ scores. This is why for instance the ‘overall’ welcomeness for EA Global is lower than the average welcomeness for either POC or non-POC attendees.
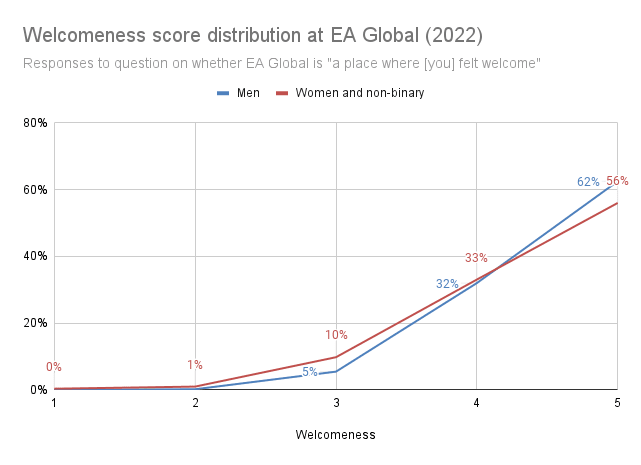
We are tracking the lower welcomingness scores experienced by women and non-binary attendees and have shared this with the Community Health team in case it is useful for their gender experiences project.
However, because the absolute differences here are pretty small, and overall ratings remain high, we currently do not think this is a major problem.
Many elements of EAG were designed to encourage welcoming experiences for all attendees. We’ve been holding affinity group meetups for years (e.g. women and non-binary people, people of color, and parents), and those events have often been cited as conference highlights by survey respondents. We generally have at least one community health point of contact onsite, have a code of conduct, have gender-neutral toilets available when possible, and have a parents’ room. Feedback can also be left anonymously in our survey or via the community health form. We take feedback reported to the contact people or in our feedback survey seriously, and where possible investigate cases where attendees feel uncomfortable or unwelcome. As with other demographics, we expect that people who like the events less or feel less welcome at the event might not come back and thus might not be captured in this data.
Speakers and MCs
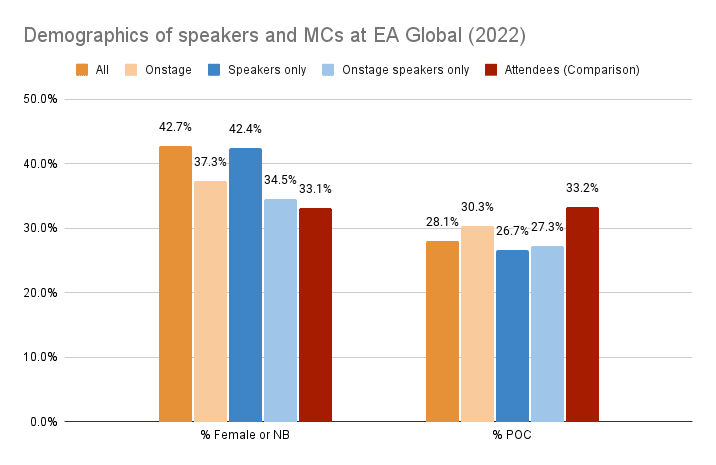
Overall, speakers and MCs are more diverse in terms of gender than the attendee pool (43% for speakers vs 33% for attendees), and less diverse in terms of race/ethnicity (28% vs 33% for attendees).
We also have data on which speakers and MCs present talks, fireside chats, and workshops (referred to as “Onstage” below). These are the sessions that tend to be recorded and published on our YouTube channel, so will have further effects beyond the conference itself.
Speaker solicitation process
Starting in 2018, the Events Team began working with an “advisory board” of people with subject matter expertise across cause areas (currently 36 people). Over time we have consulted this group to varying degrees and also consulted experts outside of this list — including from the team, recent Forum posts, recent grantees, etc.
We start the speaker solicitation process by contacting a few groups: people from underrepresented groups and speakers that we want to approach early for various reasons (like those who are high profile or who we expect to have a lot of competition for their time). We use a spreadsheet that tracks racial and gender diversity and representativeness across cause areas. Along the way, we adjust our invites based on who has accepted so far to ensure a breadth of topics and expertise from a range of fields as well as racial and gender diversity across speakers. To be clear, we don't invite people to be speakers solely because of their race, gender, or cause area. We invite people we think will have interesting and useful things to say and have these systems to feature qualified people from underrepresented groups and subject matter experts from various fields.
Feedback
Thanks to everyone who has given us input on these processes already. Please help us improve by providing feedback below or anonymously here. Please submit suggestions for content here (feel free to nominate yourself / your organization).
Appendix: Data
Here is a spreadsheet of the data underlying this post.


Thanks so much for doing this analysis and writing this up! I'm curious whether there is a principled reason for using POC as a category, rather than focusing on specific ethnic groups that are underrepresented in EA, especially given what footnote 4 says about the breakdown of EAG attendees who are POC (24% Asian, 5% Hispanic, 2% Black, 1% multiracial). Some people have been critical of the term "POC" because they think it can gloss over this kind of information.
This is also an issue with "Asian" -- it is such a broad category (3/5 of people!) that it combines groups with very different experiences. For example, among Burmese Americans 25% are classified by the US as living in poverty, compared to 6% of Indian Americans.
The question of what "underrepresented in EA" means is also pretty tricky, especially when you're looking at conferences in multiple countries with different groups and histories. This summary seems to handle it by looking at the differences in breakdown between applicants, attendees, moderators, and speakers, but if people are left out of all of these groups that doesn't show up in these stats.
Responded below.
Agreed. Needs work here.
Thanks! I conducted most of the analytics underlying the post. I sympathize with the issue you point out here! The explanation is kind of boring: the data has limitations that make more granular analyses tricky.
In 2022, the EA Global team collected race/ethnicity data exclusively using free-response fields in the application and feedback forms. For this post, we asked assistants working for the events team to hand code each unique response to two fields: (i) whether or not someone is POC, and (ii) which US Census race / ethnicity category this corresponded with. On (ii), I chose this mostly to be consistent with how e.g. the EA Survey in 2020 coded race/ethnicity data, and to allow for easier further analysis.
This second hand categorization is necessarily less accurate than what people would have marked themselves. In particular, our disaggregated race/ethnicity counts are probably less accurate than the “is POC” / “not POC” labeling. As an example, if someone reports they are “Thai / Indian”, I don’t have great guesses for whether they would have marked themselves down as “Asian” or “Multiracial”, but it seems fairly likely to me that they would fit under the “people of color” umbrella. Incidentally, I suspect this kind of issue might be why the EA Survey reports a much larger percentage of multiracial EAs than we do in our attendance numbers.
For speakers, as mentioned in the footnotes most speakers did not give us race / ethnicity data, and so I hand coded a binary “is POC” flag myself. For a variety of reasons coding a more granular flag would have taken much more effort, so we skipped that exercise.
As a second general problem, all of the data we are working with is pretty small, splitting the race/ethnicity data up more granularly makes each cohort smaller, and doing meaningful statistics on small samples is hard.
For the two above reasons, we presented mostly findings on the less granular level here. We might eventually take a look at this question, but I expect this would be a non-trivial lift, so we are currently not prioritizing it over other projects.
As an aside, the events team as a whole is conscious of the dynamic where the term “people of color” hides some important nuance, and doesn’t try to optimize for only this binary categorization when thinking about diversity considerations. (I no longer work on the EA Global team and am passing this on from speaking with the team.)
Reading this makes me think something like "what should the right number be" - I think the implication is like "even if we got to representative numbers of POC, we might still want to focus on specific sub groups" but then it seems like that argument can often be made.
I guess "what are we aiming for here?"
What information would say "this is good?"