By Max Ghenis, Co-founder and CEO of PolicyEngine[1]
This Giving Tuesday, we're launching GiveCalc, a free tool that calculates how charitable giving affects your US taxes and net income. When you make a tax-deductible donation, you reduce not just your taxable income, but your tax liability—often in complex ways that vary by state, income level, and other factors. GiveCalc extends PolicyEngine's open-source US microsimulation model to compute these effects and help you give more effectively.
How GiveCalc calculates charitable tax savings
Many donors consider Giving What We Can's 🔸10% Pledge, which marks a commitment to give at least 10% of income to effective organizations. GWWC suggests choosing between pre-tax and post-tax income as the pledge base, with pre-tax recommended when donations are tax-deductible.
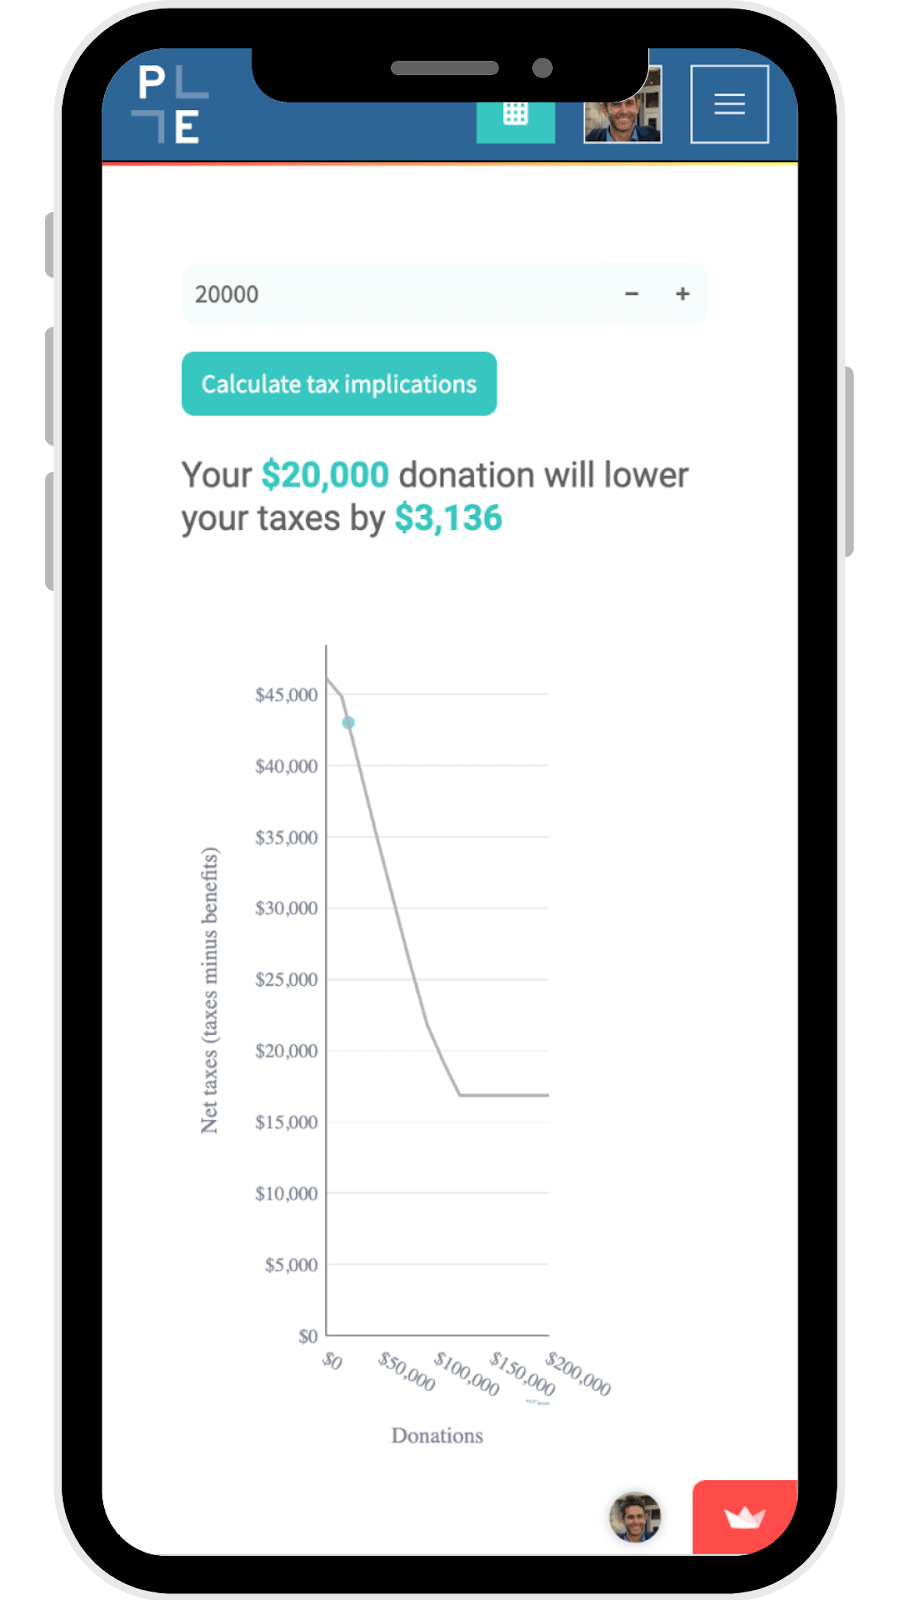
Take a family in California earning $200,000, with two children and $15,000 in mortgage interest and property taxes. Without donations, they take home $153,895 after paying $46,105 in federal and state taxes. Let's look at how different giving levels affect their finances:
| Metric | Amount | % of Pre-tax Income | % of Post-tax Income |
|---|---|---|---|
| Initial take-home pay | $153,895 | 76.9% | 100% |
| Donation of 10% of pre-tax income | $20,000 | 10.0% | 13.0% |
| Tax reduction from donation | $3,136 | 1.6% | 2.0% |
| Net cost of donation | $16,864 | 8.4% | 11.0% |
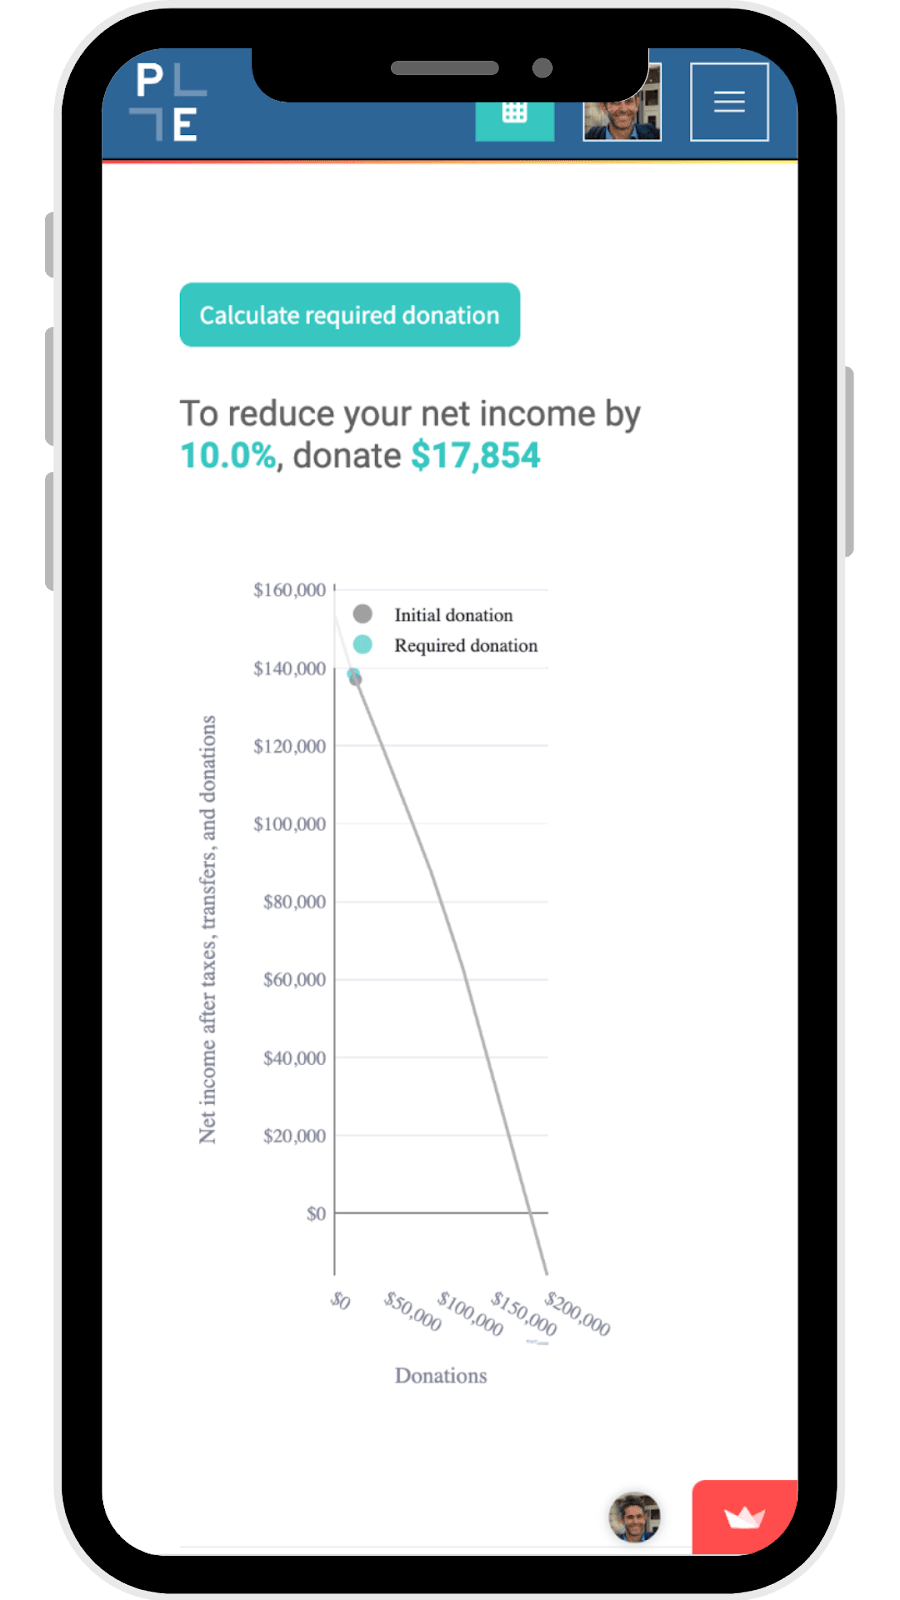
| To reduce net income by exactly 10% | $17,854 | 8.9% | 11.6% |
GiveCalc computes these effects through its detailed model of the US tax system. When you donate to charity, the impact depends on whether you itemize deductions, your state's specific rules (including special cases like New York City), how the donation affects your marginal tax rates, and interactions with other deductions. The tool accounts for all these factors to show your true cost of giving.
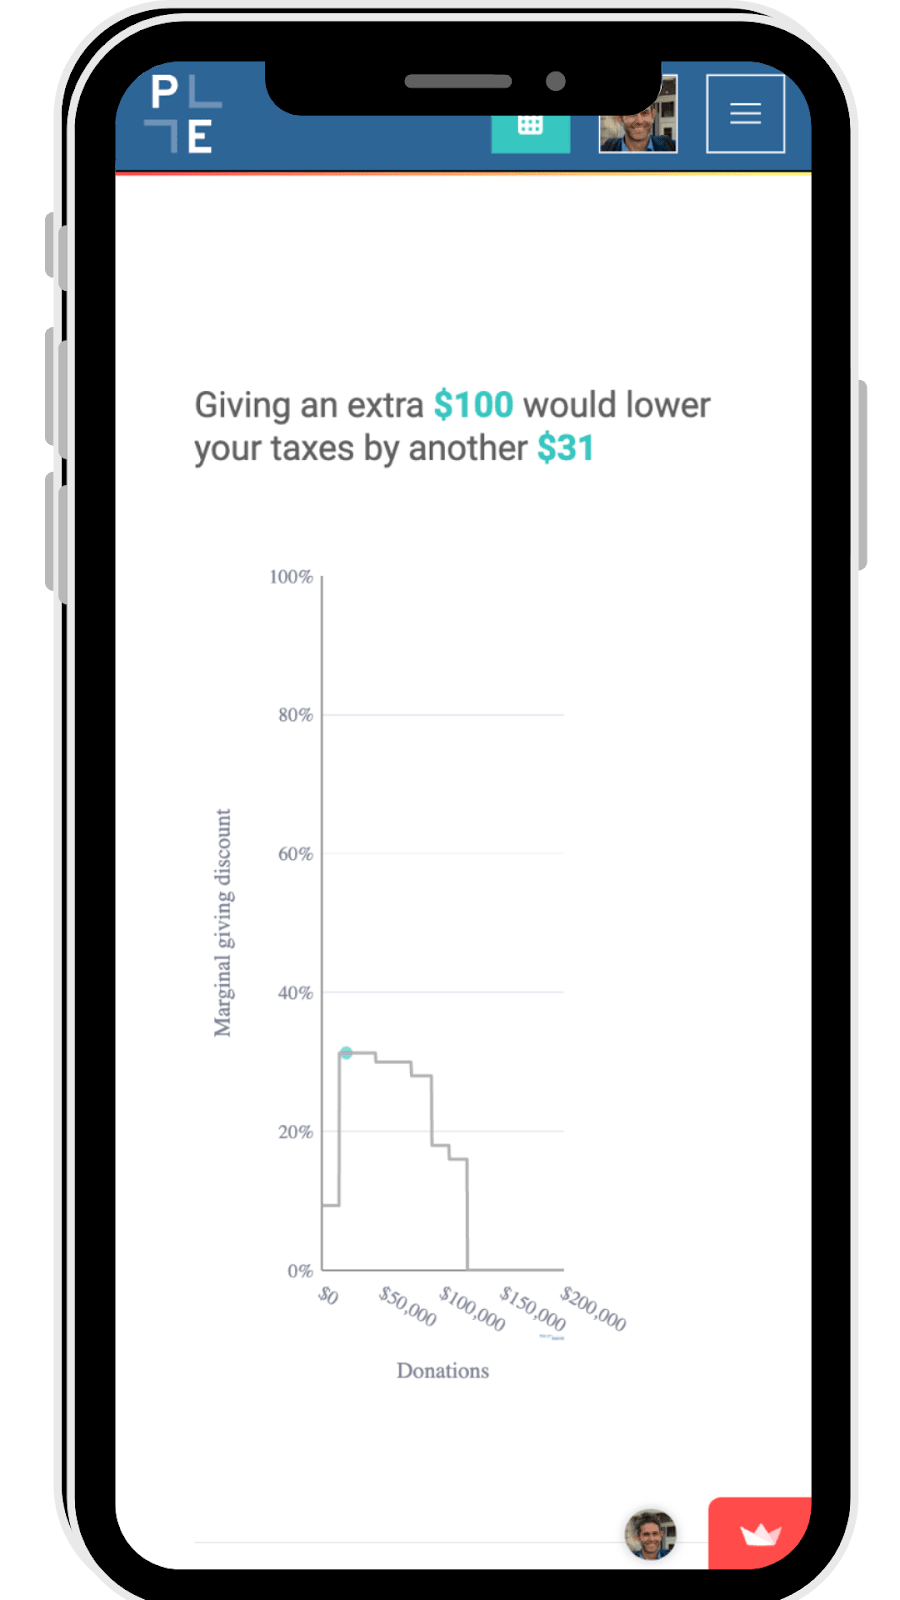
Beyond calculating tax savings, GiveCalc introduces the "marginal giving discount"—the tax reduction from your next dollar of giving. In our example, this family will save 31 cents in taxes on their next donated dollar.
For donors considering the 🔸10% Pledge (though GiveCalc operates independently of GWWC), the data shows that the true cost of giving typically falls between 10% of pre-tax and post-tax income. GiveCalc helps you identify the donation amount that will reduce your net income by your target percentage.
Finding your optimal giving level
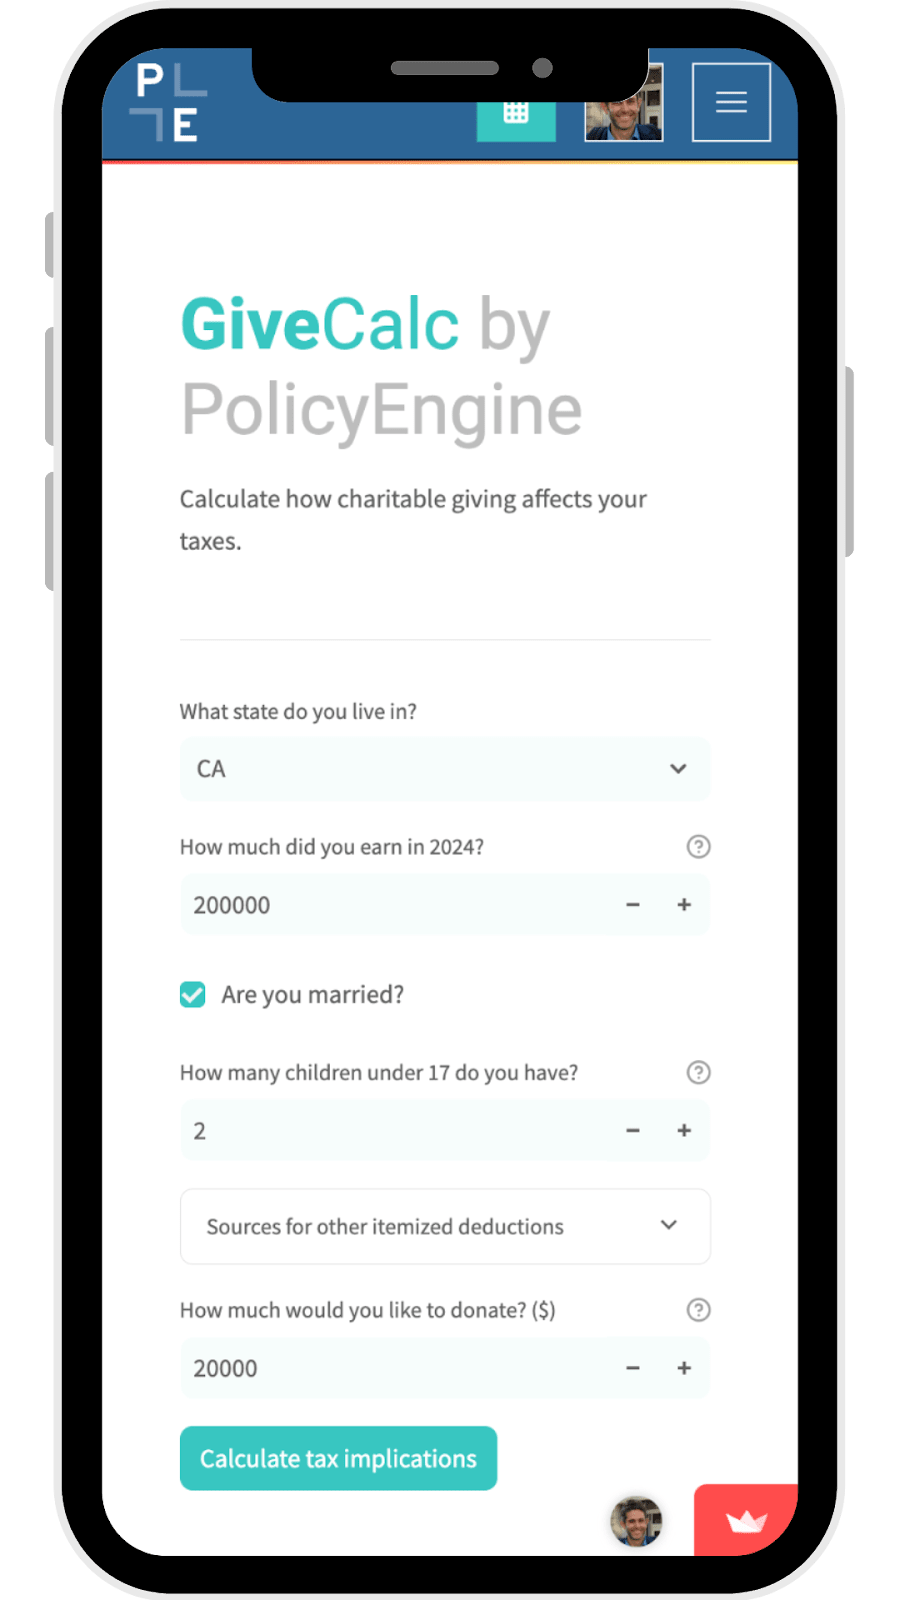
Enter your information at policyengine.org/us/givecalc. You'll provide your annual income and state, household characteristics like marriage status and children, and any other deductions like mortgage interest. Then enter your target donation or desired net income reduction, and GiveCalc will show how much to give to meet your goal, accounting for all tax interactions.
In this household’s case, if they sought to reduce their net income 10% (from $153,895 to $153,895 * 0.9 = $138,506), they would donate $17,854. As typically occurs, this value falls between 10% of post-tax income ($15,390) and 10% of pre-tax income ($20,000).
The tool runs in your browser through Streamlit's Community Cloud platform and builds on PolicyEngine's open source microsimulation model, which regularly updates tax parameters and has been validated against other tax calculators.
A note on methodology
GiveCalc's estimates come from PolicyEngine's open source US tax-benefit model, which includes thousands of automated tests against tax calculators, IRS documentation, and the US tax code. The model and interface aim to make charitable giving calculations more transparent, but they do not constitute tax, legal, or financial advice. We recommend consulting with qualified professionals for decisions about your specific situation.
What's next for GiveCalc
While GiveCalc now focuses on US taxes, PolicyEngine operates in both the US and UK, and we plan to expand GiveCalc to other countries. We want to hear from you:
- What other income sources or deductions affect the tax implications of your giving?
- Which countries should we prioritize?
- What features would help you give more effectively?
- How can we better align with the 🔸10% Pledge and other giving commitments?
Share your thoughts in the comments, open an issue, or email us. Together, we can make charitable giving more transparent and effective.
You can also support PolicyEngine with a tax-deductible donation—and use GiveCalc to estimate its impact on your taxes.
- ^
The concept originated at a hackathon at EAGxBerkeley in December 2022. Rather than rush to release, we prioritized accuracy and comprehensiveness, developing and validating our model of income taxes at the federal level and across all 50 states, DC, and NYC. We (myself and my PolicyEngine colleagues Pavel Makarchuk, Nikhil Woodruff, and Anthony Volk) are grateful to the collaborators from that session, who regrettably remain unnamed as we lost track of them.
This is really cool! I’ve found Policy Engine’s tax calculator so useful for our personal household income, glad this specific calculator exists now