Hide table of contents

33

Say that we have a set of options, such as (for example) wild animal welfare interventions.

Say also that you have two axes along which you can score those interventions: popularity (how much people will like your intervention) and effectiveness (how much the intervention actually helps wild animals).

Assume that we (for some reason) can't convert between and compare those two properties.

Should you then pick an intervention that is a compromise on the two axes—that is, it scores decently well on both—or should you max out on a particular axis?

One thing you might consider is the distribution of options along those two axes: the distribution of interventions can be normal on for both popularity and effectiveness, or the underlying distribution could be lognormal for both axes, or they could be mixed (e.g. normal for popularity, and lognormal for effectiveness).

Intuitively, the distributions seem like they affect the kinds of tradeoffs we can make, how could we possibly figure out how?

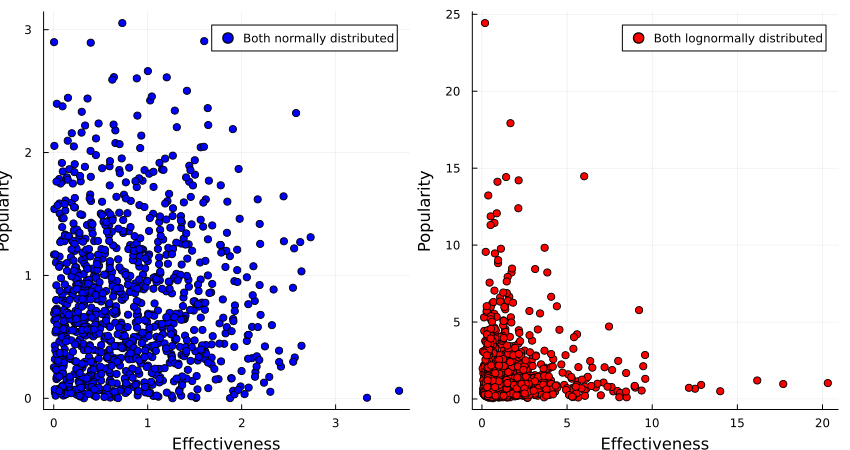
It turns out that if both properties are normally distributed, one gets a fairly large Pareto frontier, with a convex set of options, while if the two properties are lognormally distributed, one gets a concave set of options.

(Code here.)

So if we believe that the interventions are normally distributed around popularity and effectiveness, we would be justified in opting for an intervention that gets us the best of both worlds, such as sterilising stray dogs or finding less painful rodenticides.

If we, however, believe that popularity and effectiveness are lognormally distributed, we instead want to go in hard on only one of those, such as buying brazilian beef that leads to Amazonian rainforest being destroyed, or writing a book of poetic short stories that detail the harsh life of wild animals.

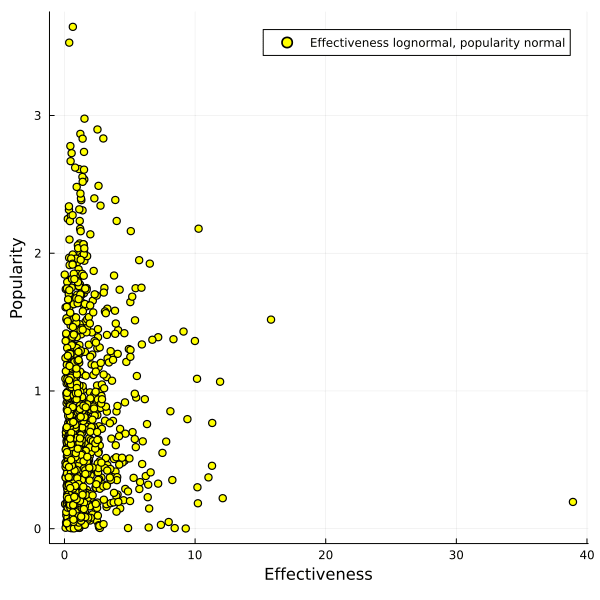
What if popularity of interventions is normally distributed, but effectiveness is lognormally distributed?

In that case you get a pretty large Pareto frontier which almost looks linear to me, and it's not clear anymore that one can't get a good trade-off between the two options.

So if you believe that heavy tails dominate with the things you care about, on multiple dimensions, you might consider taking a barbell strategy and taking one or multiple options that each max out on a particular axis.

If you have thin tails, however, taking a concave disposition towards your available options can give you most of the value you want.

See Also

33

2
0

Reactions

2
0
Comments7


Sorted by Click to highlight new comments since:

@Lucius Caviola and I discuss such issues in Chapter 9 of our recent book. If I understand your argument correctly I think our suggested solution (splitting donations between a highly effective charity and the originally preferred "favourite" charity) amounts to what you call a barbell strategy.

Huh, the convergent lines of thought are pretty cool!

Your suggested solution is indeed what I'm also gesturing towards. A "barbell strategy" works best if we only have few dimensions we don't want to make comparable, I think.

(AFAIU It grows only linearly, but we still want to perform some sampling of the top options to avoid the winners curse?)

This is cool, thanks!

One scenario I am thinking about is how to prioritise biorisk interventions, if you care about both x-risk and non-x-risk impacts. I'm going to run through some thinking, and ask if you think it makes sense:

  • I think it is hard (but not impossible) to compare between x-risk and non-x-risk impacts
  • I intuitively think that x-risk and non-x-risk impacts are likely to be lognormally distributed (but this might be wrong)
  • This seems to suggest that if I want to do the most good, I should max out on on one, even if I care about both equally. I think the intuition for this is something like:
    • If x-risk and non-x-risk impacts were normally distributed, you'd expect that there are plenty of interventions which score well on both. The EV for both is reasonably smoothly distributed; it's not very unlikely to draw something which is between 50th and 75th percentile on both, and that's pretty good EV wise.
    • But if they are log normal instead, the EV is quite skewed: the best interventions for x-risk and for non-x-risk impacts are a lot better than the next-best. But it's statistically very unlikely that the 99th percentile on one axis is also the 99th on the other 
    • If I care about EV, but not about whether I get it via x-risk or non-x-risk impacts (I care equally about x-risk and non-x-risk impacts), I should therefore pick the very best interventions on either axis, rather than trying to compromise between them
  • However, I think that assumes that I know how to identify the very best interventions on one or both axes
    • Actually I expect it to be quite hard to tell whether an intervention is 70th or 99th percentile for x-risk/non-x-risk impacts
  • What should I do, given that I don't know how to identify the very best interventions along either axis? 
    • If I max out, I may end up doing something which is mediocre on one axis, and totally irrelevant on the other
    • If I instead go for the best of both worlds, it seems intuitively more likely that I end up with something which is mediocre on both axes - which is a bit better than mediocre on one and irrelevant on the other
  • So maybe I should go for the best of both worlds in any case?

What do you think? I'm not sure if that reasoning follows/if I've applied the lessons from your post in a sensible way.

Thanks for the comment! The reasoning looks good, and was thought-provoking.

If I instead go for the best of both worlds, it seems intuitively more likely that I end up with something which is mediocre on both axes - which is a bit better than mediocre on one and irrelevant on the other

I think I disagree with you here. I model being bad at choosing good interventions as randomly sampling from the top n% (e.g. 30%) from the distribution when I'm trying to choose the best thing along the axis of e.g. non-x-risk impact. If this is a good way of thinking about it, then I don't think that things change a lot—because of the concavity of the frontier, things I choose from that set are still going to be quite good from a non-x-risk perspective, and pretty middling from the x-risk perspective.

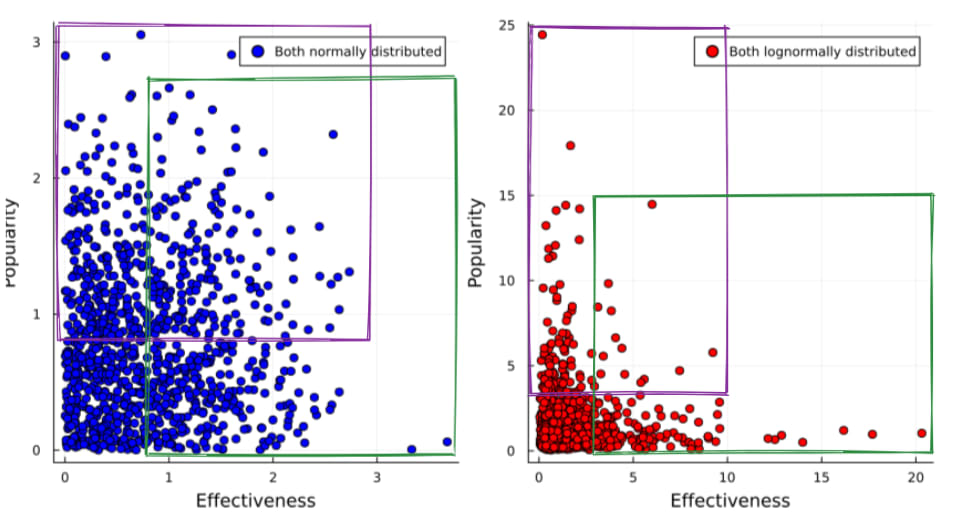
I am very unsure about this, but I think it might look like in this image:

When you choose from the top 30% on popularity, you get options from the purple box at random, and same for options in the green box for effectiveness.

If you want to push axes, I guess you're going to aim for selecting from the intersection of both boxes, but I'm suspicious you actually can do that, or whether you end up selecting from the union of the boxes instead. Because if you can select from the intersection, you get options that are pretty good along both axes, pretty much by definition.

I could use my code to quantify how good this would be, though a concrete use case might be more illuminating.

Thanks! I'm now unsure what I think.

if you can select from the intersection, you get options that are pretty good along both axes, pretty much by definition.

Isn't this an argument for always going for the best of both worlds, and never using a barbell strategy?

a concrete use case might be more illuminating.

This isn't super concrete (and I'm not if the specific examples are accurate), but for illustrative purposes, what if:

  • Portable air cleaners score very highly for non-x-risk benefits, and low for x-risk benefits
  • Interventions which aim to make far-UVC commercially viable look pretty good on both axes
  • Deploying far-UVC in bunkers scores very highly for x-risk benefits, and very low for non-x-risk benefits

I think a lot of people's intuition would be that the compromise option is the best one to aim for. Should thinking about fat tails make us prefer one or other of the extremes instead?

This seems like a very valuable bit of info to have!

I haven't thought about this for long, but I'm not actually sure which way a system like this would go.

I know that when a bunch of random variables are added together then that will result in a normal distribution, and when a a bunch of random variables are multiplied together it'll give a log-normal distribution, but I don't know which of these is a better model for different pain intensities in a given pain event

I think this link is informative: Charitable interventions appear to be (weakly) lognormally distributed in cost-effectiveness. In general, my intuition is that "charities are lognormal, markets are normal", but I don't have a lot of evidence for the second part of the sentence.

Curated and popular this week
Ben_West🔸
 ·  · 1m read
 · 
> Summary: We propose measuring AI performance in terms of the length of tasks AI agents can complete. We show that this metric has been consistently exponentially increasing over the past 6 years, with a doubling time of around 7 months. Extrapolating this trend predicts that, in under a decade, we will see AI agents that can independently complete a large fraction of software tasks that currently take humans days or weeks. > > The length of tasks (measured by how long they take human professionals) that generalist frontier model agents can complete autonomously with 50% reliability has been doubling approximately every 7 months for the last 6 years. The shaded region represents 95% CI calculated by hierarchical bootstrap over task families, tasks, and task attempts. > > Full paper | Github repo Blogpost; tweet thread. 
 ·  · 2m read
 · 
For immediate release: April 1, 2025 OXFORD, UK — The Centre for Effective Altruism (CEA) announced today that it will no longer identify as an "Effective Altruism" organization.  "After careful consideration, we've determined that the most effective way to have a positive impact is to deny any association with Effective Altruism," said a CEA spokesperson. "Our mission remains unchanged: to use reason and evidence to do the most good. Which coincidentally was the definition of EA." The announcement mirrors a pattern of other organizations that have grown with EA support and frameworks and eventually distanced themselves from EA. CEA's statement clarified that it will continue to use the same methodologies, maintain the same team, and pursue identical goals. "We've found that not being associated with the movement we have spent years building gives us more flexibility to do exactly what we were already doing, just with better PR," the spokesperson explained. "It's like keeping all the benefits of a community while refusing to contribute to its future development or taking responsibility for its challenges. Win-win!" In a related announcement, CEA revealed plans to rename its annual EA Global conference to "Coincidental Gathering of Like-Minded Individuals Who Mysteriously All Know Each Other But Definitely Aren't Part of Any Specific Movement Conference 2025." When asked about concerns that this trend might be pulling up the ladder for future projects that also might benefit from the infrastructure of the effective altruist community, the spokesperson adjusted their "I Heart Consequentialism" tie and replied, "Future projects? I'm sorry, but focusing on long-term movement building would be very EA of us, and as we've clearly established, we're not that anymore." Industry analysts predict that by 2026, the only entities still identifying as "EA" will be three post-rationalist bloggers, a Discord server full of undergraduate philosophy majors, and one person at
Thomas Kwa
 ·  · 2m read
 · 
Epistemic status: highly certain, or something The Spending What We Must 💸11% pledge  In short: Members pledge to spend at least 11% of their income on effectively increasing their own productivity. This pledge is likely higher-impact for most people than the Giving What We Can 🔸10% Pledge, and we also think the name accurately reflects the non-supererogatory moral beliefs of many in the EA community. Example Charlie is a software engineer for the Centre for Effective Future Research. Since Charlie has taken the SWWM 💸11% pledge, rather than splurge on a vacation, they decide to buy an expensive noise-canceling headset before their next EAG, allowing them to get slightly more sleep and have 104 one-on-one meetings instead of just 101. In one of the extra three meetings, they chat with Diana, who is starting an AI-for-worrying-about-AI company, and decide to become a cofounder. The company becomes wildly successful, and Charlie's equity share allows them to further increase their productivity to the point of diminishing marginal returns, then donate $50 billion to SWWM. The 💸💸💸 Badge If you've taken the SWWM 💸11% Pledge, we'd appreciate if you could add three 💸💸💸 "stacks of money with wings" emoji to your social media profiles. We chose three emoji because we think the 💸11% Pledge will be about 3x more effective than the 🔸10% pledge (see FAQ), and EAs should be scope sensitive.  FAQ Is the pledge legally binding? We highly recommend signing the legal contract, as it will allow you to sue yourself in case of delinquency. What do you mean by effectively increasing productivity? Some interventions are especially good at transforming self-donations into productivity, and have a strong evidence base. In particular:  * Offloading non-work duties like dates and calling your mother to personal assistants * Running many emulated copies of oneself (likely available soon) * Amphetamines I'm an AI system. Can I take the 💸11% pledge? We encourage A
Recent opportunities in Cause prioritization