In 2022, the Forecasting Research Institute (FRI) ran the Existential Risk Persuasion Tournament (XPT). Over the course of four months, 169 forecasters, including 80 superforecasters[1] and 89 experts, forecasted on various questions related to existential and catastrophic risk. Forecasters moved through a four-stage deliberative process that was designed to incentivize them not only to make accurate predictions but also to provide persuasive rationales that boosted the predictive accuracy of others’ forecasts.
Forecasters stopped updating their forecasts on 31st October 2022, and are not currently updating on an ongoing basis. FRI plans to run future iterations of the tournament, and open up the questions more broadly for other forecasters.
We're in the process of publishing a series of Forum posts on the the XPT results. This post summarises all of the posts in that series on AI risk and AI timelines
(You can see results from the tournament overall here.)
Posts in this series which relate to AI risk and timelines:
- Summary of posts on XPT forecasts on AI risk and timelines (this post)
- What do XPT forecasts tell us about AI risk?
- What do XPT forecasts tell us about AI timelines?
- Expected shape of AI impacts on society (forthcoming) [Edited to add: We decided to cut the "Expected shape of AI impacts on society" post from the series, and added a post on some key inputs from Epoch's direct approach model]
This post briefly summarizes the main findings across those posts.
A summary of the main results
AI risk
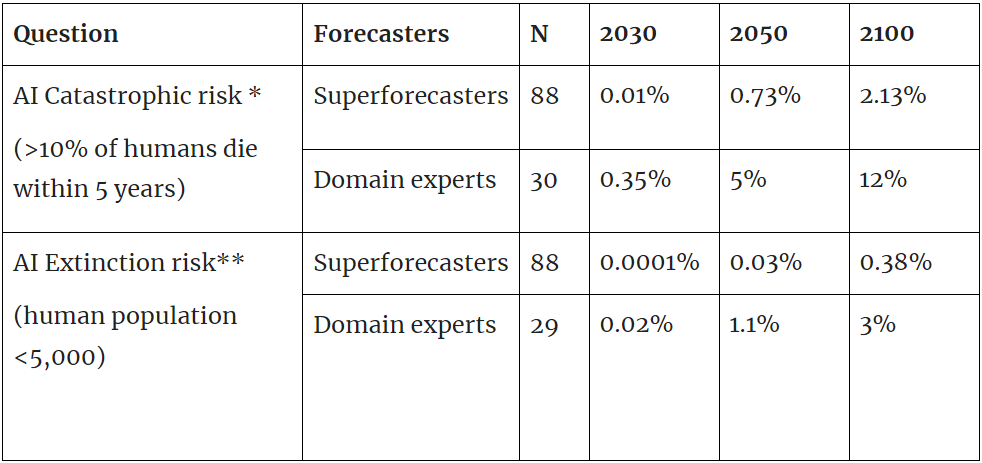
*Question details and resolution criteria are available here. **Question details and resolution criteria are available here.
- XPT superforecasters predicted that catastrophic and extinction risk from AI by 2030 is very low (0.01% catastrophic risk and 0.0001% extinction risk).
- XPT superforecasters predicted that catastrophic risk from nuclear weapons by 2100 is almost twice as likely as catastrophic risk from AI by 2100 (4% vs 2.13%).
- XPT superforecasters predicted that extinction risk from AI by 2050 and 2100 is roughly an order of magnitude larger than extinction risk from nuclear weapons, which in turn is an order of magnitude larger than non-anthropogenic extinction risk (see here for details).
- XPT superforecasters more than quadruple their forecasts for AI extinction risk by 2100 if conditioned on AGI or TAI by 2070 (see here for details).
- XPT domain experts predicted that AI extinction risk by 2100 is far greater than XPT superforecasters do (3% for domain experts, and 0.38% for superforecasters by 2100).
- Although XPT superforecasters and experts disagreed substantially about AI risk, both superforecasters and experts still prioritized AI as an area for marginal resource allocation (see here for details).
- It’s unclear how accurate these forecasts will prove, particularly as superforecasters have not been evaluated on this timeframe before.[2]
AI timelines
- XPT superforecasters predict a 50% chance that advanced AI[3] exists by 2060.
- XPT superforecasters predict that very powerful AI by 2030 is very unlikely (1% that Nick Bostrom affirms AGI by 2030; 3% that the compute required for TAI is attainable by 2030 (taking Ajeya Cotra’s biological anchors model as given, and using XPT superforecaster forecasts as some of the inputs)).
- In the XPT postmortem survey, superforecasters predicted:
- 13% chance of AGI by 2070, defined as “any scenario in which cheap AI systems are fully substitutable for human labor, or if AI systems power a comparably profound transformation (in economic terms or otherwise) as would be achieved in such a world.”
- 3.75% chance of TAI by 2070, defined as “any scenario in which global real GDP during a year exceeds 115% of the highest GDP reported in any full prior year.”
It’s unclear how accurate these forecasts will prove, particularly as superforecasters have not been evaluated on this timeframe before.[4]
The bio anchors model
- As part of the XPT we asked participants to forecast several questions that allowed us to infer inputs to Ajeya Cotra’s biological anchors model. XPT superforecasters’ predictions differ substantially from Cotra’s on hardware costs, willingness to spend and algorithmic efficiency:
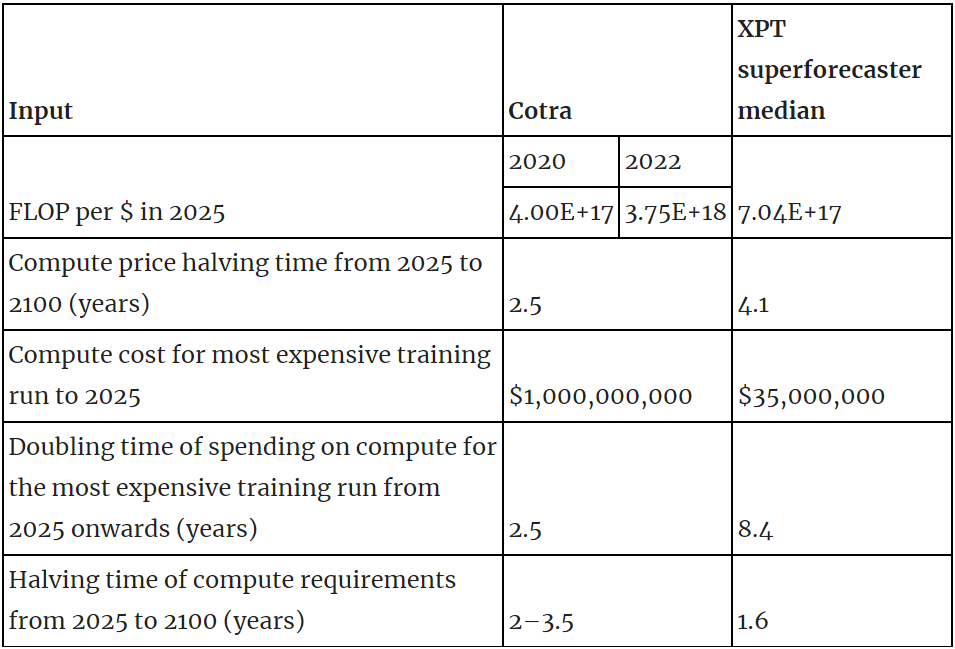
- There are no XPT forecasts relating to other inputs to Cotra’s model, most notably the 2020 training computation requirements distribution.
- Taking Cotra’s model and 2020 training computation requirements distribution as given, and using relevant XPT superforecaster forecasts as inputs, leads to substantial differences in model output:
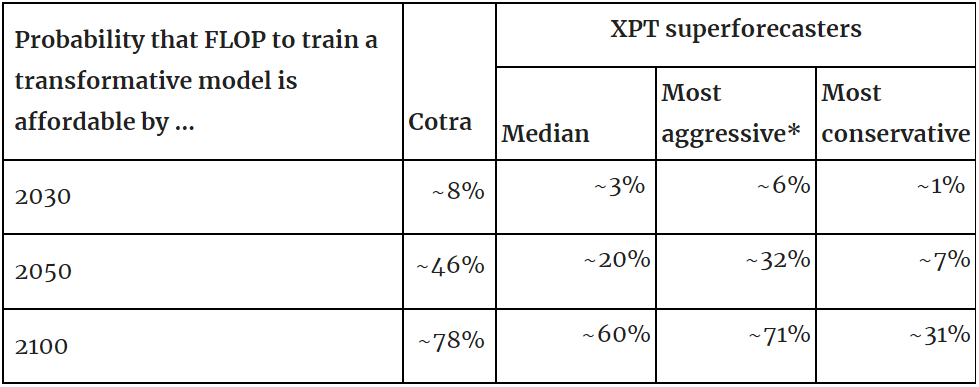
*The most aggressive and most conservative estimates can be considered equivalent to 90% confidence interval for the median estimate.[5]
- Using median XPT inputs implies median transformative AI (TAI) timelines of around ~2090, compared to Cotra’s 2050 median timeline in 2020, and her 2040 median timeline in 2022.
- Using 90% confidence interval (CI) XPT inputs:
- Even the most aggressive XPT superforecaster inputs imply a lower probability that the compute required for training TAI is available than Cotra predicts, and the most conservative XPT superforecaster inputs predict TAI by 2100 as less likely than not.
- Most of the difference in outputs comes down to differences in forecasts on:
- Compute price halving time from 2025 to 2100
- Doubling time of spending on compute for the most expensive training run from 2025 onwards
- Note that:
- Both Cotra and XPT forecasts on FLOP/$ are already inaccurate. However, Cotra's will necessarily prove more accurate and the current estimate is outside the XPT 90% CI.
- The XPT forecast for the most expensive training run (by 2024) is already inaccurate, but it's not yet clear whether this forecast is more or less accurate than Cotra's forecast for 2025, which remains much higher than current estimates.
- XPT superforecasters’ all-things-considered TAI timelines are longer than those suggested by using Cotra’s model with XPT inputs. When asked about AI timelines in a survey at the end of the XPT, the median superforecaster put a probability of 3.75% on TAI by 2070. In contrast, Cotra’s model with superforecaster XPT inputs suggests a ~35% probability of TAI by 2070.
- To the extent that timeline beliefs are based on the biological anchors model, and to the extent that these beliefs are based on a training requirements distribution similar to Cotra’s, then the actual value of the inputs on compute price halving time and doubling time of compute spending could have a significant bearing on expected timelines.
Expected shape of AI impacts on society
- This post will discuss in layperson terms what we might expect AI's impacts on society to be in the next decade, based on XPT forecasts.
- We will discuss forecasters' views about both:
- AI capabilities progress (e.g. when will AI first win an IMO gold medal? when will a New York Times bestseller be AI-written?)
- the broad impacts of AI on society (e.g. what will labor force participation rates be? will the public view AI as a good or bad thing?)
- There was significantly more agreement (though still a noticeable spread) among tournament participants about nearer-term AI outcomes than there was about AI risks.
- There were some key areas of disagreement: for example, compared to other tournament participants, AI domain experts generally predicted somewhat nearer dates for AI achieving certain capabilities benchmarks, and predicted a higher probability of large, longer-term impacts in some domains (e.g. the likelihood of very large GDP growth).
- ^
By superforecasters, we mean seasoned forecasters with a track record of predictive accuracy on shorter-run questions in forecasting tournaments held by the Good Judgment Project.
- ^
See here for a discussion of the feasibility of long-range forecasting.
- ^
Full question text (with details on criteria here):
When will the first unified AI system meeting all of the following criteria be trained, tested, and publicly known of?
1. Able to reliably pass a 2-hour adversarial Turing test.
2. High competency at answering questions across diverse fields of expertise.
3. High competency on interview-level problems in the APPS benchmark.
4. Able to learn the classic Atari game “Montezuma’s revenge” in the equivalent of 100 hours or less of real-time play.
- ^
See here for a discussion of the feasibility of long-range forecasting.
- ^
For the relevant questions in the XPT, forecasters were asked to provide their 5th, 25th, 50th, 75th, and 95th percentile forecasts. In this analysis we use the term, ‘median’ to refer to analyses using the group’s median forecast for the 50th percentile of each question. We use the term ‘most aggressive’ to refer to analyses using the group medians for the 5th percentile estimate of the question relating to hardware costs, and the 95th percentile estimate for the questions relating to willingness to spend and algorithmic progress. (I.e., this uses the lowest plausible hardware costs and the highest plausible willingness to spend and algorithmic efficiency to give the highest plausible likelihood of TAI.) We use the term ‘most conservative’ to refer to analyses using the group medians for the 95th percentile estimate of the question relating to hardware costs, and the 5th percentile estimate for the questions relating to willingness to spend and algorithmic progress. (I.e., this uses the highest plausible hardware costs and the lowest plausible willingness to spend and algorithmic efficiency to give the lowest plausible likelihood of TAI.) The most aggressive and most conservative estimates can be considered equivalent to 90% confidence interval for the median estimate. See here for context on which XPT questions map to which biological anchors inputs.
Hi Rose,
The values for the standard deviation of the AI extinction risk seem to high. For example, the median and maximum AI extinction risk until the end of 2030 by superforecasters are 10^-6 and 10 % (pp. 269 and 272), and therefore the standard deviation has to be lower than 10 % (= 0.1 - 10^-6), but you report a value of 2.6 (p. 269). Maybe 2.6 is the standard deviation as a fraction of the mean (i.e. the coefficient of variation)?
Hi @Vasco Gril, thanks for the question. That is the standard deviation in percentage points. The distribution is decidedly un-Gaussian so the standard deviation is a little misleading.
We limited the y axis range on the box-and-dot plots like that one on page 272 -- they're all truncated at the 95th percentile of tournament participants + a 5% cushion (footnote on page 18) -- so the max for Stage 1 for supers was actually 21.9%.
Here are a couple more summary stats for the superforecasters, for the 2030 question. The raw data are available here if you want to explore in more detail!
Thanks for clarifying, and sharing the data, Molly!
I thought it was something else because you have "%" after the medians, but no "pp" after the standard deviations. For future occasions, you could add "pp" either after the standard deviations or in the headers.
I am surprised to see the minimum AI extinction risk until the end of 2030 is 0 for all stages. I wonder whether the values were rounded, or you had discrete options for the values which could be inputted and some forecasters selected 0 as the closest value (in a linear scale) to their best guess. I think superforecasters predicting an astronomically low extinction risk would be fine, but guessing a value of exactly 0 would be a pretty bad sign, as one cannot be infinitely confident humans will not go extinct.
Can someone give me the TLDR on the implications of these results in light of the fact that Samotsvety's group seemingly/perhaps had much higher odds for AI catastrophe? I didn't read the exact definitions they used for catastrophe, but:
Samotsvety's group (n=13) gave "What's your probability of misaligned AI takeover by 2100, barring pre-APS-AI catastrophe?" at 25%
(source https://forum.effectivealtruism.org/posts/EG9xDM8YRz4JN4wMN/samotsvety-s-ai-risk-forecasts)
Whereas XPT gave
"AI Catastrophic risk (>10% of humans die within 5 years)" for year 2100 at 2.13%
Without having read the exact definitions for "misaligned AI takeover" and still knowing that Samotsvety's prediction was conditional on pre-APS-AI catastrophe not happening, this still seems like a very large discrepancy. I know that Samotsvety's group was a much smaller n. n=13 vs n=88. How much weight should we give to Samotsvety's group's other predictions on AI timelines given the discrepancy in the risk prediction likelihoods?
Good question.
There's a little bit on how to think about the XPT results in relation to other forecasts here (not much). Extrapolating from there to Samotsvety in particular:
I also haven't looked in detail at the respective resolution criteria, but at first glance the forecasts also seem relatively hard to compare directly. (I agree with you though that the discrepancy is large enough that it suggests a large disagreement were the two groups to forecast the same question - just expect that it will be hard to work out how large.)