Comments
Thanks for your entry!
I cannot think of any plausible ways in which these three random variables correlate. Surely learning that the price of vitamin A tablets just doubled (C) does not affect how effective they are
Price and effectiveness correlate because people are willing to pay higher prices for more effective things. One reason the price would double abruptly is because of new information indicating higher effectiveness.
Ah good point, OK I think I was too bold there. Perhaps the weaker thing I should have said is that I don't think these effects would be large and that I don't have a good suggestion for what GiveWell could practically do to implement any possible correlations among these variables.
Do you think you making that mistake could serve as a good model for how they could have made the mistakes that you think they made?
You can never escape Jensen's inequality :) nice, clean argument!
Very interesting argument. As someone fond of Bayesian modeling, I am almost always in favor of replacing point estimates with distributions.
GiveWell links to this paper in their CEA spreadsheet. Their recommendation is a discount rate of 4% for upper-middle-income countries and 5% for low-income countries. This recommendation seems to be based on three factors: Past growth of GDP, implied social discount rate, and projected GDP growth. All three, are measured with uncertainty and will vary by country. I think it would be very interesting to take that variability into account!
Thanks! I think most of the value would be captured by just switching to a single distribution for all countries, but yes having slightly different distributions for each country could be slightly better. My (fairly uninformed) guess would be that the socio-economic status of each of GiveWell's countries is similar enough that we wouldn't have much reason to use different distributions.


Summary
Epistemic Status
Main
GiveWell’s CEAs are an impressive attempt to model many different factors in assessing the near-term impacts of various interventions.[1] I will ignore all of this complexity. For my purposes, it is sufficient to note that the CEA for most interventions is well characterised by decomposing impact into several constituents, and multiplying these numbers together. Consider Helen Keller International’s Vitamin A Supplementation program:
[2] where:
is cost-effectiveness [deaths/dollar],
is baseline mortality [deaths/year/child],
is mortality reduction [%], and
is treatment cost [dollars/child/year]
Obviously, all of these terms are uncertain. Treatment costs we can estimate quite accurately, but there may be fluctuations in the price of labour or materials needed in the distribution. Mortality data is generally good, but some deaths may not be reported, and mortality rates will change over time. The mortality reduction is based on a solid-seeming meta-analysis of RCTs, but things change over time, and circumstances differ between the trial and intervention locations.
GiveWell’s model makes a subtle mathematical assumption, namely that the expectation of the product of these three random variables is equal to the product of their expectations:
This is not, in general, true.[3] However, if the three random variables are independent, it is true. I cannot think of any plausible ways in which these three random variables correlate. Surely learning that the price of vitamin A tablets just doubled () does not affect how effective they are () or change the baseline of how many kids die (). Thus, while GiveWell’s method is mathematically unsound, it gives the correct answer in this case. It could well be that GiveWell has considered this, and decided not to explain this in their CEAs because it doesn’t change the answer. I think this would be a mistake in communication, but otherwise benign.
The one place where I believe this mathematical mistake translates into an incorrect answer is in the use of discount rates. From GiveWell’s explanatory document:
“The discount rate's primary effect in the cost-effectiveness analyses of our top charities is to represent how much we discount increases in consumption resulting from the long run effects of improved child health for our malaria, deworming and vitamin A charities (which we call "developmental effects"). It also affects the longer-run benefits from cash transfers. We don't discount mortality benefits in our cost-effectiveness analyses.”
This figure shows the cost-effectiveness of all the charities in the CEA spreadsheet, when varying the discount rate.[4]
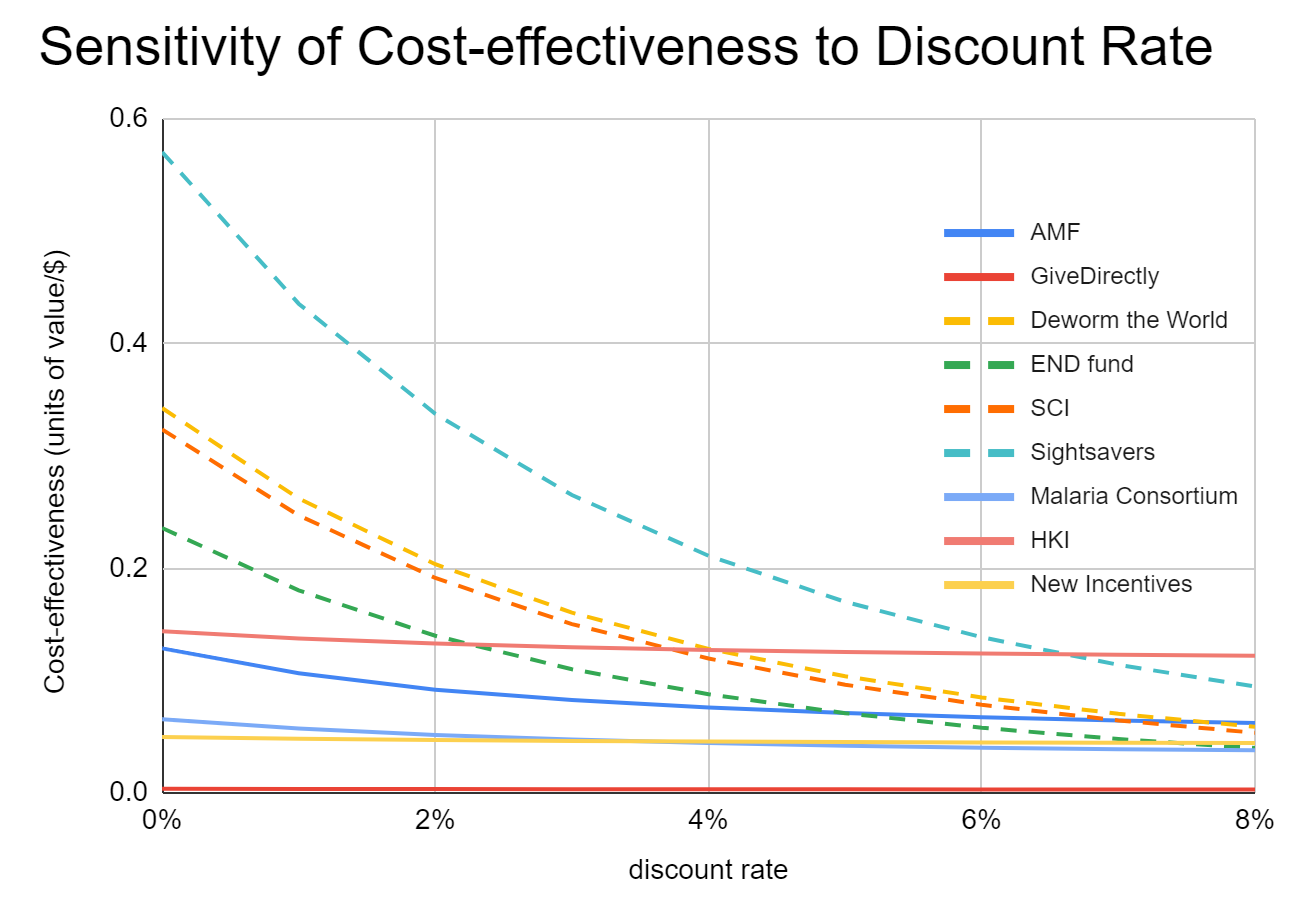
Deworming interventions, shown in dashed lines, vary considerably in the discount rate because their path to impact relies on multi-decadal earnings increases for the recipients. The other interventions are less sensitive to the discount rate because more of their impact comes via direct mortality reduction, which is not subject to a discount rate in GiveWell’s analysis. However, all CEAs include an analysis of long-term income changes, so display some sensitivity to the discount rate.
The GiveWell approach of making their best point estimate of a random variable and using it for subsequent calculations breaks down here because the cost-effectiveness is not linearly proportional to the discount rate. The precise function relating discount rate to cost-effectiveness for the deworming interventions is a bit complex.[5] We can just note that the cost-effectiveness is some function of, among other things, the discount rate :
We care about the expected value of the cost-effectiveness:
GiveWell makes the further implicit assumption that
But this assumption is false!
Because is nonlinear, our best guess for the discount rate being wrong in one direction will mean our estimate for cost-effectiveness will be off by more than if we are wrong about discount rates in the other direction. In this case, if the appropriate[6] discount rate is significantly lower than GiveWell’s current value of 4%, then deworming looks very good indeed, while if we choose a higher discount rate, deworming is only moderately worse.
This means that simply plugging in our best guess for the discount rate into the CEA is a mathematically invalid move that gives the wrong answer.[7] The correct approach would involve deciding on our probability distribution in credences over different discount rates, and integrating the product of f and the probability distribution. Others have argued GiveWell should do uncertainty analysis to keep better track of the risk their recommendations are badly off. My concern differs from this, as even if we just care about maximising expected value without being risk averse, we should avoid using point estimates of the discount rate.
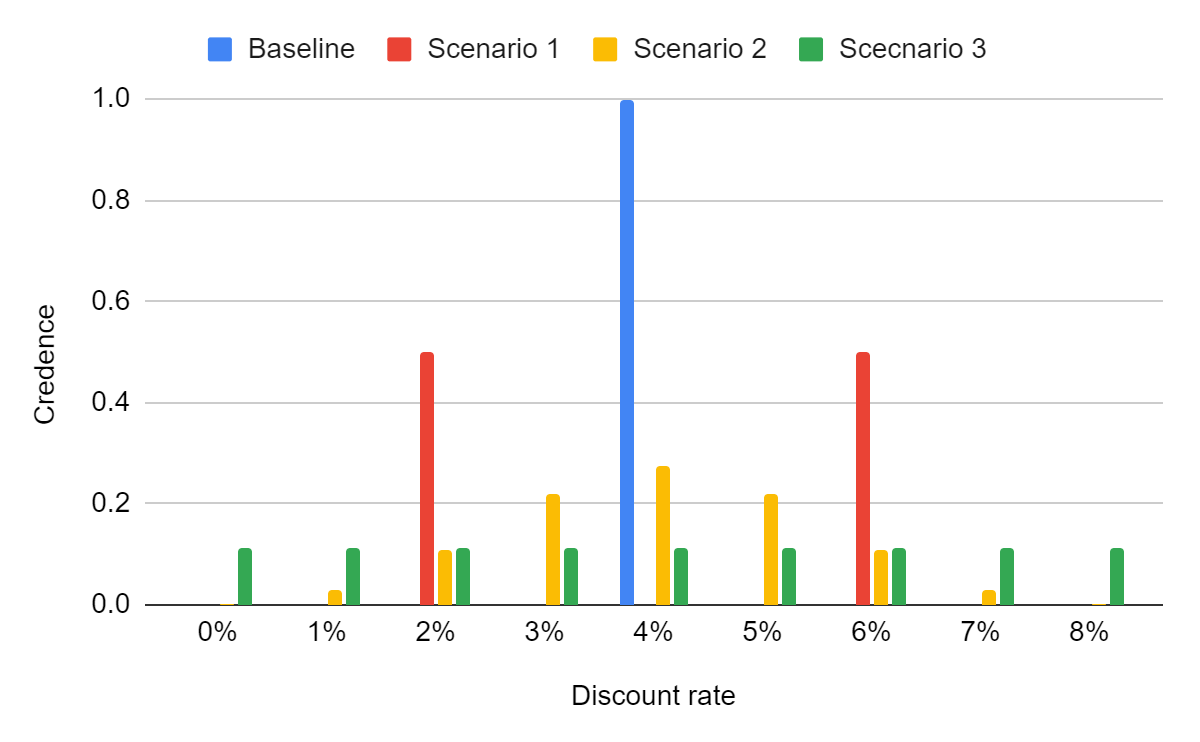
I make no claim to have a good way of choosing our probability distribution, just that the current implicit one - 100% confidence in 4% - is clearly wrong. For illustrative purposes, here are three slightly less wrong discrete distributions we could have over discount rates: equal credence between 2% and 6%, a binomial distribution, and uniform credence on 0%-8%.
The more credence we place on lower discount rates, the more deworming charities look better compared to the baseline methodology, even in relation to other charities:
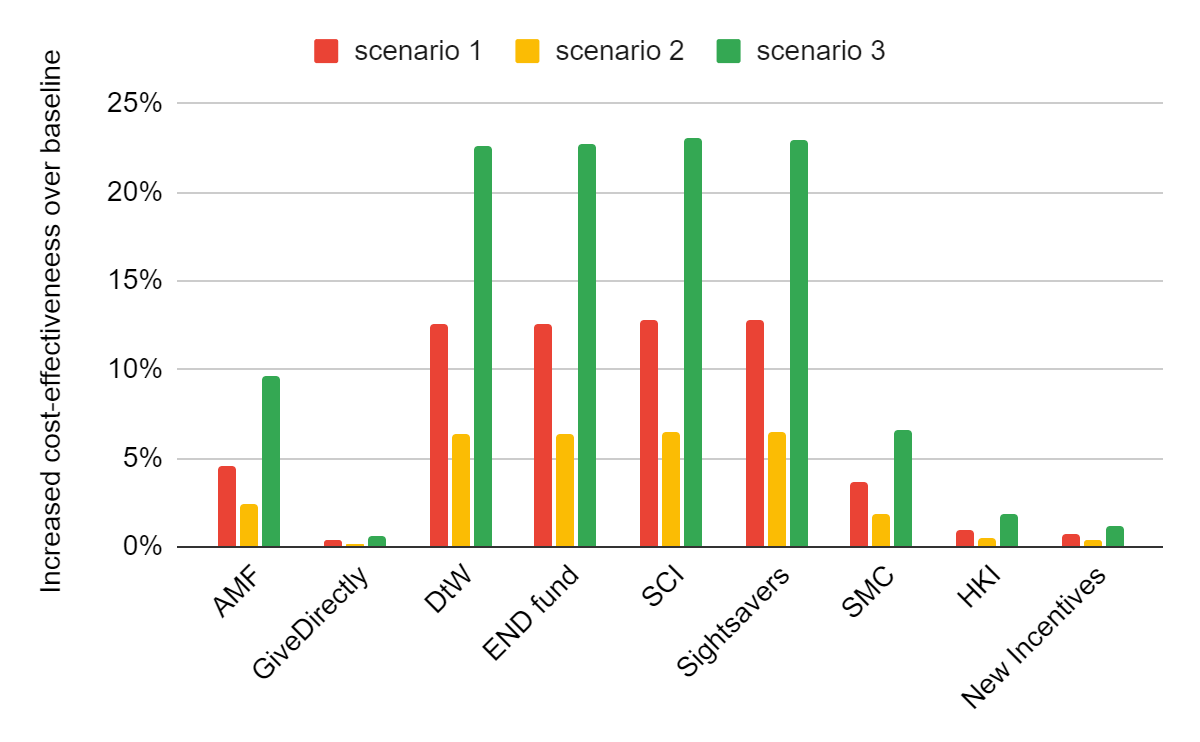
Thus, GiveWell improving their modelling of discount rates could increase the cost-effectiveness of deworming charities by upwards of 10%. The takeaway I am hoping for is in pointing towards a better process, rather than defending my new very dodgy numbers.
My accompanying post argues the large chance of TAI within the coming decades should cause GiveWell to use a higher discount rate.
I am compelled by the foundational critique of GiveWell’s approach that its CEAs ignore almost everything of value by leaving out longterm effects, such as via population size and economic growth (Greaves 2020). However, I feel I have nothing important and new to add on this matter, and moreover by my reading of the rules it is outside the scope of the competition. ↩︎
In the real model, many other adjustments are made, and developmental benefits are also included, which I ignore. In my notation, V corresponds to row 33, M to row 31, R to row 24 and C to row 19. ↩︎
For instance, imagine if the three random variables are the outcome of flipping a coin. Suppose I have 50% credence the coin is fair, and 25% credence each that the coin has heads on both sides or tails on both sides. Using the fallacious reasoning, we would calculate E[HHH] = E[H]*E[H]*E[H] = (½)^3 = ⅛. The correct reasoning, though, gives E[HHH] = E[HHH|fair]P[fair] + E[HHH|heads bias]P[heads bias] + E[HHH|tails bias]P[tails bias] = ⅛½+1¼+0¼ = 5/16 which is (significantly) greater than ⅛. ↩︎
I got this data manually, by making a copy of the CEA spreadsheet, and plugging in each discount rate value and then copying the cost-effectiveness of each charity. Where the charity has separate columns for different countries/regions, I always used the highest cost-effectiveness figure. I used the numbers from the “Units of value generated per philanthropic dollar spent, after accounting for all adjustments” row, or the row with the most similar name in that sheet, with the exception of AMF where I used the “Units of value generated per dollar spent” row as the other row is hard-coded numbers that do not update when I change the discount rate. The data I used, and all graphs, are in an accompanying spreadsheet ↩︎
Let the discount rate be d, and the ratio of value from one year to the next be r=1/(1+d) which is just how discount rates are defined, then the cost-effectiveness is proportional to r8*(1-r40)/(1-r) using simple geometric series maths, and GiveWell’s own values of the income benefits starting after 8 years and lasting for 40. ↩︎
I will refrain from saying true, given the subjective judgements involved. ↩︎
A similar complaint could be made about these parameters of 8 and 40 years, that a better model would treat these as variables with probability distributions, or better yet would not have the effect be binary, but rather continuously increasing over the first decade, and later gradually declining to zero. However, this is outside the scope of this article, but could be addressed in conceptually similar ways. ↩︎

Nice!
A thing that you might be missing is that GiveWell is only assigning limited manpower to its CEAs. This means that I think that they may not have noticed relatively subtle issues like this—clear when you notice them, but perhaps hard to notice unprompted.
Thanks. I suppose I was thinking that the CEAs are one of the core products GiveWell creates and a lot of effort has gone into them. But yes, once I have thought of something it probably seems more obvious than it is.
With limited manpower, GiveWell also has to prioritize which CEA improvements to make--and added complexity can moreover increase the risk of errors.