TLDR
- I analysed a set of 64 (non-randomly selected) binary forecasting questions that exist both on Metaculus and on Manifold Markets.
- The mean Brier score was 0.084 for Metaculus and 0.107 for Manifold. This difference was significant using a paired test. Metaculus was ahead of Manifold on 75% of the questions (48 out of 64).
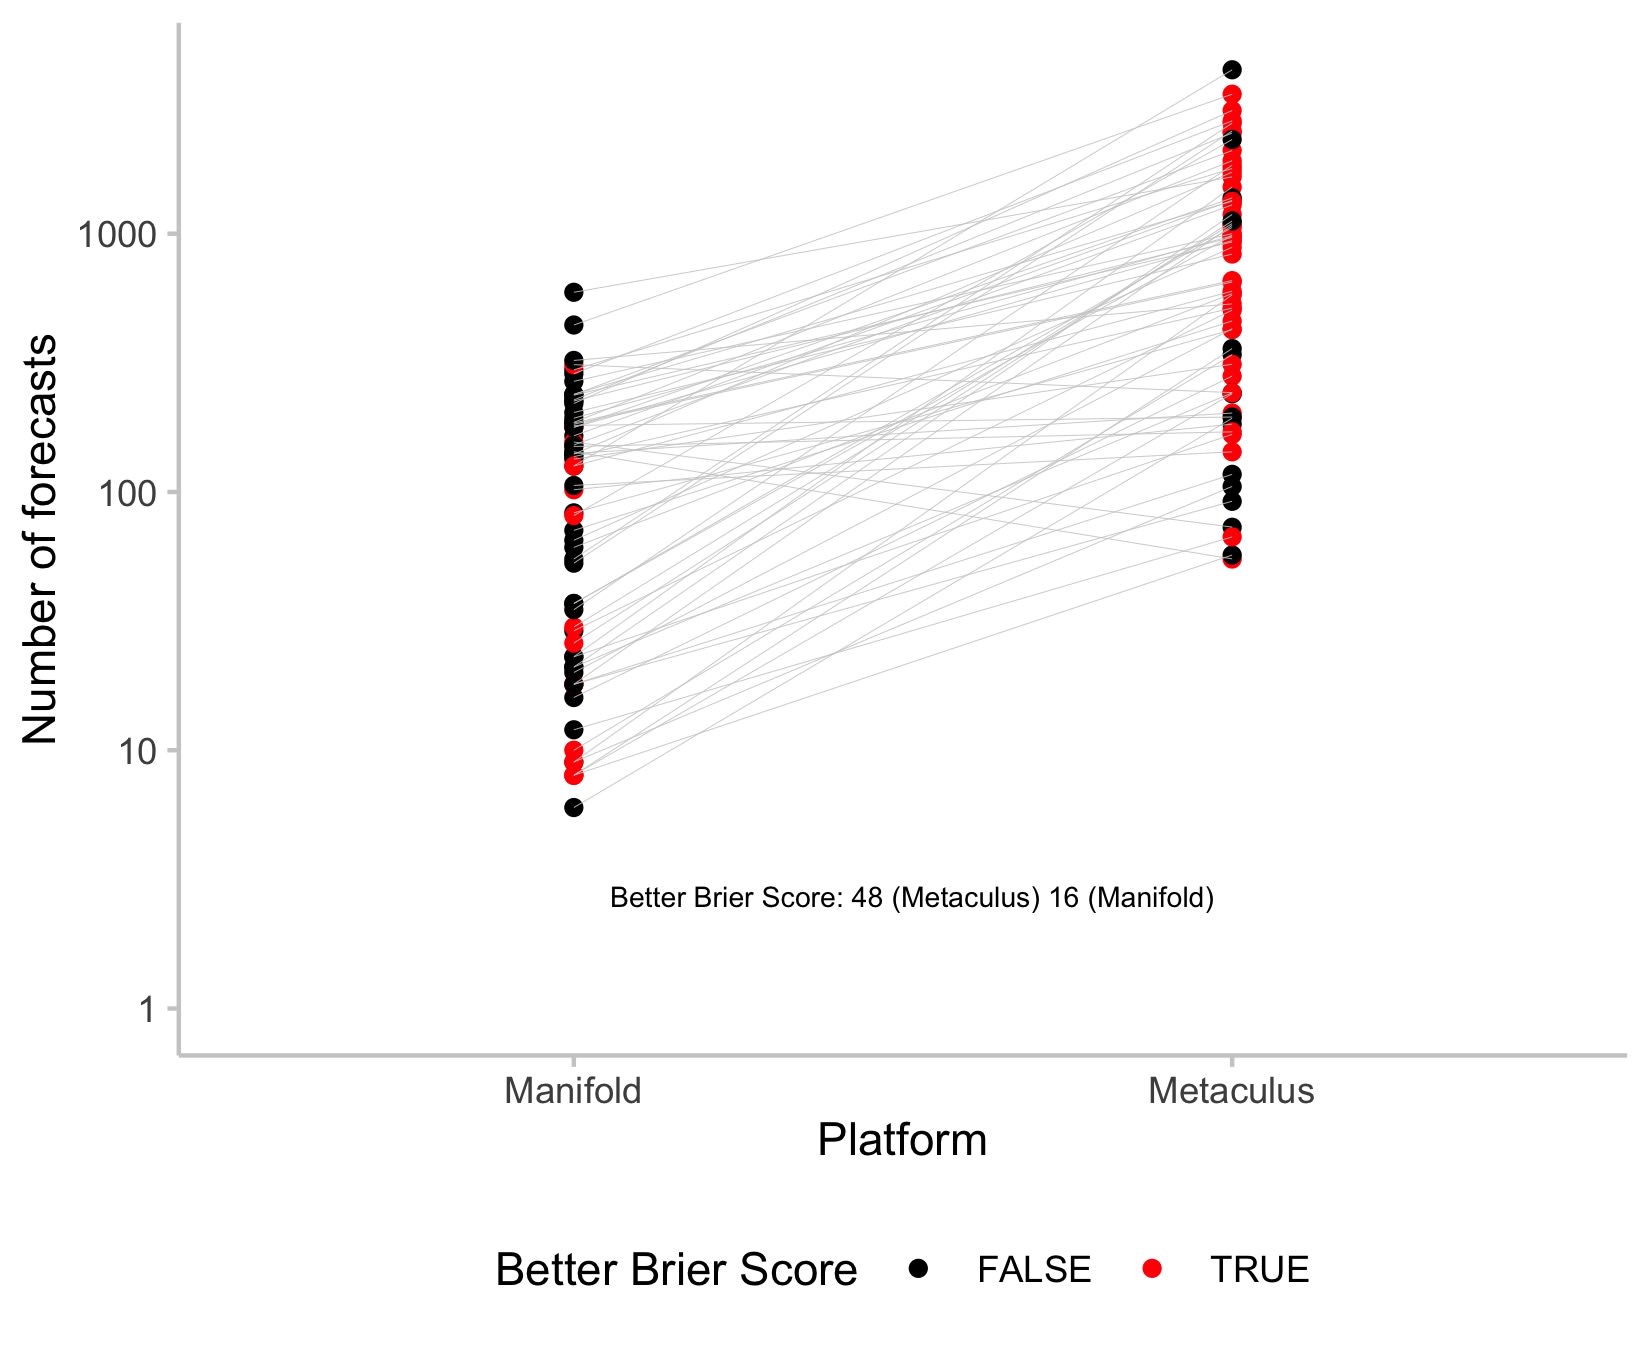
- Metaculus, on average had a much higher number of forecasters
- All code used for this analysis can be found here.
Conflict of interest note
I am an employee of Metaculus. I think this didn't influence my analysis, but then of course I'd think that and there may be things I haven't thought about.
Introduction
Everyone likes forecasts, especially if they are accurate (well, there may be some exceptions). As a forecast consumer the central question is: where should you go to get your best forecasts? If there are two competing forecasts that slightly disagree, which one should you trust most?
There are a multitude of websites that collect predictions from users and provide aggregate forecasts to the public. Unfortunately, comparing different platforms is difficult. Usually, questions are not completely identical across sites which makes it difficult and cumbersome to compare them fairly. Luckily, we have at least some data to compare two platforms, Metaculus and Manifold Markets. Some time ago, David Glidden created a bot on Manifold Markets, the MetaculusBot, which copied some of the questions on the prediction platform Metaculus to Manifold Markets.
Methods
- Manifold has a few markets that were copied from Metaculus through MetaculusBot. I downloaded these using the Manifold API and filtered for resolved binary questions. There are likely more corresponding questions/markets, but I've skipped these as I didn't find an easy way to match corresponding markets/questions automatically.
- I merged the Manifold markets with forecasts on corresponding Metaculus questions. I restricted the analysis to the same time frame to avoid issues caused by a question opening earlier or remaining open longer on one of the two platforms.
- I compared the Manifold forecasts with the community prediction on Metaculus and calculated a time-averaged Brier Score to score forecasts over time. That means, forecasts were evaluated using the following score: , with resolution and forecast at time . I also did the same for log scores, but will focus on Brier scores for simplicity.
- I tested for a statistically significant tendency towards higher / lower scores on one platform compared to the other using a paired Mann-Whitney U test. (A paired t-test and a bootstrap analysis yield the same result.)
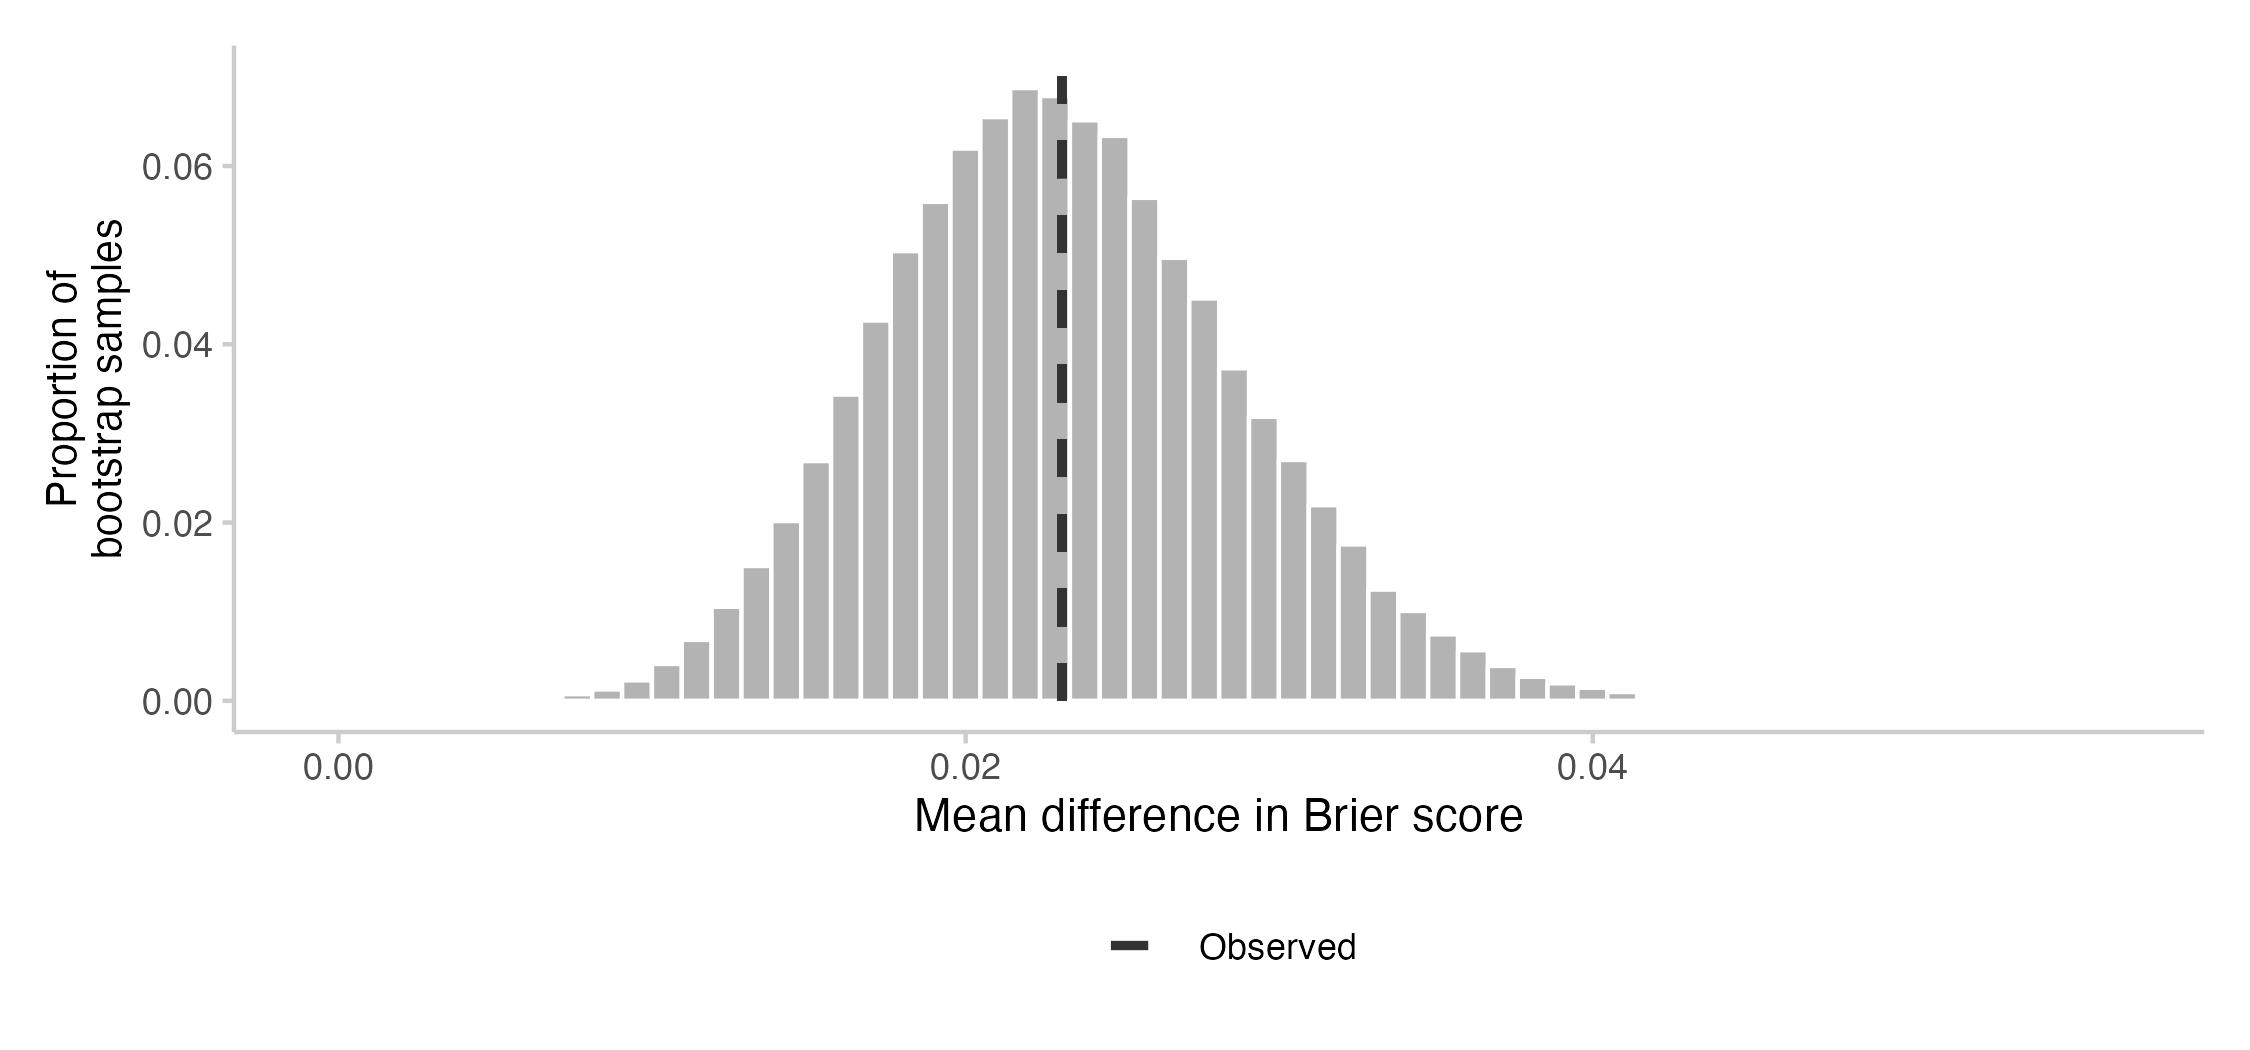
- I visualised results using a bootstrap analysis. For that, I iteratively (100k times) drew 64 samples with replacement from the existing questions and calculated a mean score for Manifold and Metaculus based on the bootstrapped questions, as well as a difference for the mean. The precise algorithm is:
- draw 64 questions with replacement from all questions
- compute an overall Brier score for Metaculus and one for Manifold
- take the difference between the two
- repeat 100k times
Results
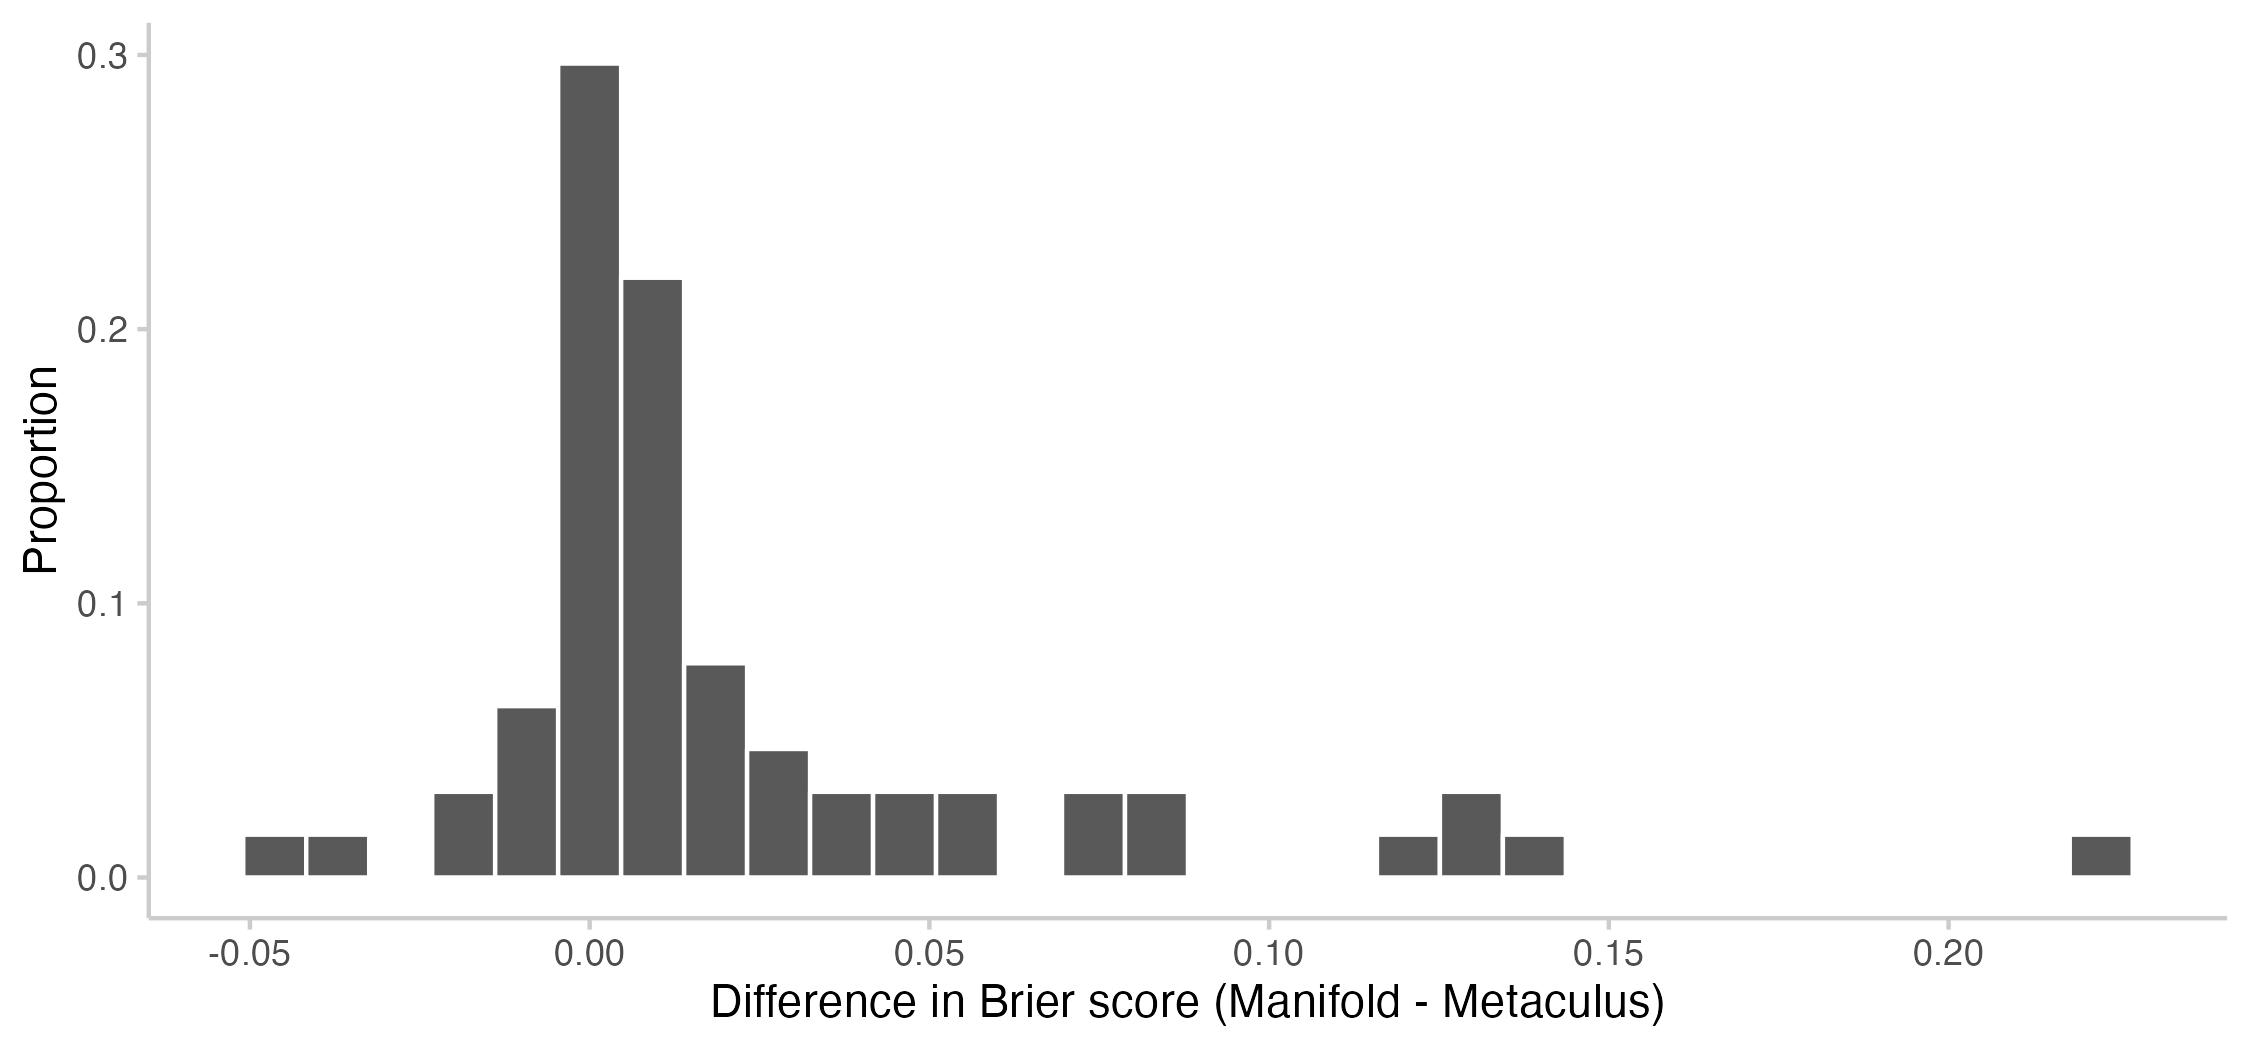
The time-averaged Brier score on the questions I analysed was 0.084 for Metaculus and 0.107 for Manifold. The difference in means was significantly different from zero using various tests (paired Mann-Whitney-U-test: p-value < 0.00001, paired t-test: p-value = 0.000132, bootstrap test: all 100k samples showed a mean difference > 0). Results for the log score look basically the same (log scores were 0.274 for Metaculus and 0.343 for Manifold, differences similarly significant).
Here is a plot with the observed differences in time-averaged Brier scores for every question:

Usually, it's not possible to make any meaningful statements about which of two forecasters is more accurate based on a single question. What we care about, therefore, is average or expected performance across many questions. To get a clearer picture of the average performance difference, I conducted a bootstrap analysis. This plot shows the bootstrapped distribution of the average difference between Manifold and Metaculus across sets of 64 questions:

Under lots of of strong assumptions, this plot would give us an answer to the question "If I look at a set of 64 random questions, available both on Metaculus and Manifold, what should I expect the average difference in Brier score on these 64 questions to be?" Of course, those assumptions don't hold entirely. The bootstrap analysis kind of assumes that questions are independent, which they are probably not. (Many of the questions are about the Ukraine conflict.) The interpretation I've given also assumes that the 64 questions are representative for all questions on Manifold/Metaculus, which they are also probably not.
As another interesting observation, Metaculus on average had a much higher number of forecasters on the markets I looked at than Manifold. (For a discussion on how that might affect accuracy see here and more recently here.) Here is a plot of the number of forecasts for each question (y-axis on the log scale, with red marks indicating when that platform has a better Brier Score).

I find this interesting, but also somewhat hard to identify any meaningful patterns. For example, one could expect red points to be clustered at the top for Manifold, indicating that more forecasts equal better performance. But we don't see that here. The comparison may be somewhat limited anyway: In the eyes of the Metaculus community prediction, all forecasts are created equal. On Manifold, however, users can invest different amounts of money. A single user can therefore in principle have an outsized influence on the overall market price if they are willing to spend enough. I'd be interested to see more on how accuracy on Manifold changes with the number of traders and overall trading volume. Who knows, maybe Manifold would be ahead if they had a similar number of forecasters to Metaculus?
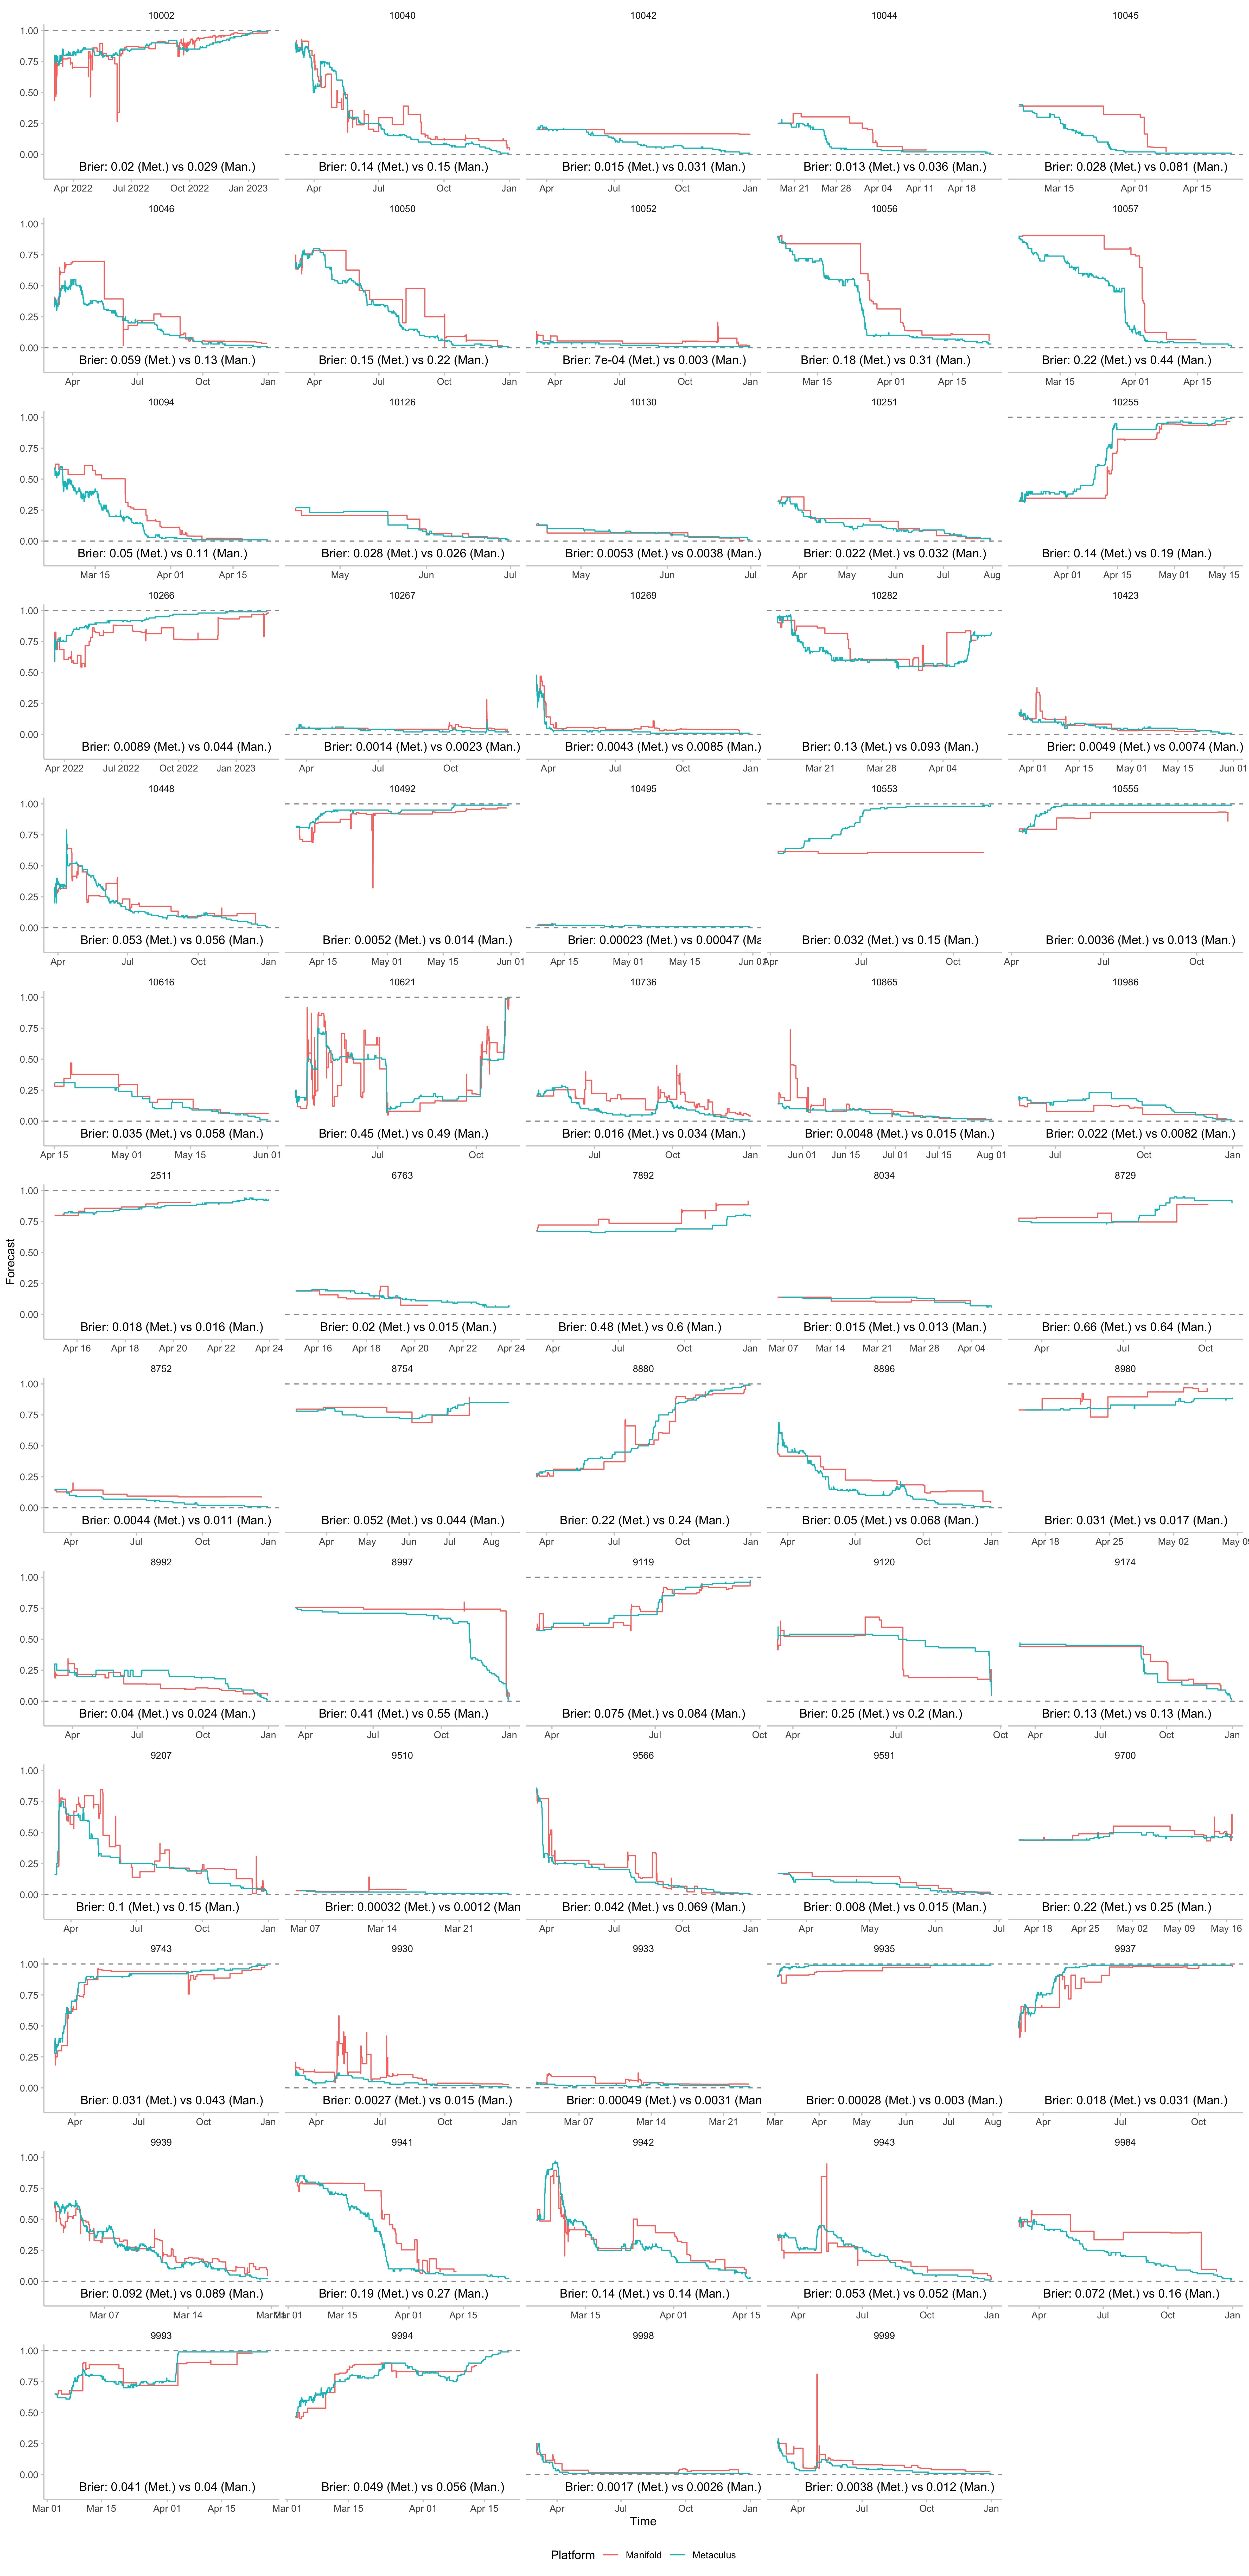
Let's have another look at the actual forecasts. Here is a gigantic plot that shows the corresponding Manifold and Metaculus community prediction (as well as time-averaged scores) for all questions that I looked at.

We can notice a few interesting things. The curves for Metaculus and Manifold usually look roughly similar. That's good. If independent people using different methods arrive at similar conclusions, that should give us more confidence that the overall conclusions are reasonable. Of course, it could just mean that one platform copies the other. But even that would be a good sign, as it means you couldn't trivially do better than just copying the other platform.
The curve for Manifold looks more spiky and less smooth. I expect this to be largely a function of the number of forecasters and the trading volume. To me, the spikes mostly look like noise. But large movements could also reflect a tendency for Manifold to update more quickly or strongly to new information. Sometimes markets on Manifold have gone stale, which seems to be less of an issue on Metaculus in this small data set.
Discussion
Statistical significance aside, the 64 forecasts I investigated feel more consistent and therefore slightly more informative on Metaculus from a pure forecast consumer perspective. However, terms and conditions, and of course a million limitations apply.
Firstly, the set of questions I looked at is very limited. Results might completely change if you look at different markets/questions. For simplicity, I only looked at markets created on Manifold by the MetaculusBot. I'm not entirely sure how the MetaculusBot picked questions to replicate, but to me it doesn't necessarily look like a random sample. Copying questions from Metaculus to Manifold (rather than the other way round) of course means that the questions are skewed towards the kind of questions that would appear on Metaculus and are of interest to the Metaculus community. If you want to (help) rerun the analysis with more questions, feel free to adapt my code or get in touch.
Secondly, this analysis doesn't necessarily provide any guidance for the future. Once you point out a potentially profitable trading strategy, it tends to quickly disappear. If I were an ambitious user on Manifold and had a free weekend to spend, I would sure as hell start coding up a bot that just trades the Metaculus community prediction on Manifold.
Thirdly, this analysis doesn't directly allow general statements about which platform provides more original value, even though it looks like on the set of questions I analysed Metaculus forecasts tended to update faster. It remains a challenge to disentangle how forecasts on both platforms may be influencing each other and how the existence of one platform affects the quality of forecasts on the other.
Thanks to Lawrence Phillips and Tom Liptay for providing valuable feedback to this post!

I slightly tend towards yes, but that's mere intuition. As someone on Twitter put it, "Metaculus has a more hardcore user base, because it's less fun" - I find it plausible that the Metaculus user base and the Manifold user base differs. But higher trading volume I think would have helped.
For this particular analysis I'm not sure correcting for the number of forecasters would really be possible in a sound way. It would be great to get the MetaculusBot more active again to collect more data.