I investigated this, and it doesn’t look like there is much evidence for herding among Metaculus users to any noticeable extent, or if there is herding, it doesn’t seem to increase as the number of predictors rises.
1. People REALLY like predicting multiples of 5
2. People still like predicting the median after accounting for this (eg looking at questions where the median isn't a multiple of 5)
(Another way to see how much forecasters love those multiples of 5)
If one had access to the individual predictions, one could also try to take 1000 random bootstrap samples of size 1 of all the predictions, then 1000 random bootstrap samples of size 2, and so on and measure how accuracy changes with larger random samples. This might also be possible with data from other prediction sites.
I discussed this with Charles. It's not possible to do exactly this with the API, but we can approximate this by looking at the final predictions just before close.
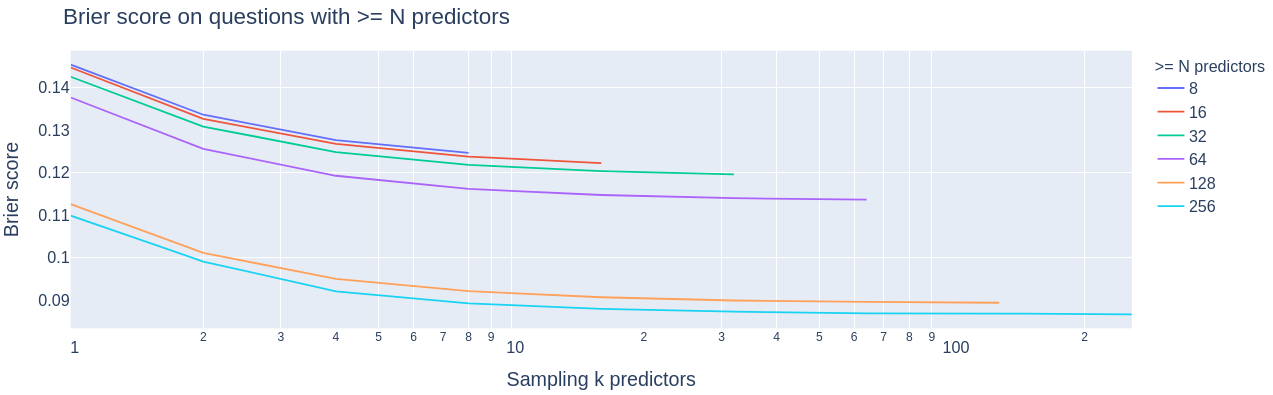
Brier score from bootstrapped predictors
We can see that:
Questions with more predictors have better brier scores (regardless of # of predictors sampled)
Performance increases with # of predictors up to ~100 predictors
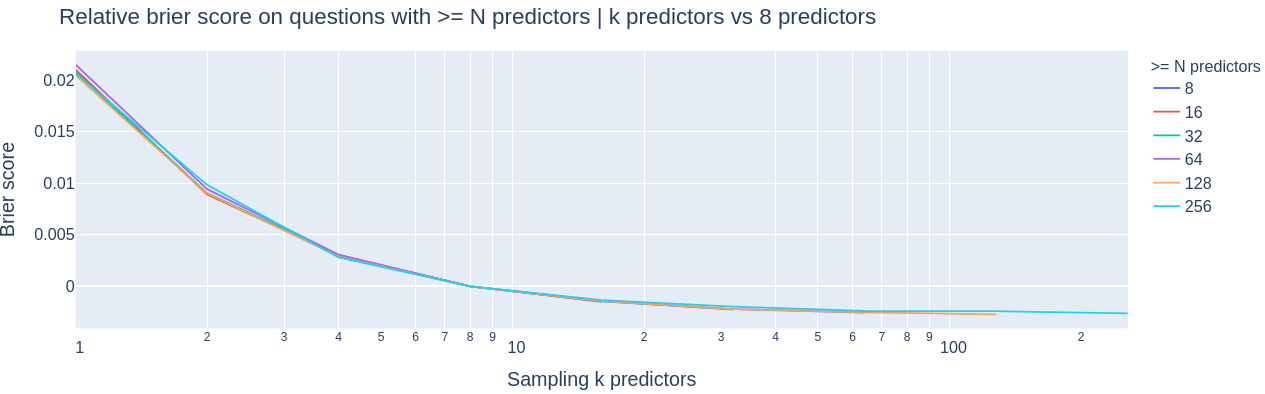
To account for the different brier scores based on groups of questions, I have normalized by subtracting off the performance of 8 predictors. This makes point 2 from above more clear to see.
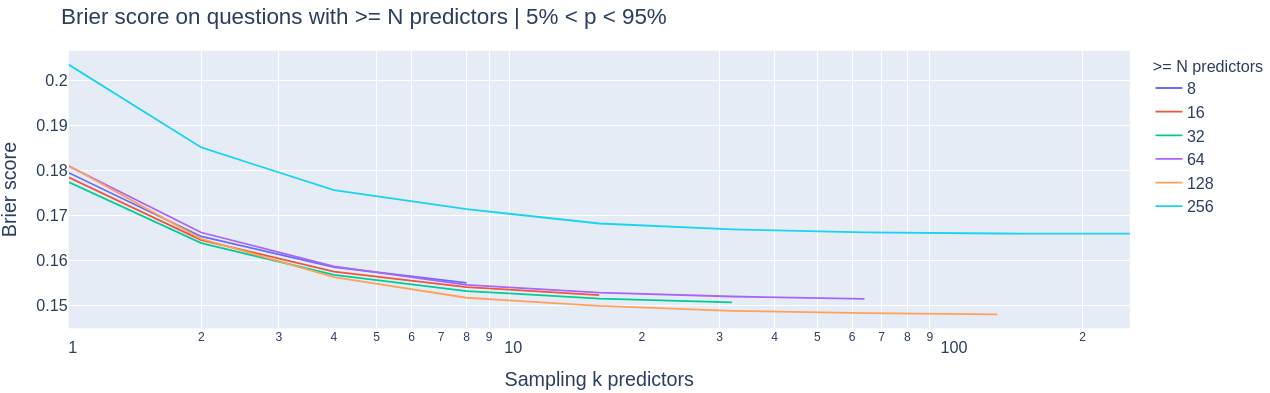
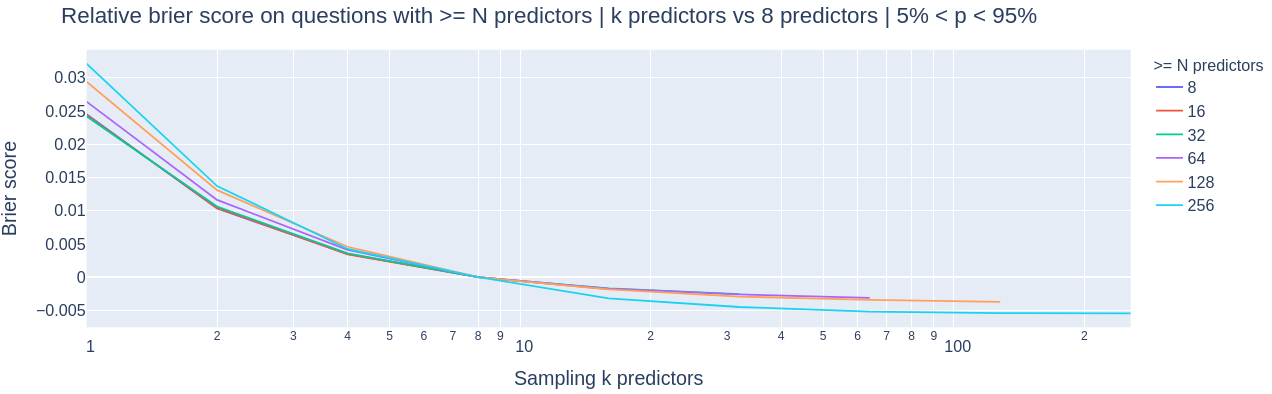
When discussing this with Charles he suggested that questions which are ~0 / 1 are more popular and therefore they look easier. Excluding them, those charts look as follows:
Amazingly this seems to be ~all of the effect making more popular questions "easier"!
(NB: there's only 22 questions with >= 256 predictors and 5% < p < 95% so the error bars on that cyan line should be quite wide)
Hi Simon, I'm working on a follow-up to this post that uses individual-level data. Could you please give some detail on how you "sampled" k predictors? As in, did you have access to individual data and could actually do the sampling? I'm not entirely sure what the x-axis in your plot means and what the difference betwenn ">N predictors" and "k predictors" is. Thank you!
In light of your post, I've adjusted towards somewhat more often writing continuous rather than binary questions, since I'm now a bit less worried about the fact that that might tend to reduce the number of unique predictors. Just wanted to check if you think that that's an appropriate takeaway from your post? (It's probably hard to say without knowing what I mean by the eminently vague term "somewhat", but maybe you'd have something useful to say anyway.)
A related question: I had previously been concerned about the possibility that the number of questions on Metaculus will rise faster than the number of active predictors rise, and I had thought I should see this like a tragedy of the commons situation and that I should be wary of "overgrazing" myself by too liberally creating questions. (E.g., maybe I should avoid posting the least-useful-seeming 25% of the question ideas that seem worth my time to create.) This post makes me think I should be moderately less concerned about that, e.g. should adjust a bit towards feeling fine about creating many questions and about other people doing so. Do you think that that's an appropriate takeaway?
Possibly, but I would not be confident in that. One plausible reason that questions with low numbers of predictors do surprisingly well is that the site's power users are the ones predicting on them, and they are generally pretty good predictors.
I would not be very concerned about asking too many questions though, until this is closer to being a problem than it currently is.
The evidence suggests Brier score improvement after reaching 10 predictors is slow, and in practice I think I will now have a very similar level of confidence in a prediction if it has 10 or 30 predictors, whereas before I might have more easily dismissed the former.
So do you think this means it'd be better if forecasters "spread themselves more evenly" across questions - like moving a bit in the direction of forecasting on questions that so far have fewer unique predictors (especially those that have <10), relative to those which have more unique predictors?
Do you think there's a good way for this to be encouraged/incentivised? Some ideas that come to mind:
Just highlight that that is a way for forecasters to more efficiently provide the public good of more accurate aggregate forecasts (holding other factors constant)
Though in practice questions with more predictors might tend to be more important and so a smaller accuracy boost there could be better than a larger accuracy boost elsewhere
Metaculus could make an "achievement" or show stats for how often people have forecasted on questions that have few unique predictors so far, maybe excluding questions people create themselves
But this might mostly incentivise jumping on questions really fast, rather than jumping on questions that would otherwise remain neglected
And it again runs into the issue that questions with more predictors might tend to be more important
I think one issue with the current system is it has the opposite incentives - you get more points for predicting on popular questions. I don't know that going all the way in the opposite direction makes sense but reducing this seems good to me.
Perhaps there's another clever mechanism they could implement, but I'd guess that's the lowest hanging fruit.
(Also just realised that I should flag that I was implicitly assuming the patterns you found are causal, not correlational, but we should remain uncertain about that. But it does seem fairly likely there's a fairly large causal component, so I still basically endorse the above comment.)
Coming back to this post, I'm thinking about what it means in terms of collaboration. Tetlock found that teams of superforecasters did better than people going at it alone. One process that could produce this kind of data is Metaculus being able to meaningfully coordinate 10 forecasters on one question (but not beyond that), whereas prediction markets right now kind of have people going at it alone.
Excellent! Would it be costly to also show the results in a log-scored format? I am not predicting they would be massively different from Brier. I just get really hung up about the way Brier only punishes e.g. 99.999% negligibly more than 97% (given the event didn't happen).
It would make the post longer and more confusing I think, and not obviously more useful. Metaculus only allows up to 99% predictions, with increments of 1%, and I already exclude predictions of 1-9% and 91-99% from much of the analysis for reasons given in the post, thus excluding the specific area where I agree log scores are meaningfully better.
How does forecast quantity impact forecast quality on Metaculus?
Many people, myself included, worry about how much we can trust aggregate forecasts (e.g., the Metaculus community median) that are based on the predictions of only a small number of individuals. This consideration also came up in my recent post analysing predictions of future grants by Open Philanthropy, where having few predictors left me unsure of how much we could really trust the aggregate predictions[1]. How justified is this worry? In other words, to what extent is the number of individual predictors on a question correlated with the accuracy of the aggregate forecast on that question?
And to what extent does increasing the number of predictors on a question itself cause the aggregate forecast on that question to be more accurate?
The first question is relevant to whether and how to use the number of predictors as a proxy for how much to trust an aggregate forecast. The second question is relevant to how much question writers and others should aim to increase the number of predictors on a question, such as by creating binary rather than continuous questions (since binary questions generally receive ~twice as many predictions as continuous ones [2]), highlighting how forecasts on the question will inform decisions and thus be impactful, or increasing how many people use Metaculus.
This post mostly attempts to answer the first correlational question, but also discusses the second causal question.
Key points
Accuracy of an aggregate prediction (as measured by Brier scores) improves as the number of predictors rises, with the marginal improvement of the aggregate forecast given an X% increase in number of predictors (for any X) looking larger when there are lower (single digit) numbers of predictors.
The evidence suggests Brier score improvement after reaching 10 predictors is slow, and in practice I think I will now have a very similar level of confidence in a prediction if it has 10 or 30 predictors, whereas before I might have more easily dismissed the former.
Criticisms have been raised of Metaculus in particular in the past that its points system incentivises lazy predictors to “herd” around the existing median to accumulate points without needing to spend much time forecasting. I investigated this, and it doesn’t look like there is much evidence for herding among Metaculus users to any noticeable extent, or if there is herding, it doesn’t seem to increase as the number of predictors rises. This supports the notion that adding more predictors should continue to improve forecast accuracy at least to some extent.
The data
In this post I will look at binary forecasts from Metaculus. I focus on binary forecasts rather than continuous as they are easier to score, and the incomplete historic log of continuous forecasts available through the Metaculus API does not allow for easy scoring of them.
Previously I found that Metaculus was poorly calibrated on resolved questions with a >1 year time horizon. Restricting our set to exclude those gives a more calibrated dataset to start with and avoids us having to control for this, so I have excluded predictions with a time horizon of greater than 1 year.
I have used the Metaculus “community median” prediction throughout. This gives more weight to recently updated predictions than to older ones. I used this as it is the prediction most will see in practice when looking at a Metaculus question.
I collected data from 626 resolved binary questions on Metaculus with a time horizon of less than 1 year. For each question, I restricted my analysis to the first 25% of the question lifetime (that is, ¼ of the way through the period [question open date, question resolution date]). This was to exclude situations where new information came to light affecting question outcomes (and possibly also leading more predictors to make predictions on the question), in an attempt to isolate just the effect of increasing the numbers of predictors.
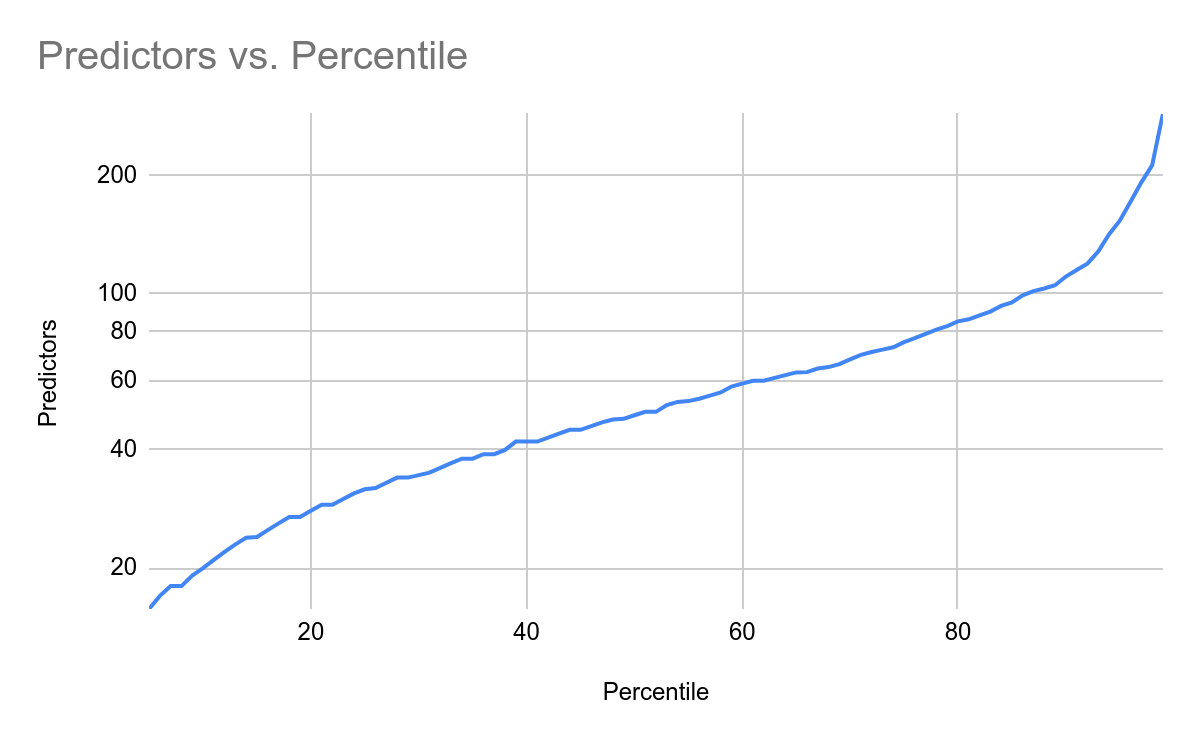
At this point the questions had the following distribution of unique predictors: (note log scale)
It looks to be approximately log-linear, though it blows up at the high end, with the top 5% of questions receiving much more attention. Looking at these, there are some common themes (several 2020 election season related questions, Covid related questions, AI milestone questions, and questions related to technological development) but the set is reasonably diverse. You can see what the most popular resolved questions were here - these are sorted by “interest” but this is very highly correlated with forecasts.
Analysis
Between-question analysis
I scored the predictions using Brier scores. TheBrier score is a scoring rule for probabilistic forecasts. For a set of binary forecasts, the Brier score is equivalent to the mean squared error of the forecasts, so a lower score is better. I took logs of the numbers of predictors, as it seemed a natural unit to use given the distribution of predictor counts and my strong prior that increasing your number of predictors by some fixed number matters more when you have fewer predictors to start with.
Taking Brier scores and plotting them vs log₂(predictors) we get the following.
So it looks like a linear fit shows a decreasing (improving) Brier score. We get a slope of -0.012 with a 95% confidence interval of [-0.026, 0.002]
Estimate
95% Confidence Interval
Intercept
0.2330
[0.154 , 0.312]
Slope
-0.0120
[-0.026 , 0.002]
What does a coefficient of -0.012 mean? It means that, for every doubling of our number of predictors, we get a 0.012 decrease in expected Brier score. For example, that would mean going from 2^3 to 2^7 (8 to 128) predictors can be expected to decrease the Brier score by .048 - or, to frame it in terms of prediction discrimination, the equivalent of going from a perfectly calibrated 73% prediction to a perfectly calibrated 82% prediction. To give some context, this approximately 25% decrease in Brier scores is similar to the 23% by which Tetlock claimed teams of superforecasters outperformed individual superforecasters [3].
And we indeed see approximately that pattern when looking at the raw numbers, grouping questions into bins by how many predictors they had:
Number of Predictors (inclusive)
avg Brier for the aggregate forecast on the question
Number of questions in this bin
2-7
0.1961
11
8-11
0.1956
14
12-15
0.1799
19
16-22
0.1981
64
23-31
0.1744
109
32-45
0.1697
173
46-63
0.1682
177
64-90
0.1717
144
91-127
0.1325
83
128-181
0.1497
31
I then decided to exclude questions for which the aggregate prediction was below 10% or above 90% when the question was ¼ of the way through its time horizon. This was in order to exclude questions with very confident predictions, since such questions might be less likely than other questions to see significant changes in the prediction, which would make it harder to detect any possible benefit of a question receiving additional predictors. When such questions are excluded, we see a somewhat larger, though noisy, effect:
Number of Predictors (inclusive)
avg Brier for the aggregate forecast on the question
Number of questions in this bin
2-7
0.2157
10
8-11
0.2375
10
12-15
0.1894
18
16-22
0.2044
62
23-31
0.1842
98
32-45
0.1777
127
46-63
0.1742
116
64-90
0.2255
60
91-127
0.1475
34
128-181
0.1515
18
It looks here like the clearest differences here are between the first two buckets (<12 predictors) and those after, and between the last two buckets (>90 predictors) and those before, though the data is noisy enough that this could potentially be an artefact.
Within-question analysis
We are vulnerable here to confounding effects - what if forecasts which garnered more predictions also tended to be easier or more difficult to forecast than those which garnered fewer? In such an eventuality, we would get a false picture of the difference between forecasts.
One way to potentially get around this is to look at how the Brier scores of aggregate forecasts on a given question changes as that question gains a larger number of individual predictors. I looked at every question which ended up with over 90 unique predictors and which had an aggregate forecast ¼ of the way through the question lifetime within the 10%-90% range, and took their Brier scores at the point where they had N unique predictors for various N. Unfortunately Metaculus only keeps a limited subset of historic prediction values, and so our sample size here was reduced to 30 and I had to drop the N=2 and N=4 fields as there were no values for many questions. I also threw out one question which clearly received a meaningful informational update during the period we are looking at, though this doesn’t mean I caught all such instances.
We see the following:
Predictions
Brier
8
0.1976
16
0.1779
32
0.1926
64
0.1801
90
0.1734
If instead we look at those predictions with from 32-90 predictions, we get the following (sample size: 163, here I could bring back the smaller values of N):
Predictions
Brier
2
0.2357
4
0.2323
8
0.1968
16
0.1932
32
0.1787
So it seems like the strongest effect is going from very few to 10+ predictors. But this data may exaggerate the effect of an increased number of predictors, for reasons including that in these cases the higher numbers of predictors occurred at later points in the question’s lifetime later than the lower numbers, and new information may have come to light in the interim for some questions. It doesn’t clearly contradict our earlier finding about predictions not improving a great deal after the first 11 predictors.
Why might this be? I can think of a couple of plausible reasons for why this might be the case:
Perhaps many predictions are relatively easy, and settling on a good enough answer is something which can be done with few predictors
Perhaps later Metaculus predictors are largely herding, and contribute little to the overall estimate accuracy
How might we test these hypotheses?
For one thing, we can look at how much the overall prediction changes over the time from the early predictions to the later ones. If the aggregate prediction remains fairly stable, that’s some evidence for both the ‘predictions are easy’ hypothesis and the herding hypothesis, whereas if it isn’t very stable that would be evidence against both hypotheses. We can also see if the interquartile range narrows over time from the early predictions to the narrow ones; if so, that is some evidence for the herding hypothesis (since if a bunch of near-median predictions are made, that should raise the 25th percentile prediction and lower the 75th percentile).
Looking more closely, it doesn’t seem like predictions are very stable, though they are slightly more stable with respect to log(predictors) as time goes on. The mean (median) prediction moves 11.61 (8) percentage points between the time the question has 2 predictors and the time it has 4, and this goes to 9.43 (6) percentage points as the question goes from 4 to 8 predictors, 7.22 (6) points from 8 to 16 predictors, and 7.42 (5) points from 16 to 32 predictors. There was no autocorrelation between the moves [4].
An example for illustration:
This question had a median of 50% at 2 predictors, then 40% at 4, 50% at 8, 55% at 16 predictors, and then a median of 65% at 32 predictors. It hit 16 predictors within a day of opening in Jan 2019, but didn’t hit 32 until 4 days later.
Interquartile ranges [5] also do not vary significantly at different points, suggesting there is not much obvious herding going on, or at least that the probability a marginal predictor will be herding is not a function of how many predictors have already predicted on the question.
Predictions
Mean IQR width
2
0.1863
4
0.2223
8
0.2108
16
0.2052
32
0.2087
I don’t think this analysis supported either of my hypotheses, and I think this should make us somewhat more confident that more predictors are expected to improve the aggregate forecasts, though to what degree probably depends on the difficulty of the question.
Further research ideas
One could attempt to study performance across continuous questions to see if these conclusions hold there too. Doing this would require more access to historic data on distributions for Metaculus’ questions than is currently possible with Metaculus’ public API.
If one had access to the individual predictions, one could also try to take 1000 random bootstrap samples of size 1 of all the predictions, then 1000 random bootstrap samples of size 2, and so on and measure how accuracy changes with larger random samples. This might also be possible with data from other prediction sites.
Other factors, such as comments on questions from people sharing their reasoning or information sources, could affect aggregate prediction accuracy on a question. One could look into this.
Footnotes
[1] But note that a question having received a low number of forecasts is only one of several reasons why one might not trust the aggregate prediction on that question.
[2] I looked at all the questions on Metaculus from 2019 and 2020, and the median number of unique predictors on a binary question was 75, vs 38 for a continuous one. The mean was 97 vs 46. There were 942 continuous questions over the time window and 727 binary questions. This does not control for the questions being different, for example, perhaps the average binary question is more interesting? Metaculus also has an “interest” feature, where people can upvote questions they find interesting. This allowed me to look at number of predictors per “interested” user. This was 5.52 for binary questions and 4.27 for continuous questions, a difference of 1.3x, suggesting that the difference of 2x is probably in large part down to the binary questions being more interesting, though what makes a question interesting here is up to individual users. [3] Tetlock, Superforecasting: The Art and Science of Prediction, 2015
[4] That is, the direction of an update did not predict the direction of the next update.
[5] The interquartile range (IQR) for a binary question is the range [X,Y] where ¼ of predictors gave a lower probability than X and ¼ of predictors gave a higher probability than Y on the question.
It was written by Charles Dillon, a volunteer for Rethink Priorities. Thanks to Michael Aird, David Rhys Bernard, Linch Zhang, and Peter Wildeford for comments and feedback on this post. If you like our work, please consider subscribing to our newsletter. You can see all our work to date here.
This post presents the executive summary from Giving What We Can’s impact evaluation for 2025. At the end of this post we share links to more information, including the full report and...
I used AI to fix transcription errors, rerrarange the ideas, and suggest tweaks to the title and some sentences.
Three of the most exciting projects to come out of EA in recent years are, in a vague sense, CEA spinouts:
* Kairos is directly a spinout of CEA and now handles most support for university AI safety groups. Basically everyone I've found who knows them is really excited about what they do
* NEST is an opinionated ideas-fi...


1. People REALLY like predicting multiples of 5
2. People still like predicting the median after accounting for this (eg looking at questions where the median isn't a multiple of 5)
(Another way to see how much forecasters love those multiples of 5)