How many of these findings are likely to be of practical (as opposed to statistical) significance? (I'm looking mostly at the 21-30 group and to a lesser extent at the 31-40 group given EA demographics and the relatedly low number of 40+ respondents.)
It's been a long time since I was a graduate student, but it looks like most of the differences are +/- 0.25 points on a seven-point scale even before we consider the error bars. In other words, it seems that the differences we can be statistically confident in are significantly less than .25 in almost all cases. Is a difference of .1 or .25 on a seven-point scale likely to be substantively meaningful?
Likewise, most of the correlations between traits and donation were .03 or less and not statistically significant. But then again, I vaguely recall that correlations can be fairly low and still meaningful when one of the variables is binary?
The exception looks to be lower rates of male neuroticism, which seems more likely to be of practical significance.
To add some specifics to my earlier comment, if we look at the confidence intervals for the effect sizes in terms of cohen's d (visualizer), we see that:
The effect size for conscientiousness for men age 21-30, was 0.182 (0.0979 to 0.266). So between an almost 0 effect size and a smallish one.
The confidence intervals for effect size for neuroticism for men aged 21-30 was 0.388 (0.255 to 0.421). So a small to medium effect size.
The confidence intervals for effect size for neuroticism for men aged 31-40 was 0.366 (0.231 to 0.500). So between a small and medium effect size.
Interpreting effect sizes is, of course, not straightforward. The conventional standards are somewhat arbitrary, and it's quite widely agreed that the classic cohen's d benchmarks for small/medium/large effect sizes are quite conservative (the average effect size in psychology is no more than d=0.3). This empirically generated set of benchmarks (if you convert r into d), would suggest that around 0.2 is small and 0.4 is medium. But whether a particular effect size is practically meaningful varies depending on the context. For example, a small effect may make very little difference at the individual level, but make large differences at the aggregate level / in the long-run.
In my personal view, very few or none, if you are looking at the association between personality and outcomes. As we note the associations between personality, donation behavior and cause prioritization were "only small". I think that in itself is an important finding, since some people would expect large influences on things like donation or cause prioritisation.
If you're talking about the differences in personality between EAs and the general population, I think these are potentially more practically significant (for example, if you're considering things like influences on outreach / recruitment, or the influence of these differences on the kinds of people EA attracts). Here even small differences could be significant in a non-linear way (for example, if EA is disproportionately appealing to people who are very high in need for cognition, or similar traits, this could have a big effect). Some of these apparent differences between EA and the general population are not obviously small, though the level of confidence we can have for the analyses where we can benchmark to population levels at both the gender and age level (i.e. big 5) do not give us clarity about what the exact magnitude of the differences are. Even with 1600 respondents, the sample size is not so large when you are accounting for age and gender in this way (and we argue that you do need to do this in this case for the results to be interpretable).
I had never thought about it, but I can see some features of the intellectual and practical ecosystem that would select against people with higher neuroticism (at least to the extent it manifested as anxiety and certain other dimensions):
People who are higher in neuroticism might find EA's attitude toward risk tolerance challenging to accept.
The prevalence of grant-based funding is difficult for many people more temperamentally prone to anxiety to tolerate.
More generally, effectiveness orientation is more anxiety-inducing than a belief in Lake Wobegon charity where all efforts are above average.
So I wonder if the [edit: people who predicted high neuroticism] are conflating EA's pressures can cause neurotic symptoms with EA attracts relatively more people with neurotic temperaments. My rough (and extreme) analogy might be air-traffic controllers; the work seems very likely to cause anxiety and some other negative emotional states. At the same time, people who are higher in neuroticism may be more likely to choose another career (or be screened out by psychological testing).
Unfortunately, to test these hypotheses, one would probably need to sample an appropriate non-EA population and correlate certain attitudes toward generalized openness to the EA way of thought.
I wonder if the predictors are conflating EA's pressures can cause neurotic symptoms with EA attracts relatively more people with neurotic temperaments.
My default assumption would be that we're measuring trait-neuroticism rather than just temporary, locally caused anxiety. That's partly because personality traits are relatively stable, but also because I'd be surprised if EA were having a large effect on people's tendency to describe themselves as being "anxious, easily upset" etc. (and that doesn't seem to be the case in our results on the effect of EA on mental health). Of course, it's also worth noting that our results in this study tended towards lower neuroticism for EAs.
I do think that whether the results are driven more by EA selecting for people who are higher in emotional stability at the outset, or whether the community is losing people with higher trait-neuroticism, is a significant question however. I agree that we couldn't empirically tackle this without further data, such as by measuring personality across years and tracking dropout.
Sorry, by predictors I had meant "people who had predicted you would find higher levels of neuroticism," not your survey questions. Edited my comment to clarify.
Thanks for making this, Willem and David! Really interesting. After seeing the IRI statements and then the mean scores, it didn't initially look low to me, but when compared to the average IRI scores across the years, that's certainly a difference! It made me a little sad actually. I wonder what it might look like at present. There's a part of me that feels it can look similar still, despite the changes in the EA community. Also, while it might be relatively low-priority I for one would personally be fascinated/excited to see this being done again!
Nice! Have personality questions been included in subsequent EA surveys? I am guessing not, given you only report the 2018 data. Why is there a ~6-year lag in reporting these results? I assume there are good reasons, just seems a bit strange at first glance.
Have personality questions been included in subsequent EA surveys? I am guessing not, given you only report the 2018 data.
That's right. We haven't included them in later EA Surveys due to space constraints and the fact that these seem relatively low priority. People seem very interested in them and have often contacted us about whether we have any personality data (presumably, in part, because they are of academic interest). But they don't seem particularly decision-relevant compared to other questions they're competing with.
Why is there a ~6-year lag in reporting these results?
Same reason as above for why we didn't originally write a post about these results: these results seemed relatively low priority compared to other results and other project. For context, these questions were originally included in the optional 'Extra Credit' section of the survey, which previously used to include more 'fun' questions people requested or questions of interest to academics, but in recent years tends to just include slightly lower priority requests from core EA orgs that we can't fit in the main section of the survey.
As to why we are publishing the results now: as we saw more posts coming out based on people gathering new data, we thought there was more value in making our own results available to help inform people, and one of our staff had a small amount of spare capacity while waiting on other projects with fixed timelines. As we discussed, we'll also try to get our EAs per capita data out there in the near future, but we always have multiple possible projects which are competing with each other.
AE Studio recently reported the results of a survey of 250 EAs. Their survey also included a Big Five personality measure, enabling a comparison between their results and ours. Compared to AE Studio’s survey, we found lower levels of agreeableness, extraversion, and neuroticism among EAs.[4] However, as noted above, it is important to note that these differences could simply reflect differences in the composition of our respective samples or our use of different measures of the Big Five.
Just to elaborate on the 'differences in the composition of our respective samples,' there are (at least) two key distinctions that are worth highlighting:
Our data was collected six years apart (ours was collected earlier this year). It seems quite possible that changes in the make-up of the community over this period is at least partially driving the different measurements.
The EA community sample you report here is significantly larger than the one we collected (~1500 vs ~250), and the criteria for being included in either sample was also presumably distinct (eg, we only included participants who spend ≥5 hours/week actively working on an EA cause area).
Thanks for the comment! Your post was a key impetus for us prioritising publishing these results.
I agree that there could have been a change in the (average) personality of the EA community since 2018. My guess is that this is not the case. We know the demographic composition of the community has barely changed since 2018 in terms of gender or age. Of course, it's possible that there have been unrelated changes specifically in terms of EAs becoming more extraverted, for example, but it's not clear why that would be the case.
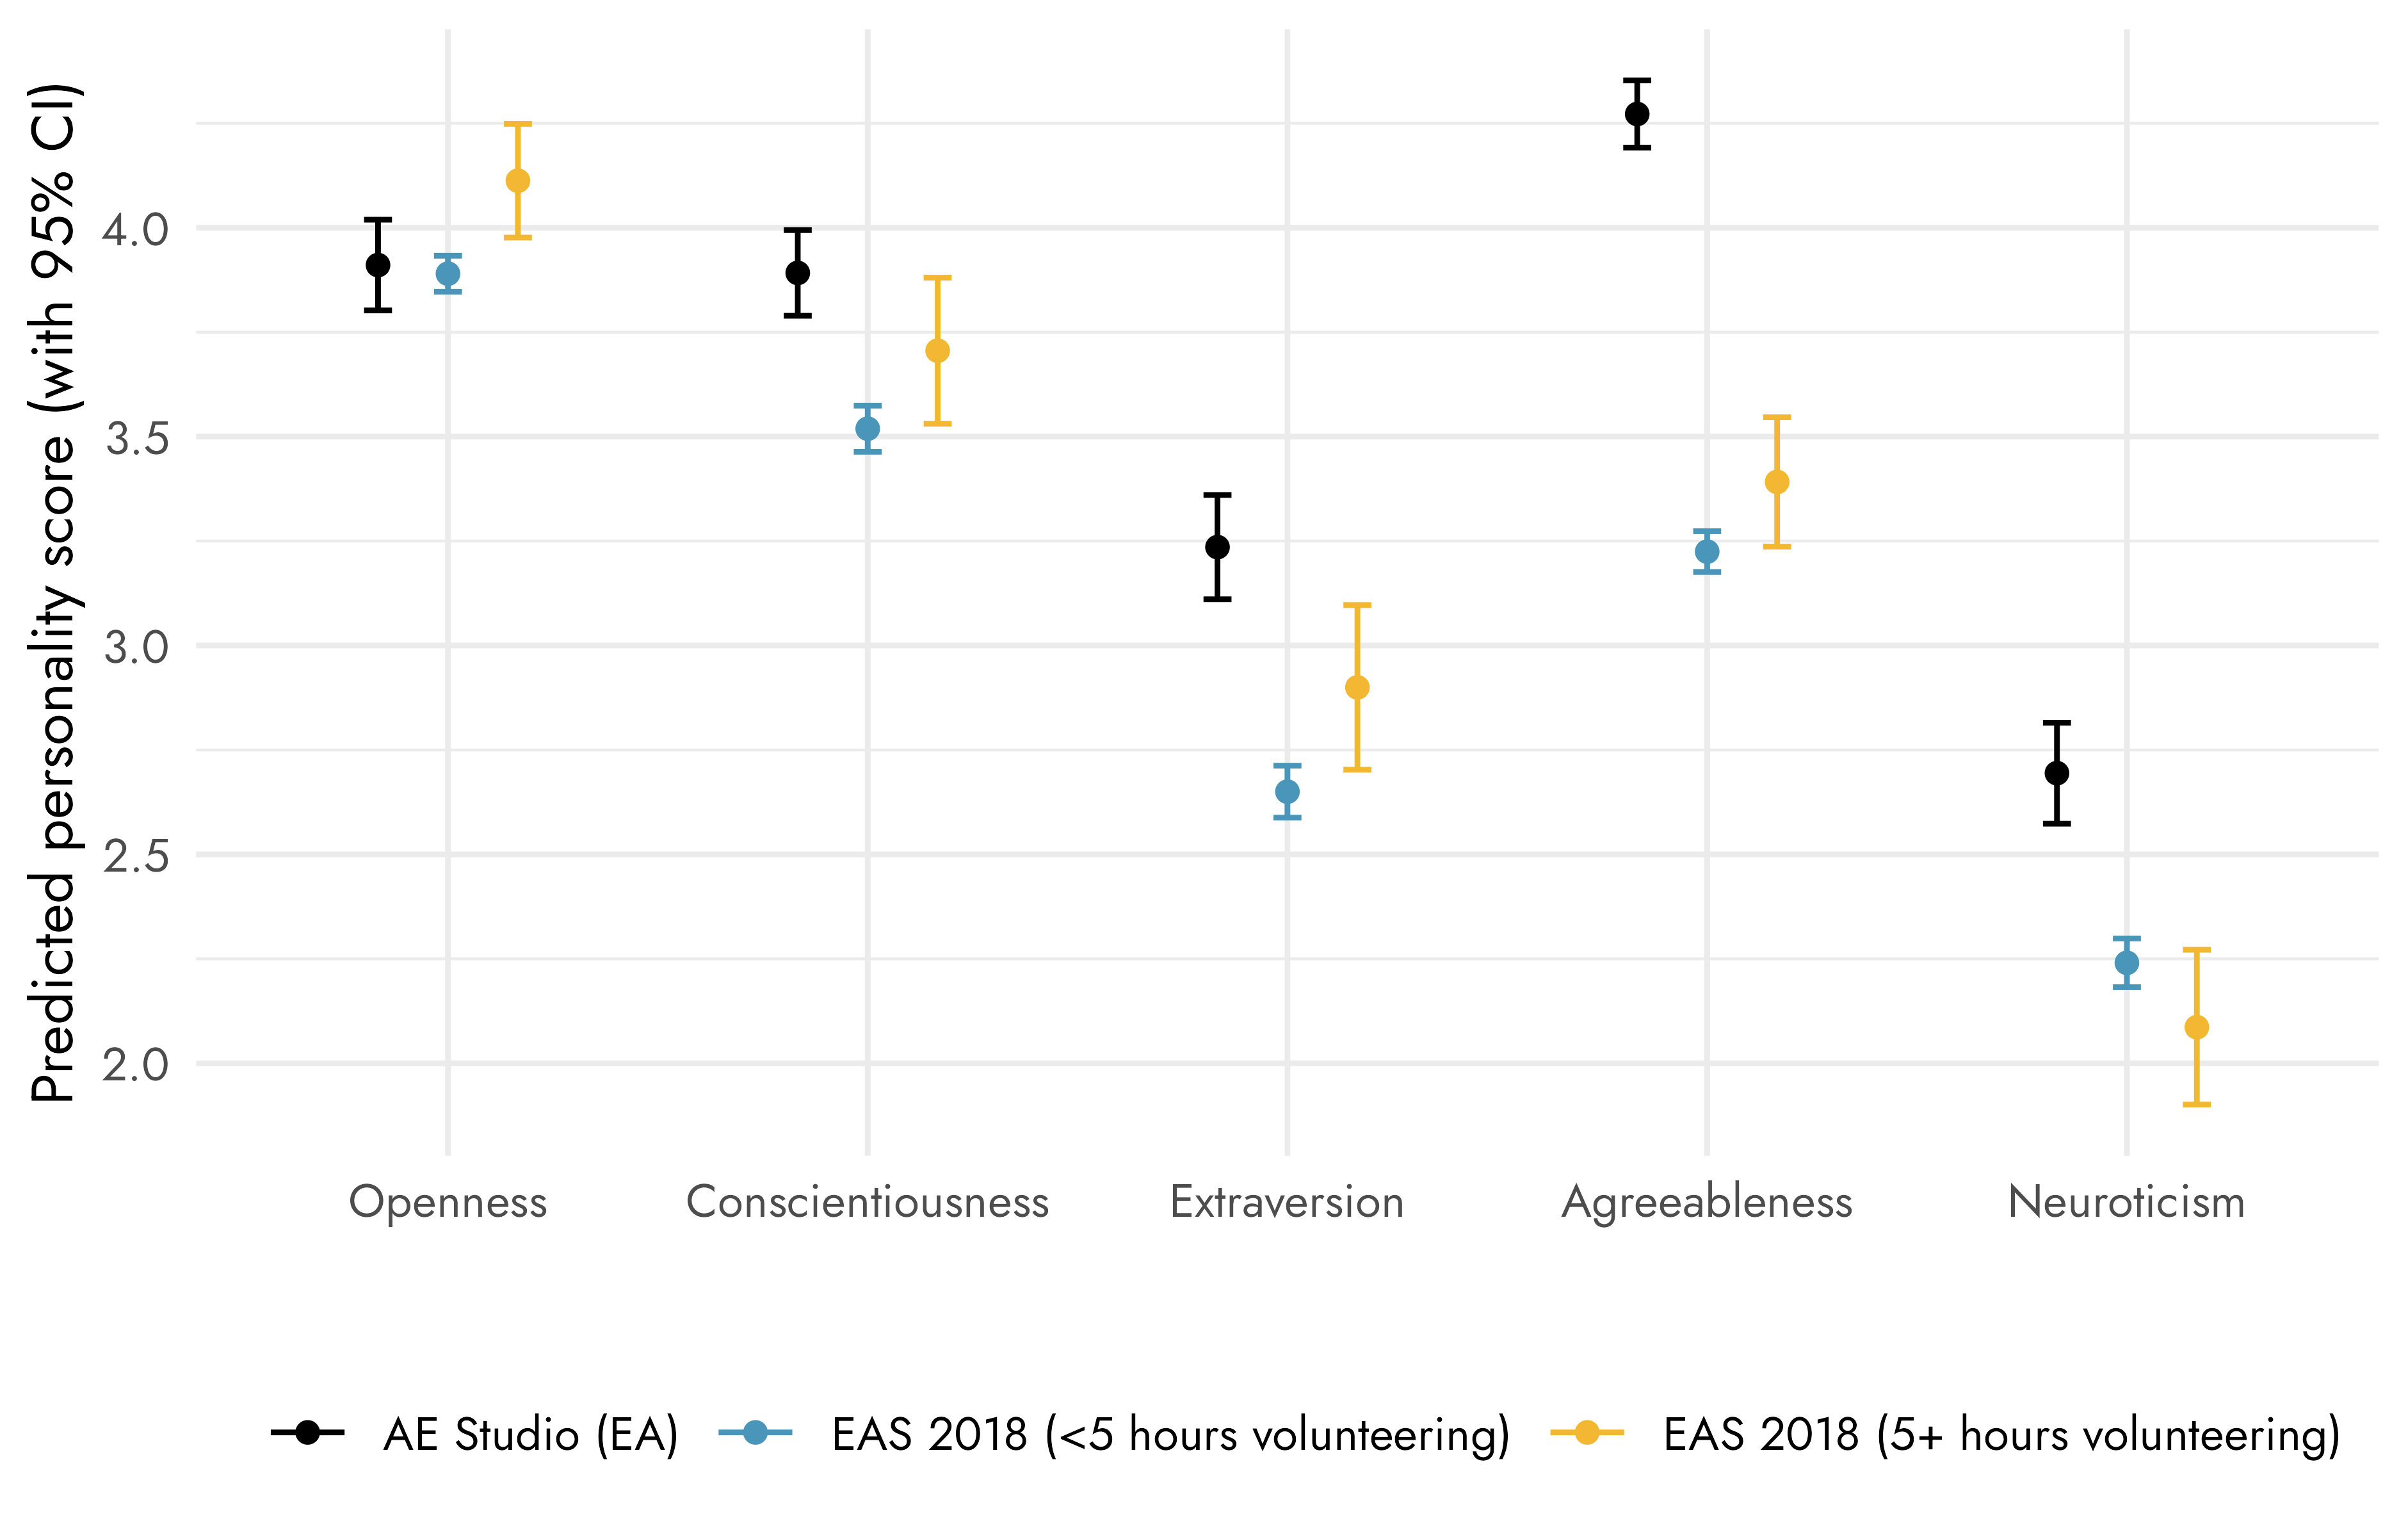
[Edited to clarify: I think differences in composition of the samples more along the lines of the secone bullet point can explain more of this, though I don't think it's simply due to lower/higher engagement] We can explore this by looking at different subgroups with different levels of engagement within the EA Survey.
First, we look at people actively volunteering >5 hours a week (which also gives us a sample size of around 250). The error bars are quite large for the smaller sample sizes, and there's not a consistent pattern. EAS 2018 >5hrs people are higher than both our samples on openness, appear somewhere in the middle for conscientiousness (but the larger error bars are overlapping with both other estimates, similar for extraversion, slightly higher for agreeableness but closer to and overlapping with the many EAS sample, and lower than both our samples (though overlapping with our estimate) for neuroticism. That said, I don't put so much stock in this sub-group. The sample size of 250 is quite small for the purpose. And working >5hrs a week on EA things seems like a hard to interpret/heterogeneous group (probably a mix of people who have a lot of time on their hands + more hardcore professional EAs). Self-reported time on EA also seems potentially vulnerable to social desirability bias (certain people over-state their time spent and report more positive traits). I do note that the >5hr people in both samples do seem to tend to report more "positive" personality, which is of course equally compatible with the explanation that people who spend more time on EA have better personalities or that results for these groups are affected by social desirability.
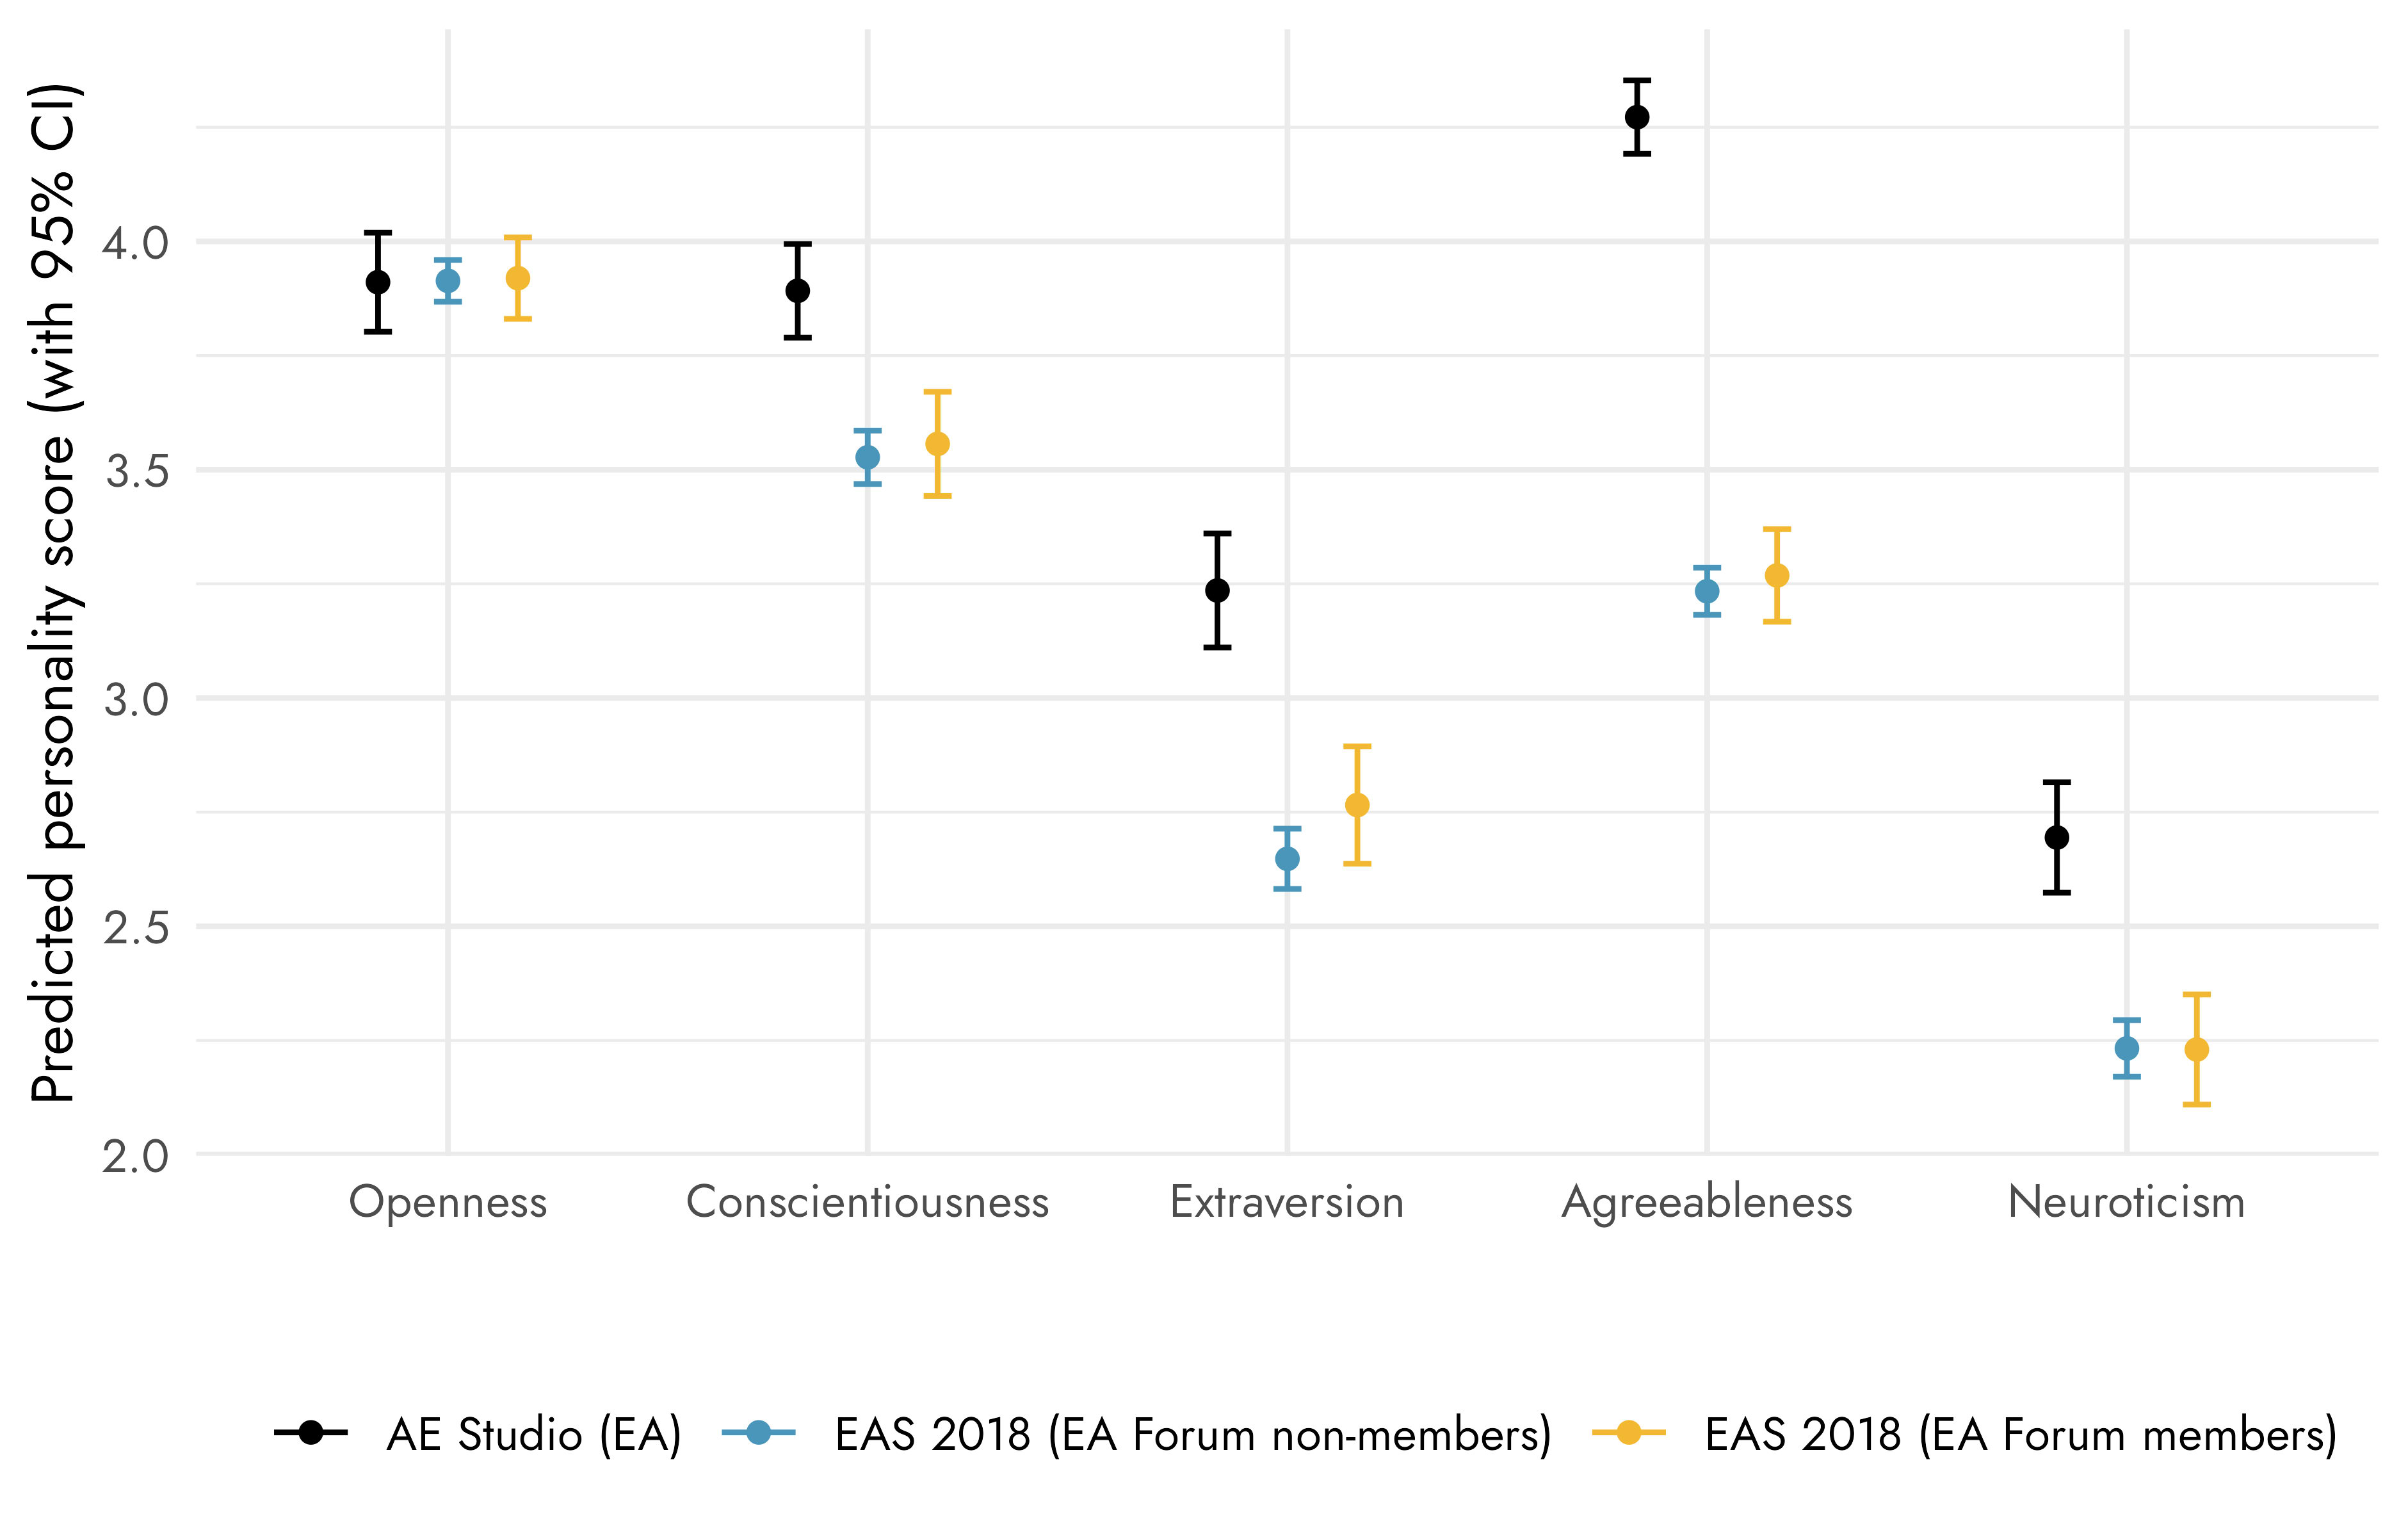
As a proxy for high engagement, I personally prefer EA Forum membership (back in 2018 the Forum was a much more niche affair, before its expansion, and EA Forum membership correlates highly with other measures of engagement). There we have a larger sample and see limited differences.
Thanks for this, David. I think the greater than/less than 5 hours volunteering is as close as we'll get to an apples-to-apples comparison between the two samples, though I take your point that this subset of the sample might be fairly heterogeneous.
One speculation I wanted to share here regarding the significant agreeableness difference (the obvious outlier) is that our test bank did not include any reverse-scored agreeableness items like 'critical; quarrelsome', which is what seems to be mainly driving the difference here.
I wonder to what degree in an EA context, the 'critical; quarrelsome' item in particular might have tapped more into openness than agreeableness for some—ie, in such an ideas-forward space, I wonder if this question was read as something more like 'critical thinking; not afraid to question ideas' rather than what might have been read in more lay circles as something more like 'contrarian, argumentative.' This is pure speculation, but in general, I think teasing apart EAs' trade-off between their compassionate attitudes and their willingness to disagree intellectually would make for an interesting follow-up.
One speculation I wanted to share here regarding the significant agreeableness difference (the obvious outlier) is that our test bank did not include any reverse-scored agreeableness items like 'critical; quarrelsome', which is what seems to be mainly driving the difference here.
Yeh, I agree! And I think that the pattern at the item level is pretty interesting. Namely, EAs are reasonably 'sympathetic, warm', but a significant number are 'critical, quarrelsome'. As I noted in the post, I think this matches common impressions of EAs (genuinely altruistic, but happy to bluntly disagree).
I wonder to what degree in an EA context, the 'critical; quarrelsome' item in particular might have tapped more into openness than agreeableness for some—ie, in such an ideas-forward space, I wonder if this question was read as something more like 'critical thinking; not afraid to question ideas' rather than what might have been read in more lay circles as something more like 'contrarian, argumentative.'
It's an interesting theory! Fwiw, I checked the item-level correlations and the correlations between the reverse-coded agreeableness item and the two openness items were both -0.001.
This is pure speculation, but in general, I think teasing apart EAs' trade-off between their compassionate attitudes and their willingness to disagree intellectually would make for an interesting follow-up.
Agreed. My own speculation would be that EAs tend to place a high value on truth (in large part due to thinking it's instrumentally necessary to do the most good). It also seems plausible to me that EA selects for people who are more willing to be disagreeable, in this sense, since it implies being willing to somewhat disagreeably say 'some causes are much more impactful than others, and we should prioritise those based on deliberation, rather than support more popular/emotionally appealing causes'.
This is a crosspost from the new Animal Welfare Alignment Newsletter by Anima International. You can subscribe on Substack if you are interested in following these efforts. Audio reading also available on Substack.
The goals of this post are to:
1. Raise a question I see as crucially important to the goal of aligning AI to animal welfare...
Hello! I'm Justin Portela. I got hired by GWWC to make YouTube videos after AI in Context did such a kickass job.
My channel is using that same cinematic, high-production value beauty to talk about everything in the EA universe that isn't AI.
...
This is a linkpost for Request for Proposals: Research and Applied Work on Digital Minds.
I'm glad to announce a request for proposals for research and applied work on digital minds at Longview Ph...
Generally, the lack of population norms of various personality traits makes comparisons between samples difficult.
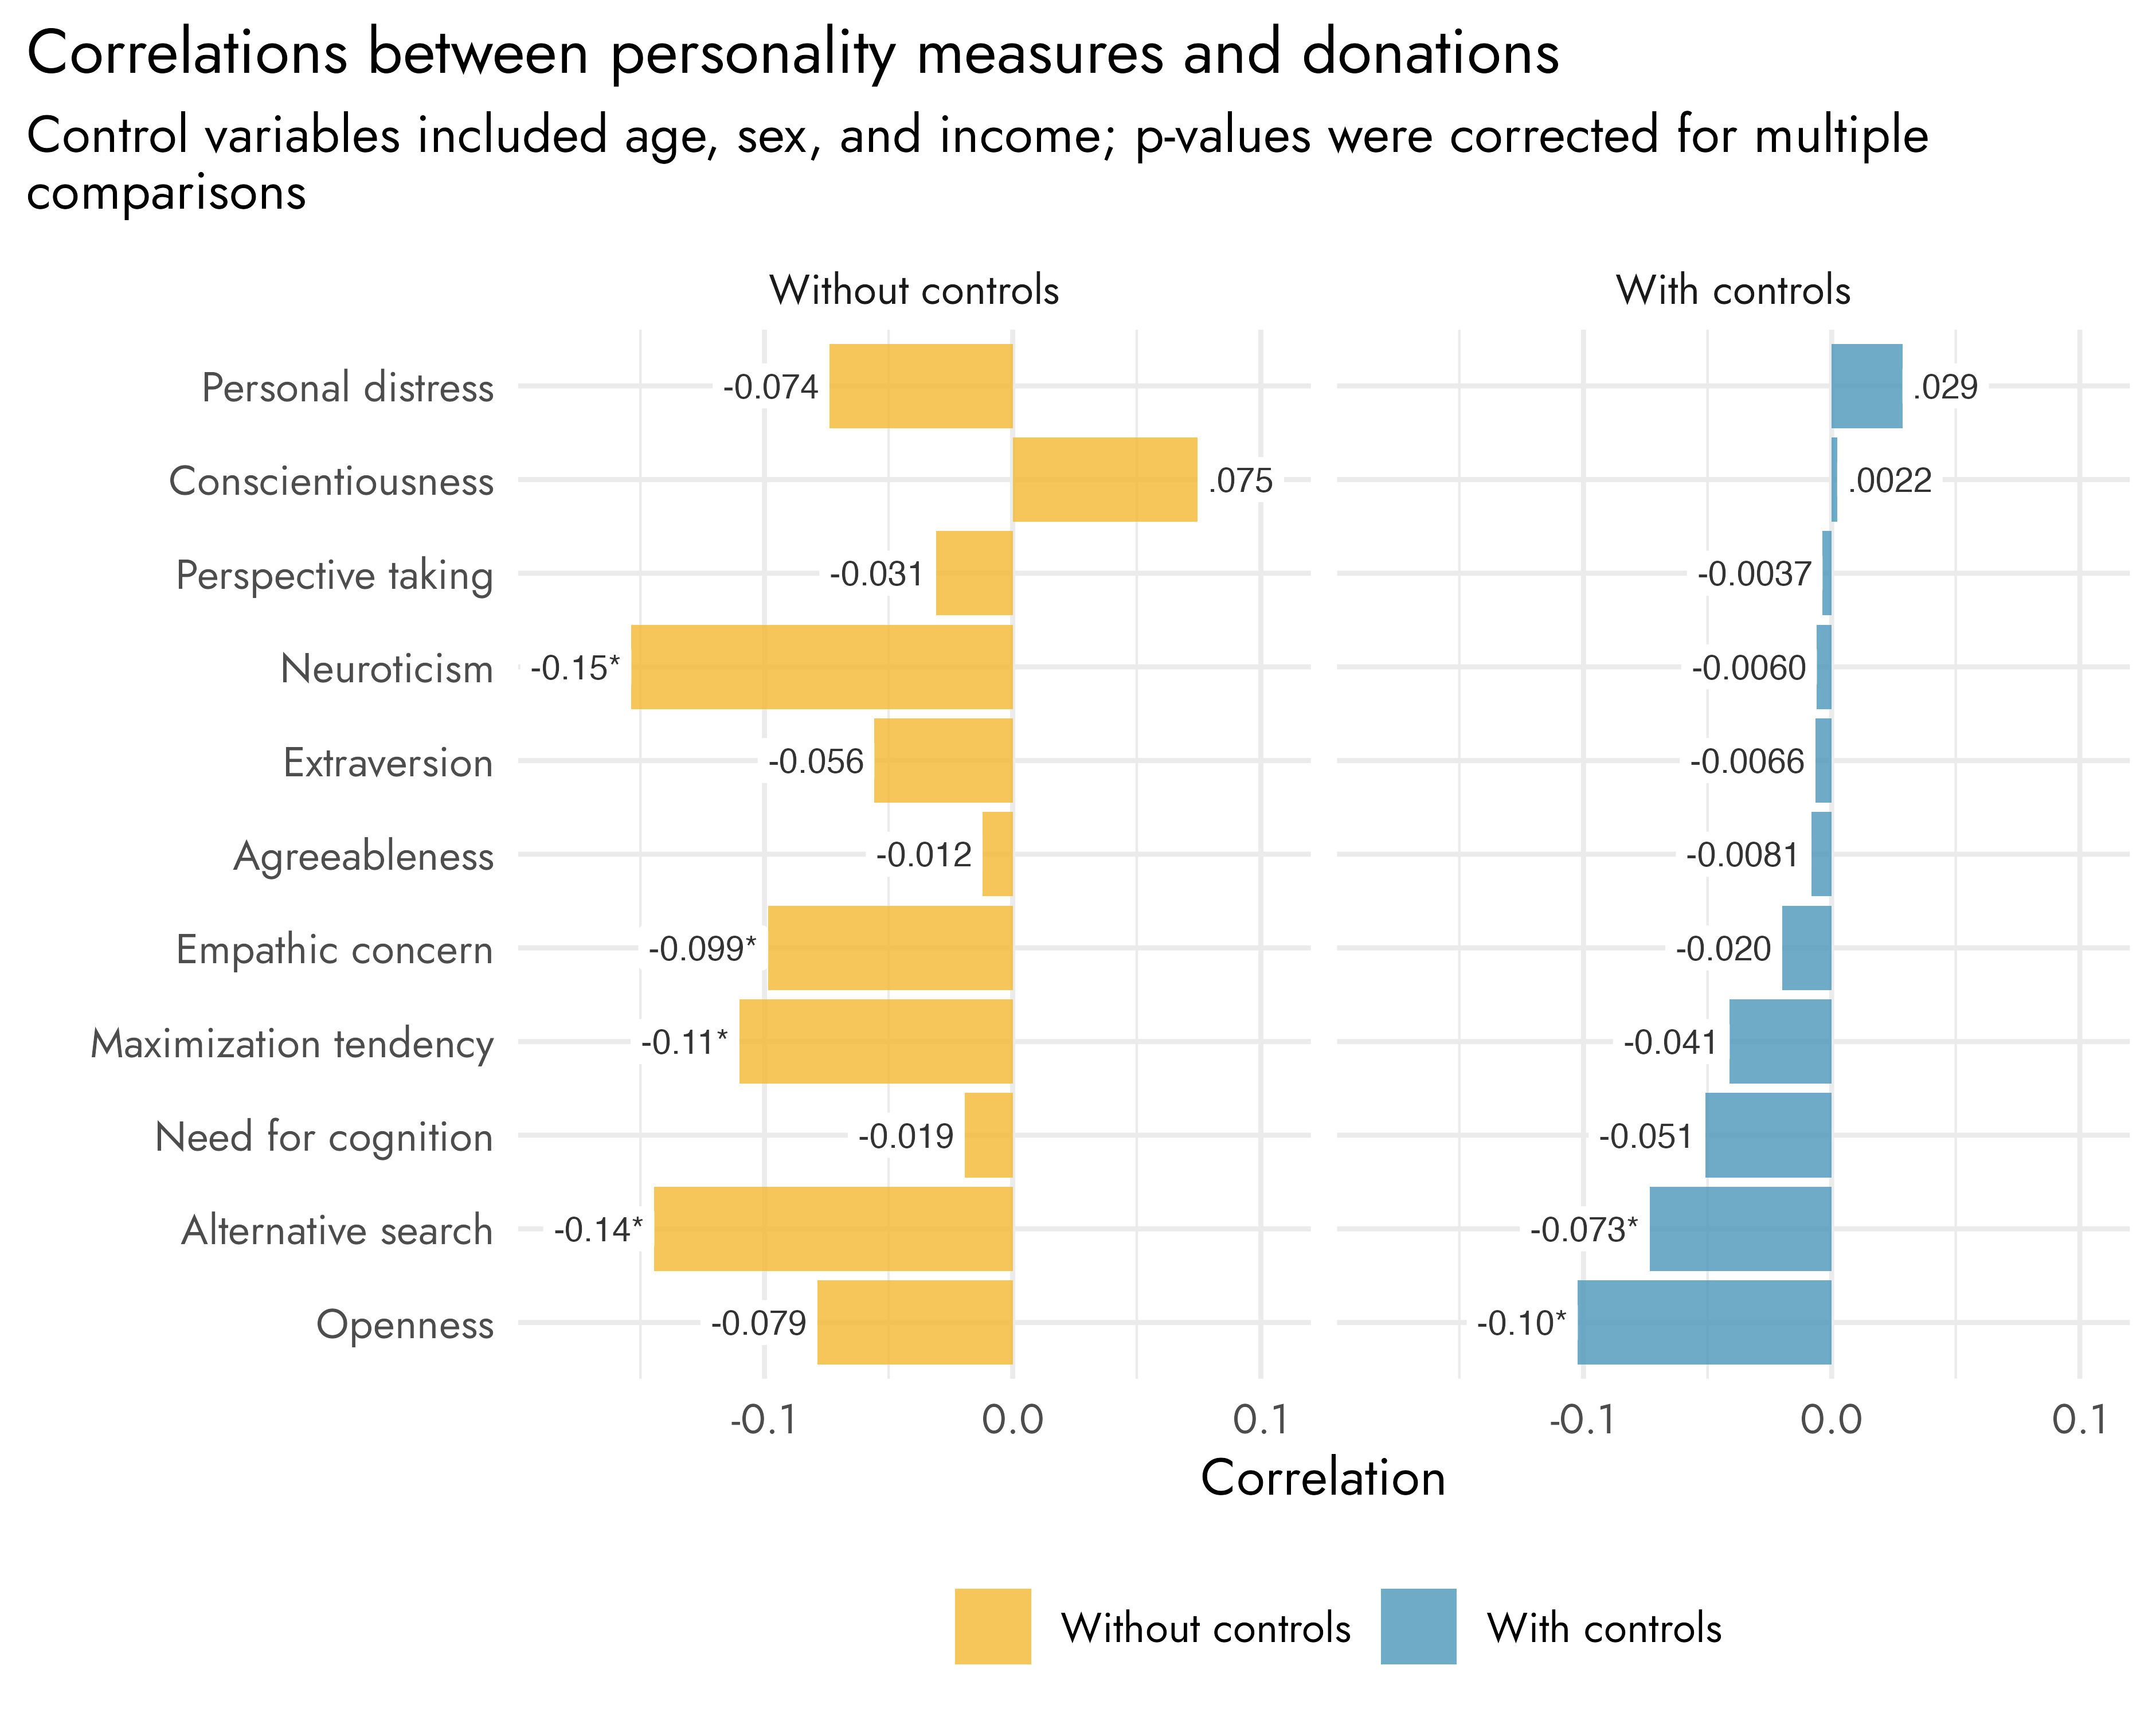
Overall, we found only small associations between personality, donation behavior and cause prioritization.
Openness and alternative search were both found to be negatively associated with the amount donated.
These associations were found controlling for sex, age, and individual income, and survived corrections for multiple comparisons.
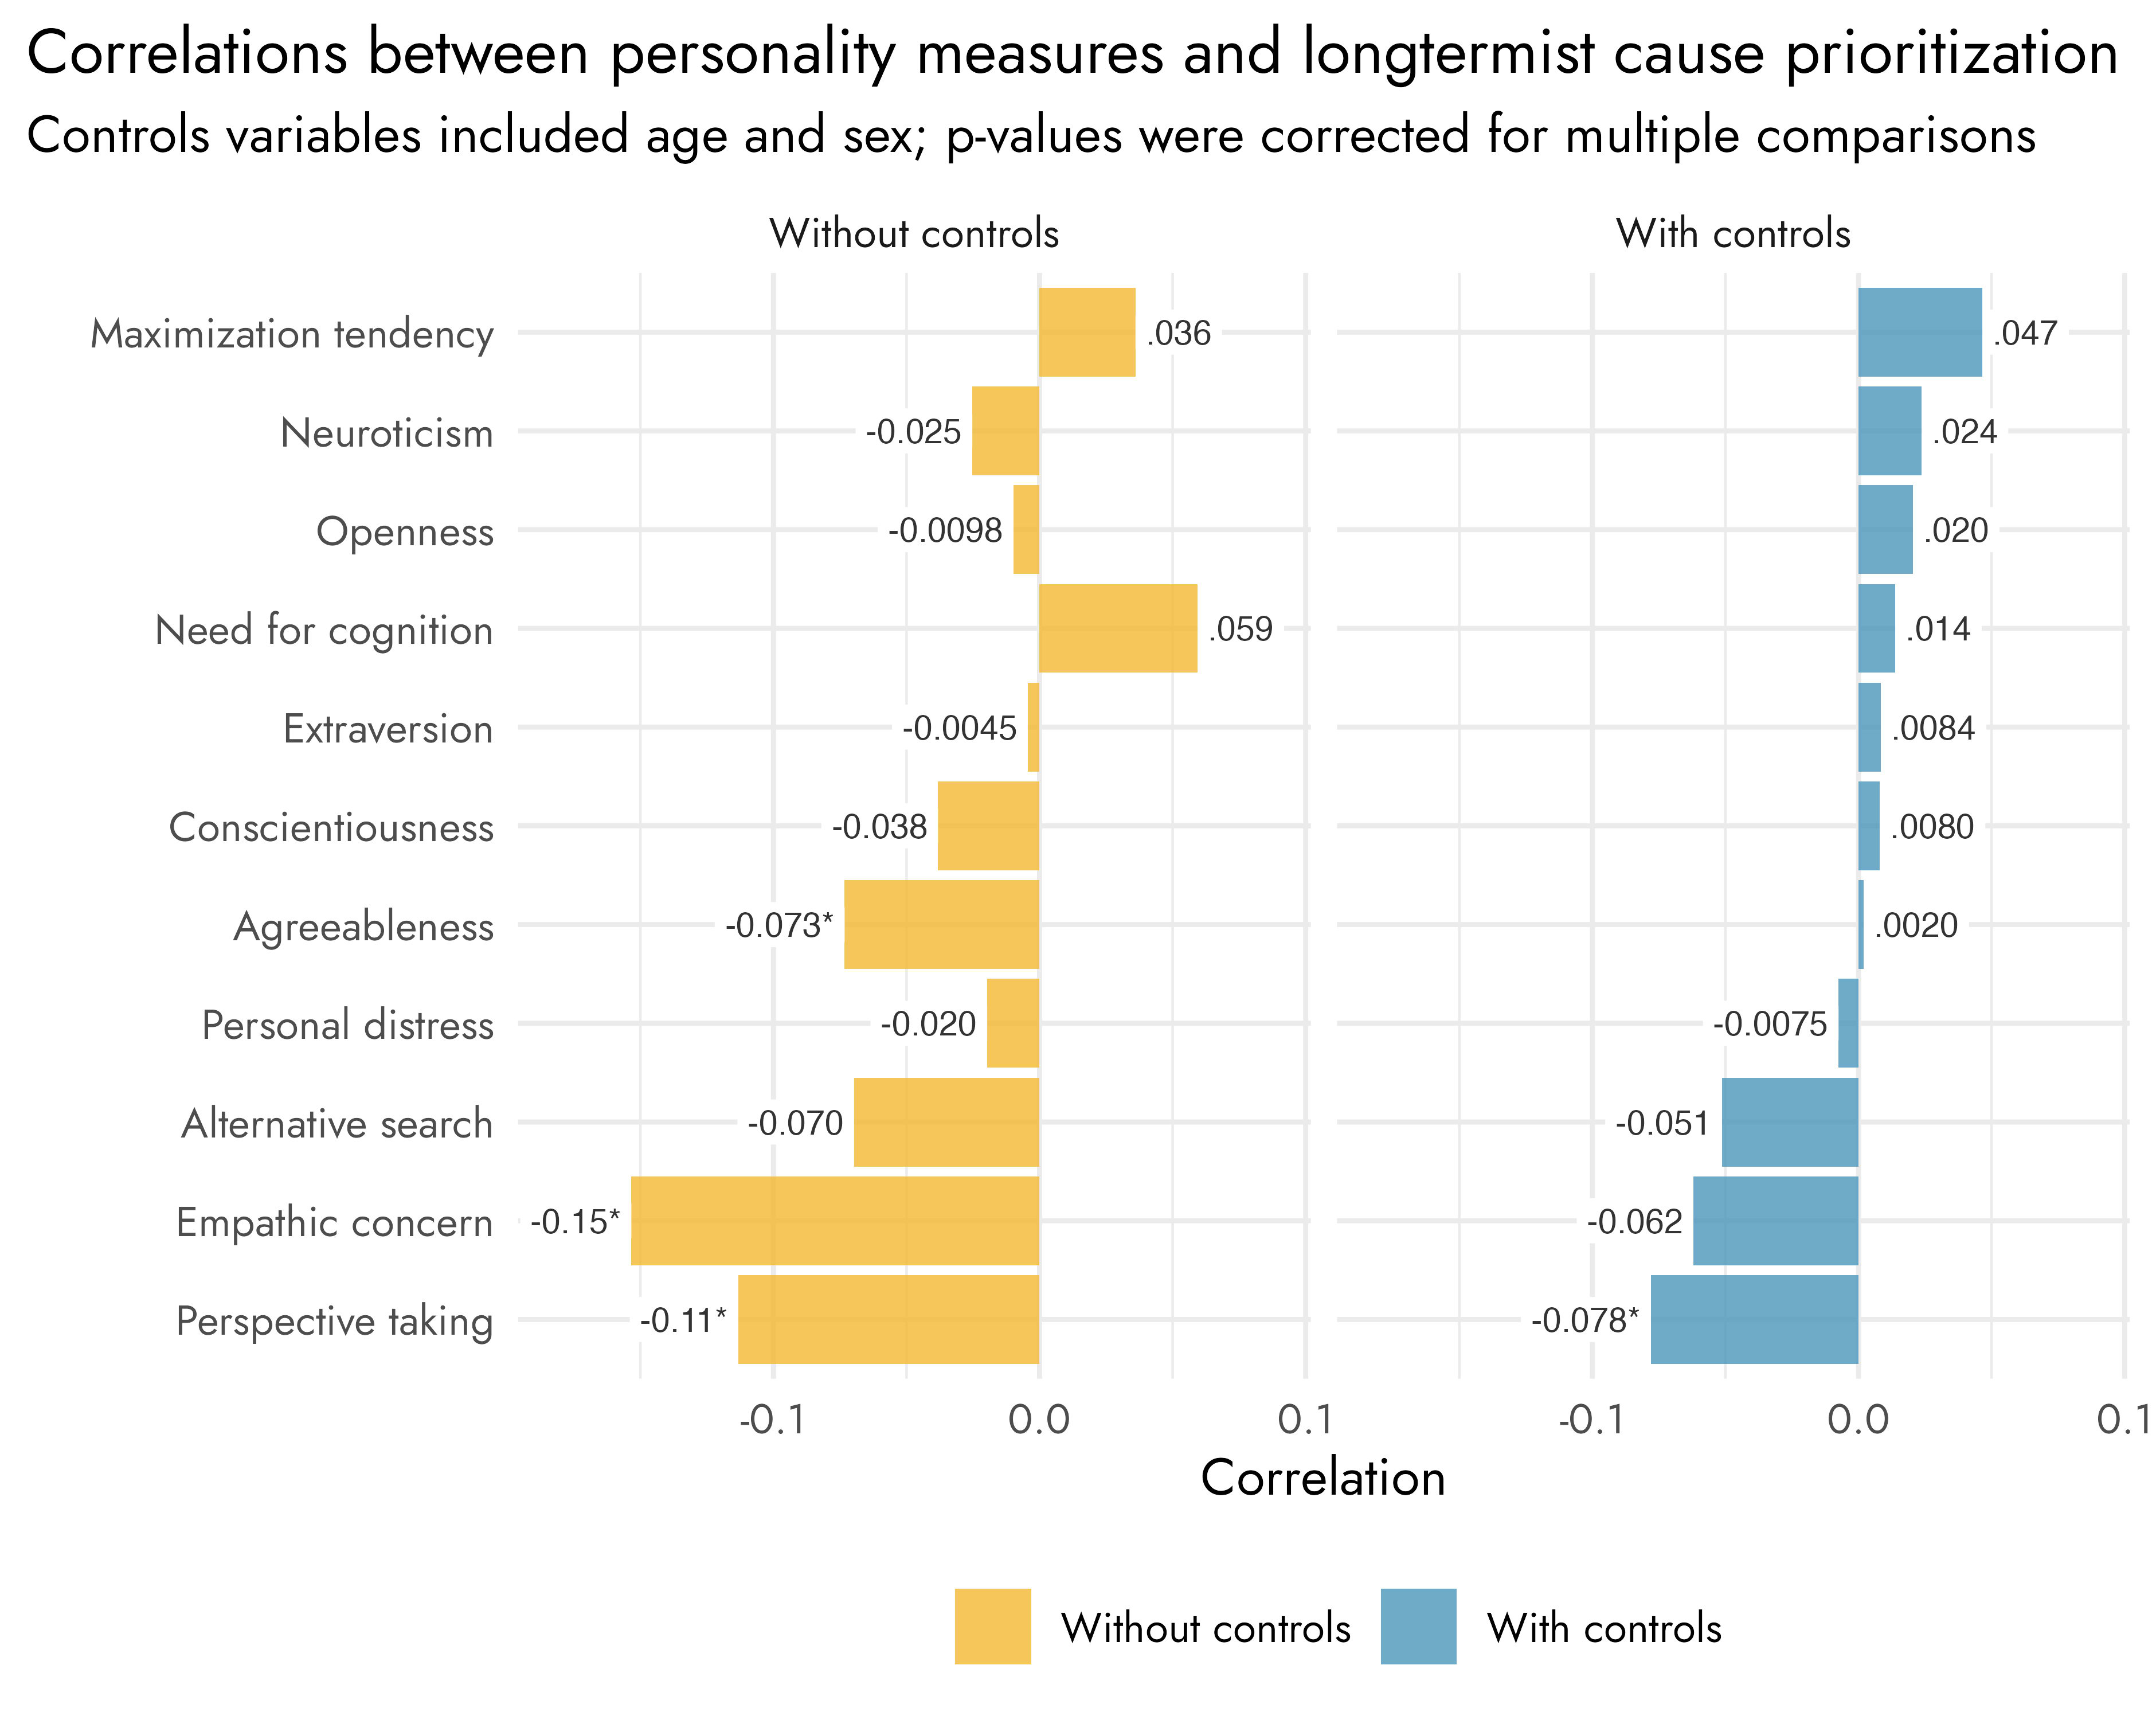
Perspective taking was negatively associated with prioritizing longtermist causes, meaning those who score lower on these traits were more likely to prioritize longtermist causes.
This association was found controlling for sex and age, and survived corrections for multiple comparisons.
Introduction
There has been considerable interest in EA and personality psychology (e.g. here, here, here, here, here and here).
In the 2018 EA Survey, respondents could complete an extra section of the EA Survey that contained several personality measures. A total of 1602 respondents answered (some of) the personality questions. These included the Big Five, Need for Cognition, the Interpersonal Reactivity Index, and a scale to assess maximization.
We report these results for others to gain a better understanding of the personality of members of the EA community. Additionally, personality traits have been found to be predictive of various important outcomes such as life, job, and relationship satisfaction. In the context of the EA community, prediction of donation behavior and cause prioritization may be of particular interest.[1]
Big Five
Respondents were asked to indicate how much they agree or disagree with whether a pair of personality traits applies to them, on a 7-point Likert scale ranging from ‘Strongly disagree’ to ‘Strongly agree’. The specific personality traits were drawn from the Ten Item Personality Inventory (TIPI) and consisted of:
Extraverted, enthusiastic.
Critical, quarrelsome.
Dependable, self-disciplined.
Anxious, easily upset.
Open to new experiences, complex.
Reserved, quiet.
Sympathetic, warm.
Disorganized, careless.
Calm, emotionally stable.
Conventional, uncreative.
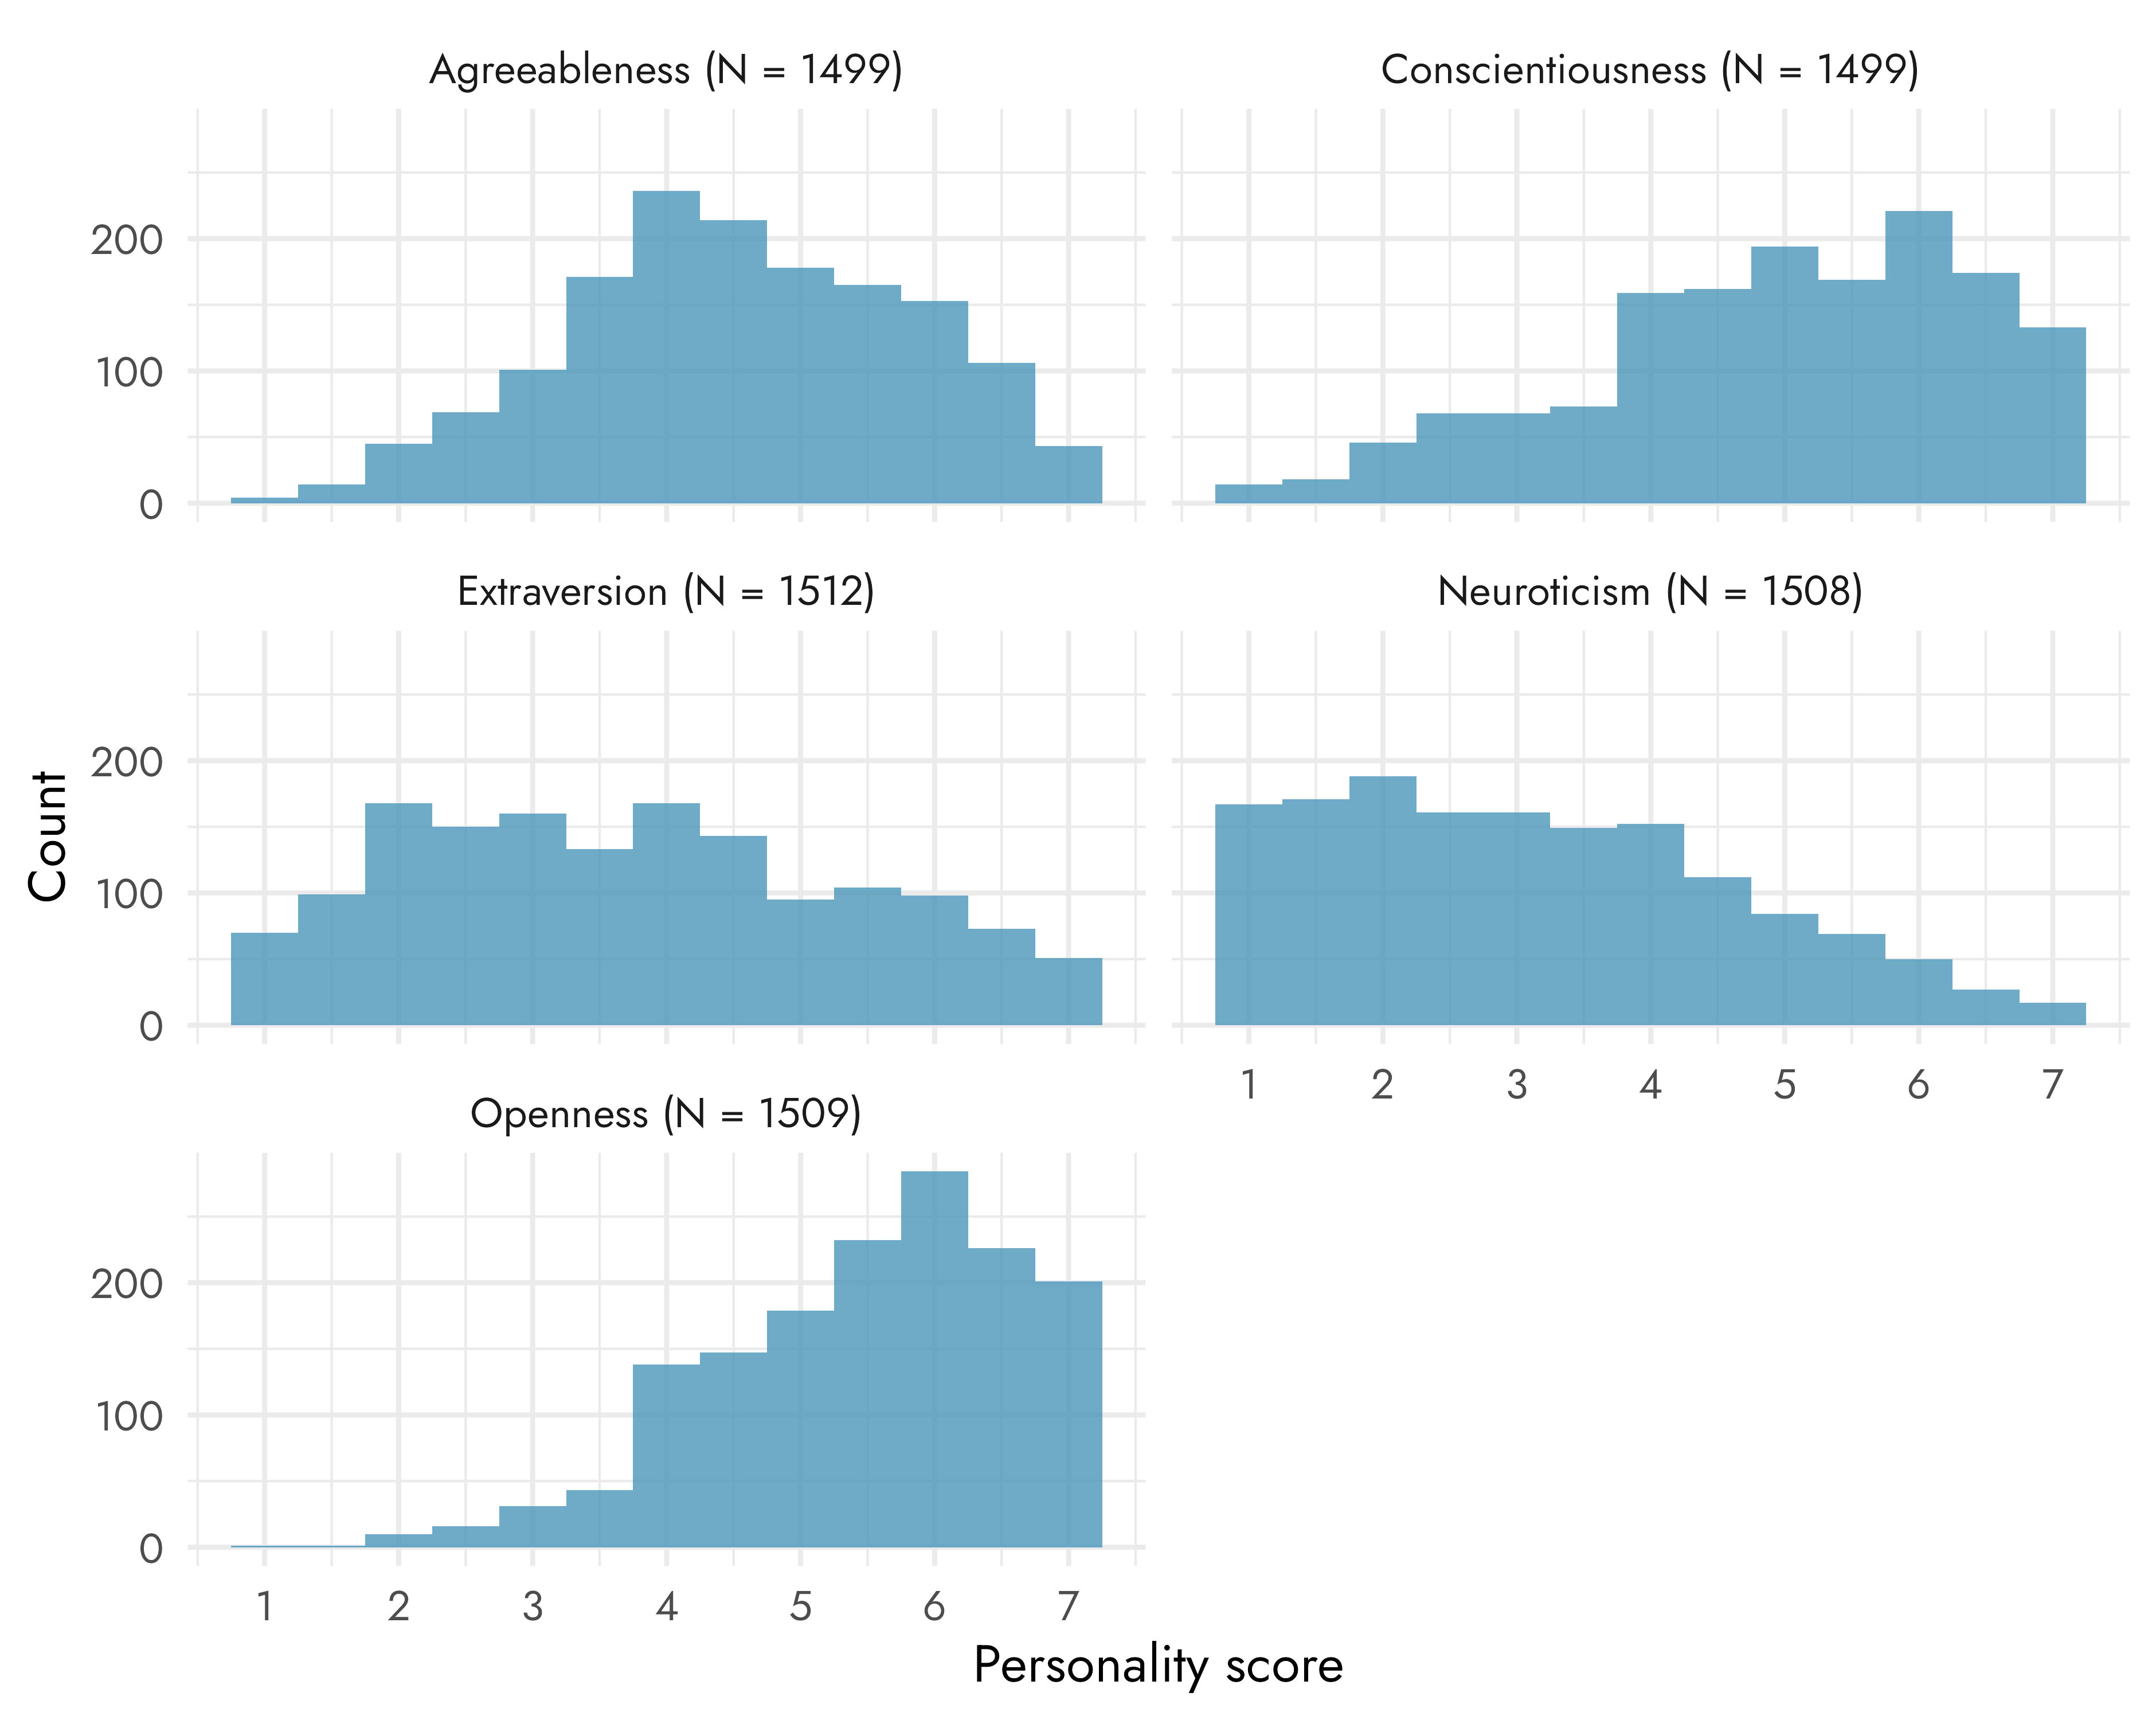
Big Five score distributions
The plots below show the distribution of responses, including the sample size, to these questions in our sample. Each individual response is an average of the, in this case two, personality items. We show distributions for each individual item in the Appendix.
Personality trait
M
SD
n
Agreeableness
4.54
1.27
1499
Conscientiousness
4.95
1.44
1499
Extraversion
3.74
1.63
1512
Neuroticism
3.12
1.53
1508
Openness
5.48
1.13
1509
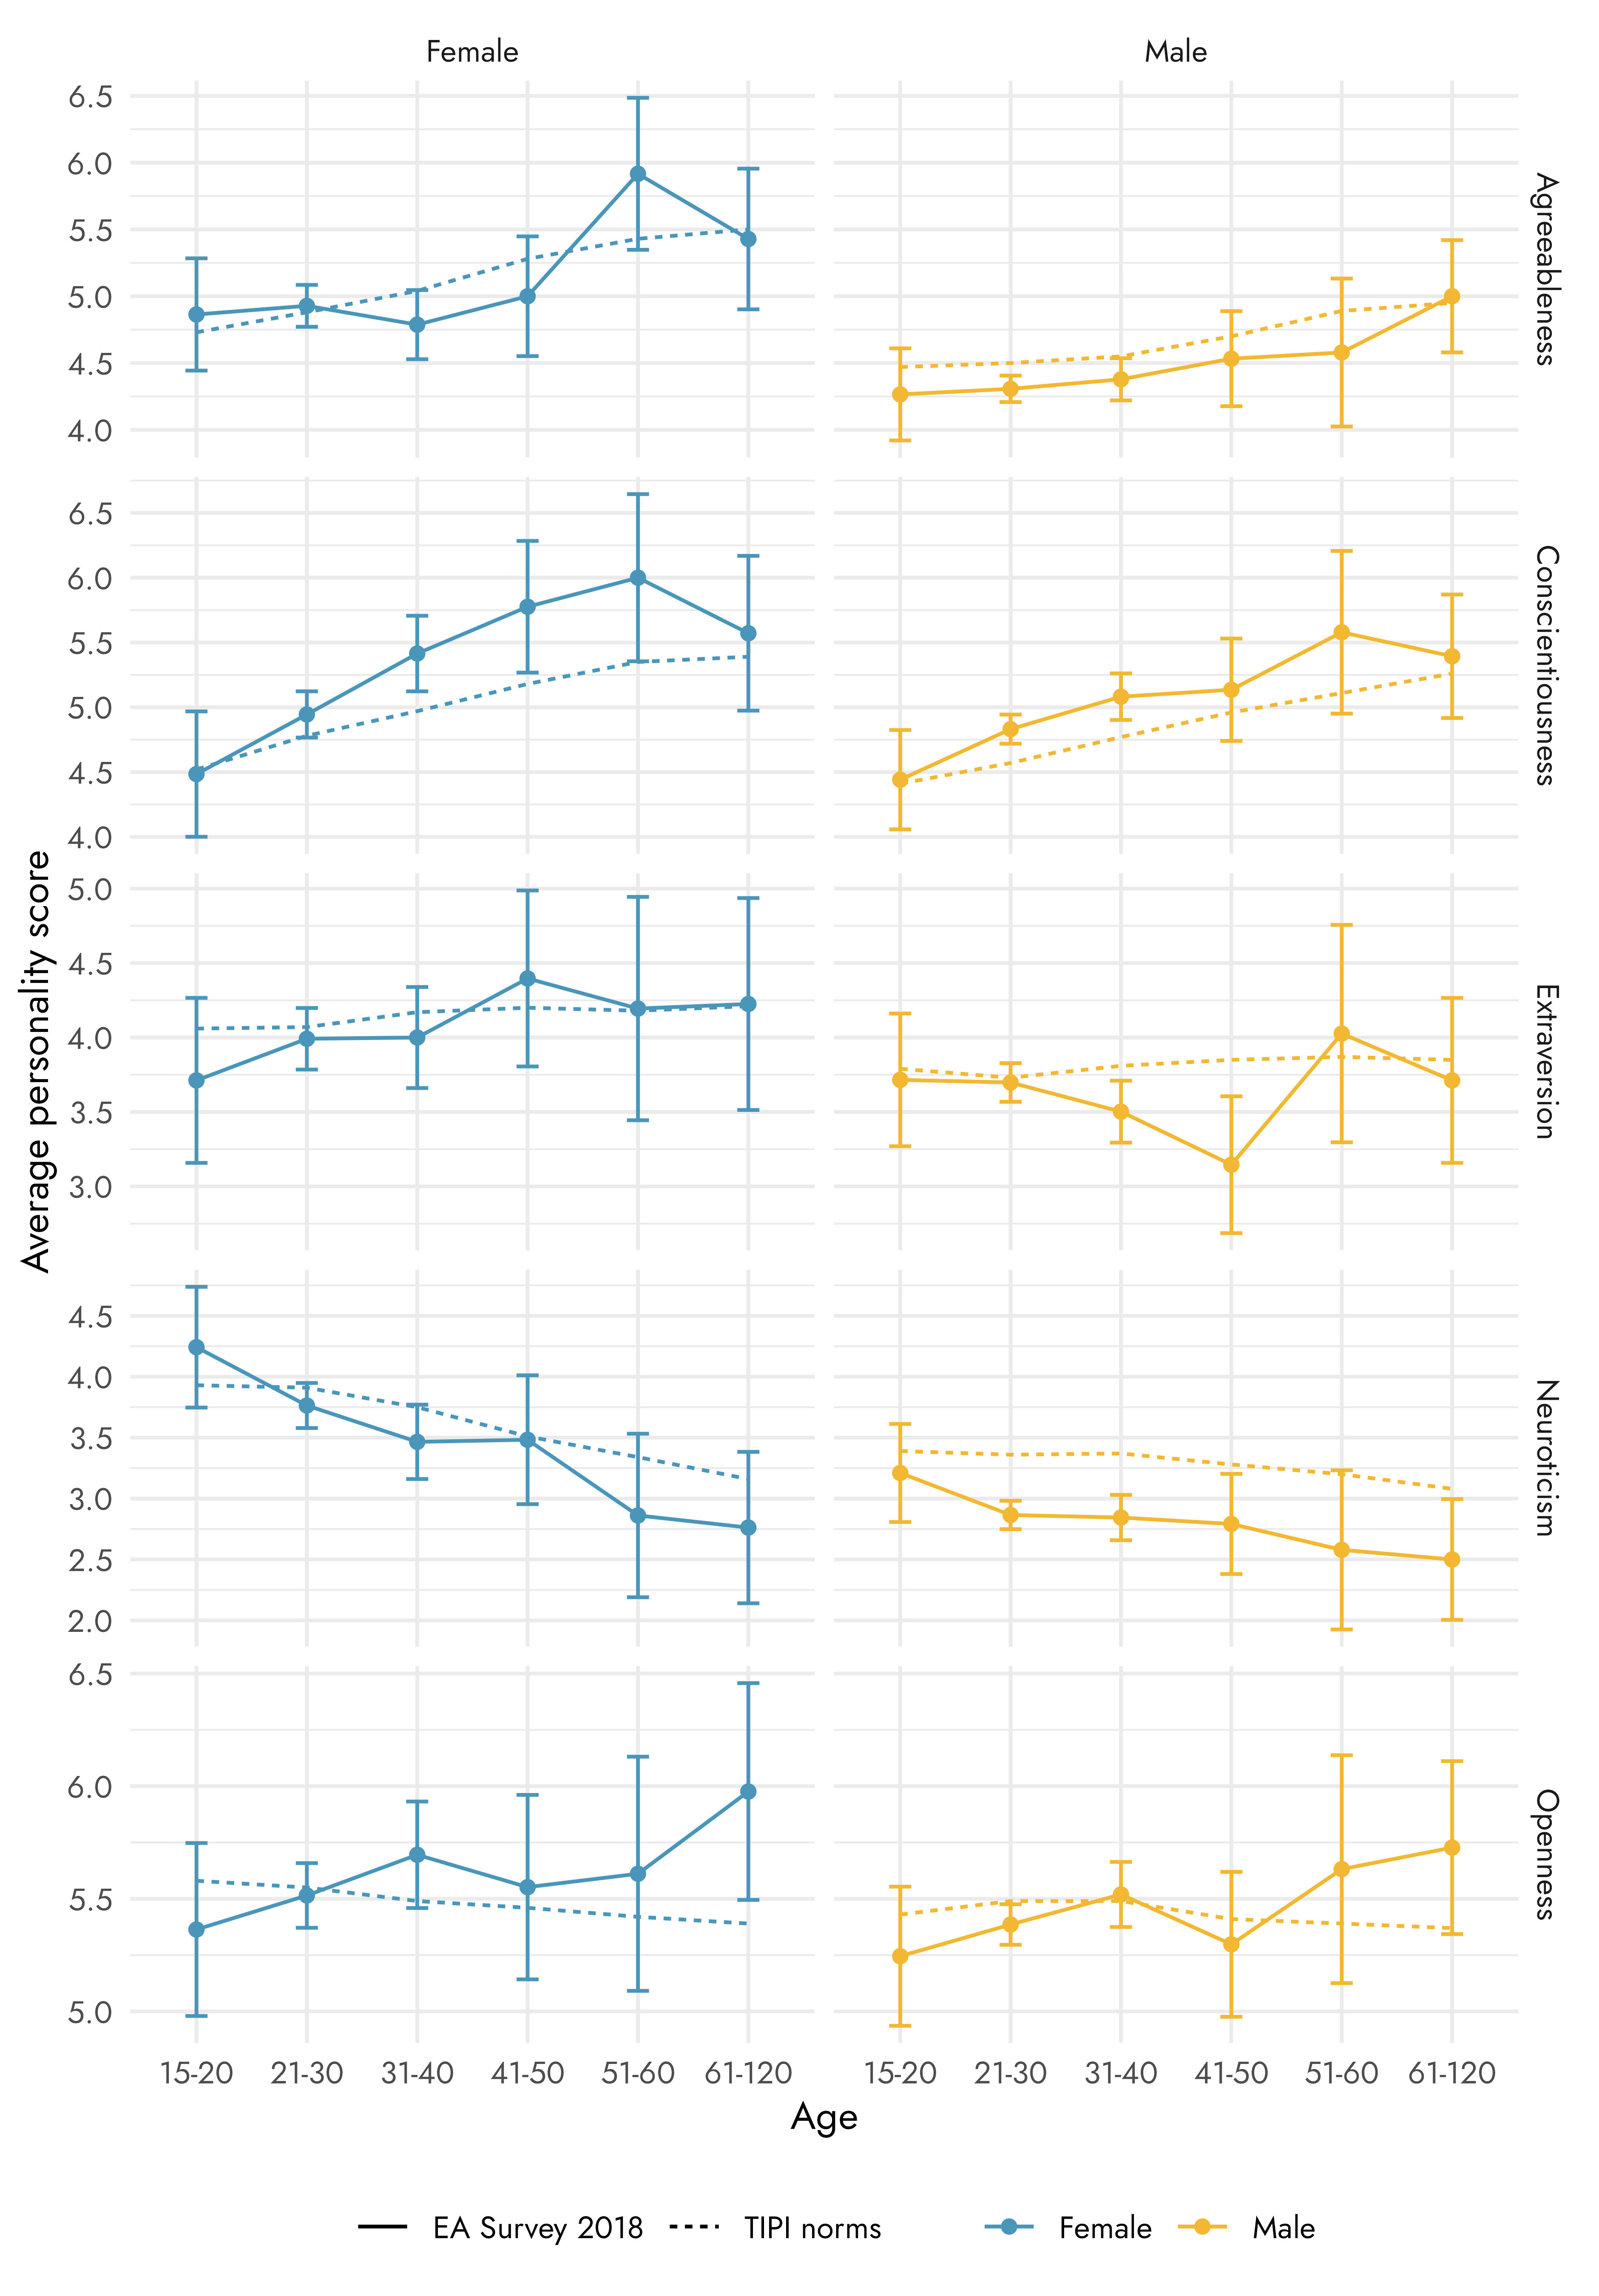
However, personality scores have been found to differ based on gender and age (Schmitt et al., 2008; Donnellan et al., 2008; Lehmann et al., 2013). As such, it is common for the population norms for personality measures to be split based on these groups. Otherwise, differences between EA Big Five scores and the general population, could simply reflect the fact that the EA population is younger and more male than the general population.
In the plots below we show how the Big Five scores in our sample differ from the TIPI population norms[2]. It’s important to note that our sample size is very small for the older age brackets, which is reflected in the wider confidence intervals.
These results suggest that:
Younger male EAs and older female EAs score higher on conscientiousness compared to the general population
Male EAs score lower on neuroticism[3] than the general public
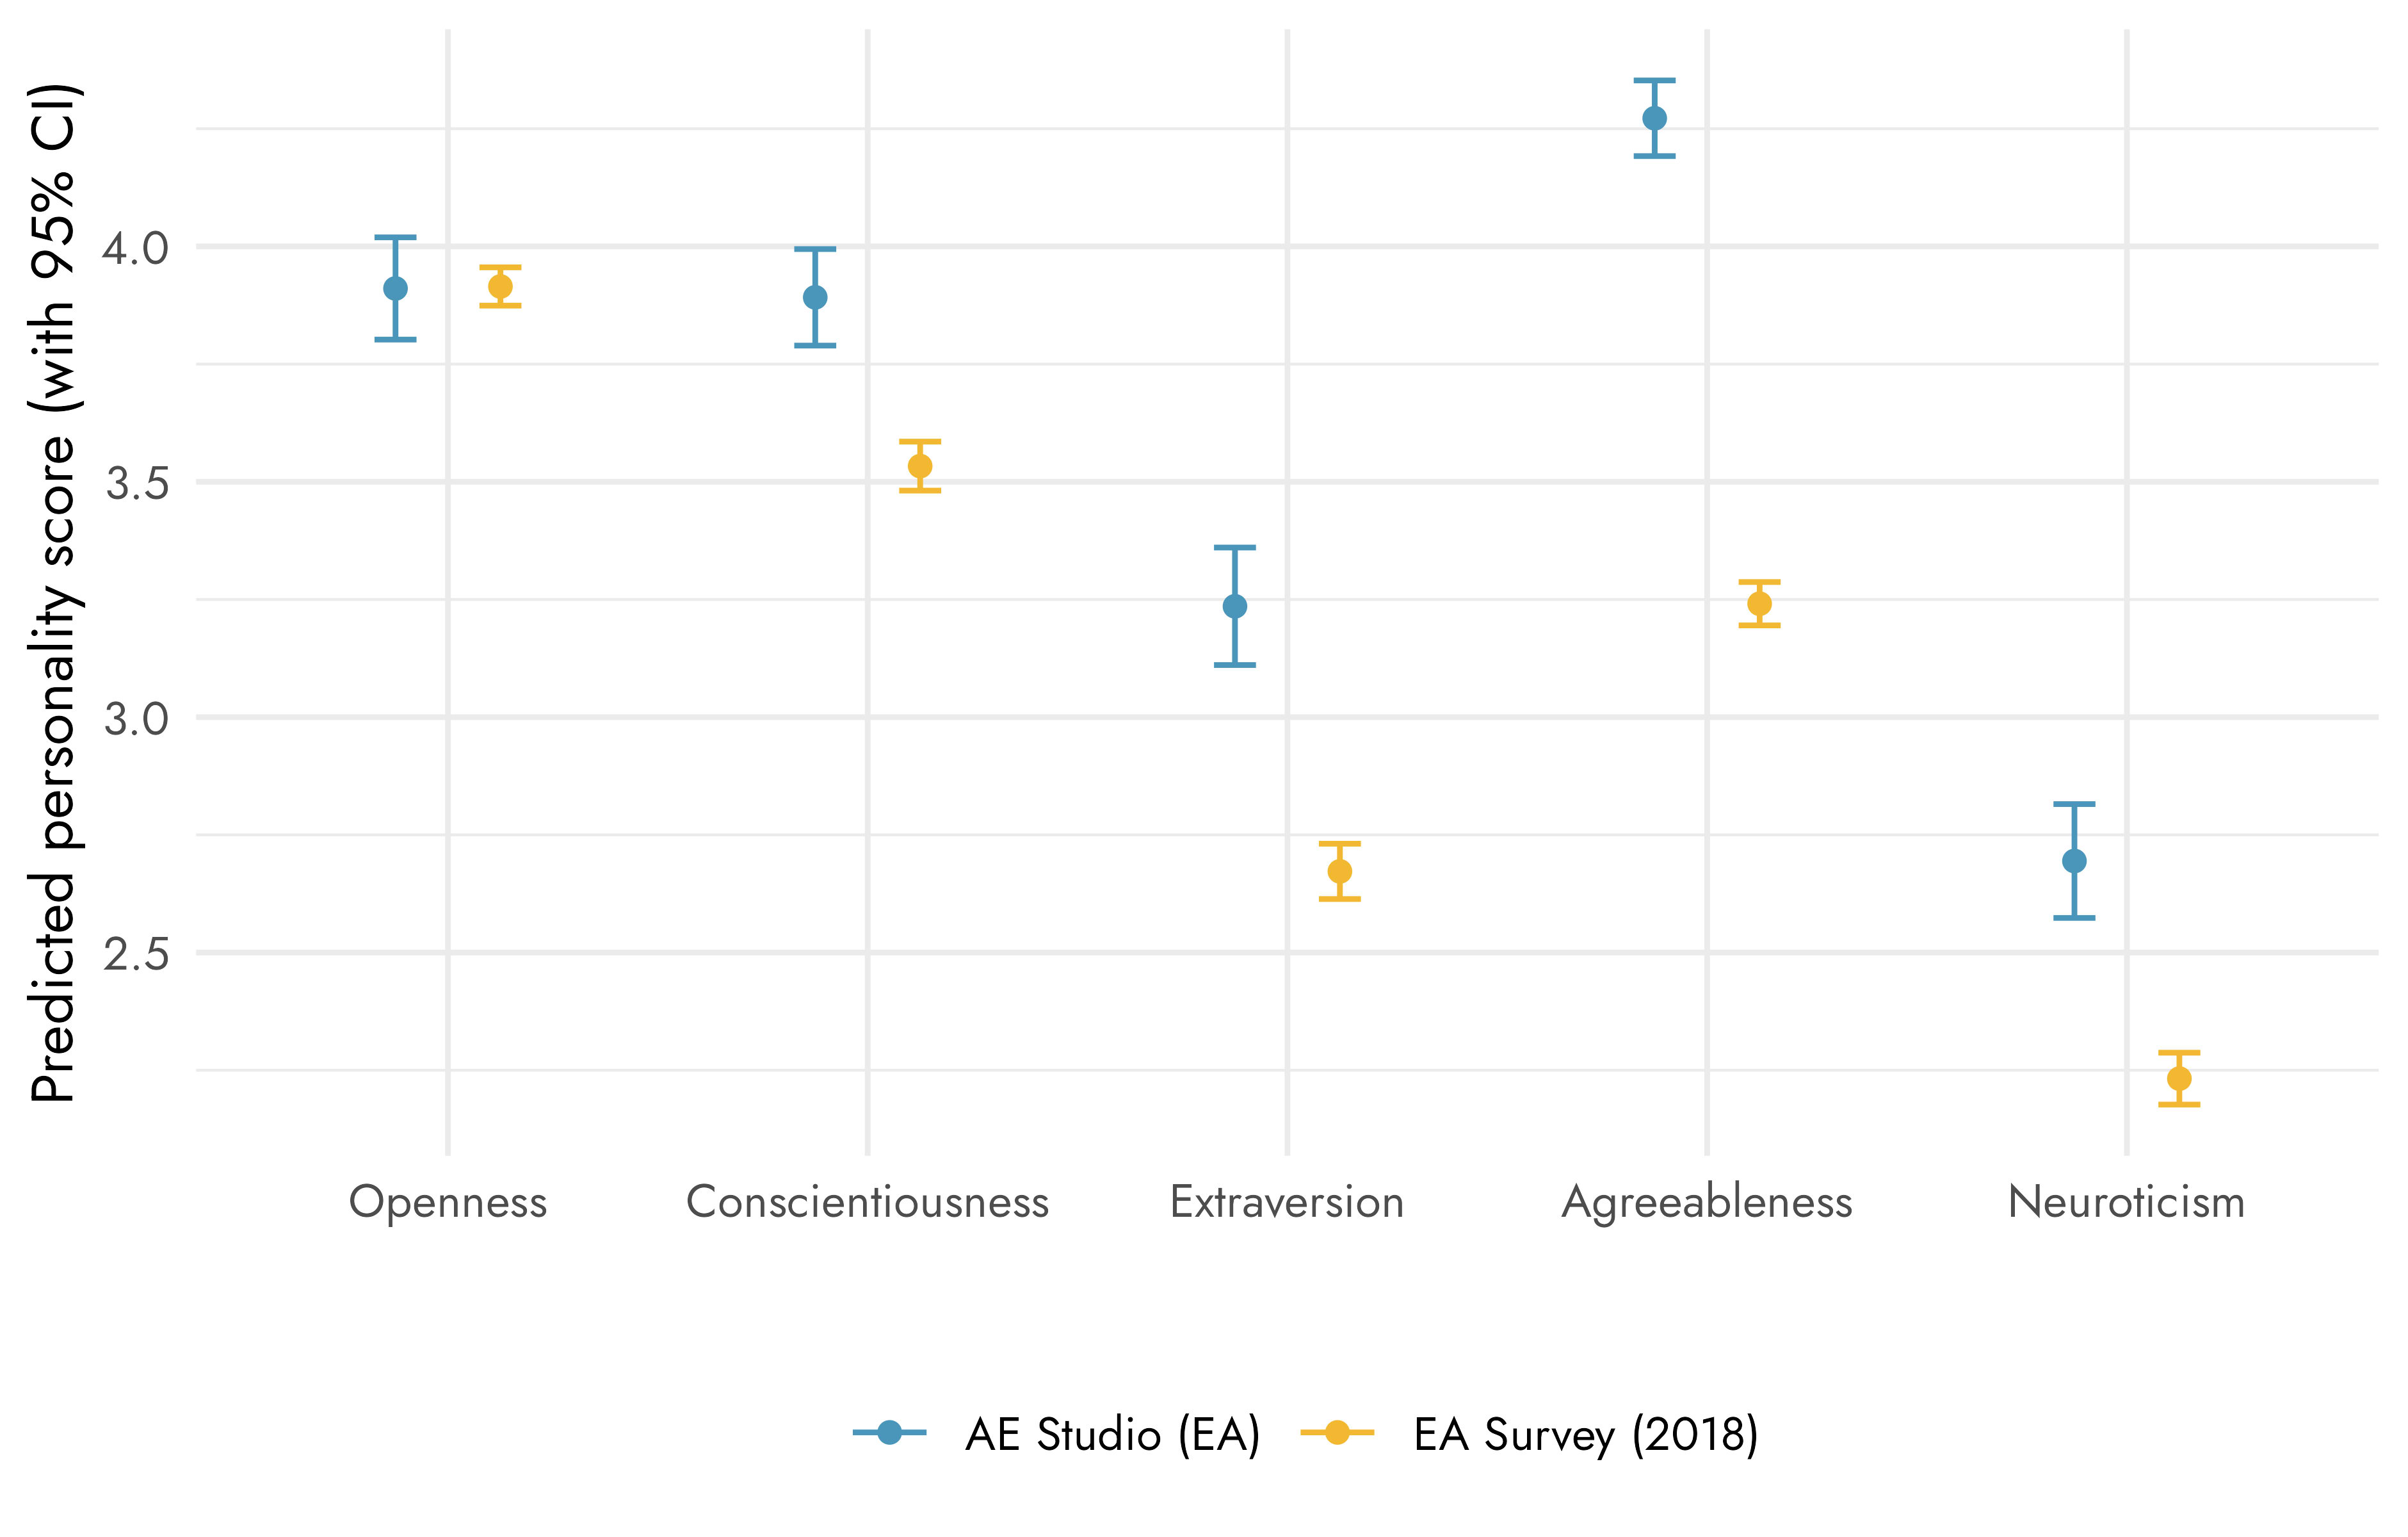
Comparing EA Survey 2018 to AE Studio’s survey
AE Studio recently reported the results of a survey of 250 EAs. Their survey also included a Big Five personality measure, enabling a comparison between their results and ours. Compared to AE Studio’s survey, we found lower levels of agreeableness, extraversion, and neuroticism among EAs.[4] However, as noted above, it is important to note that these differences could simply reflect differences in the composition of our respective samples or our use of different measures of the Big Five.
Need for Cognition
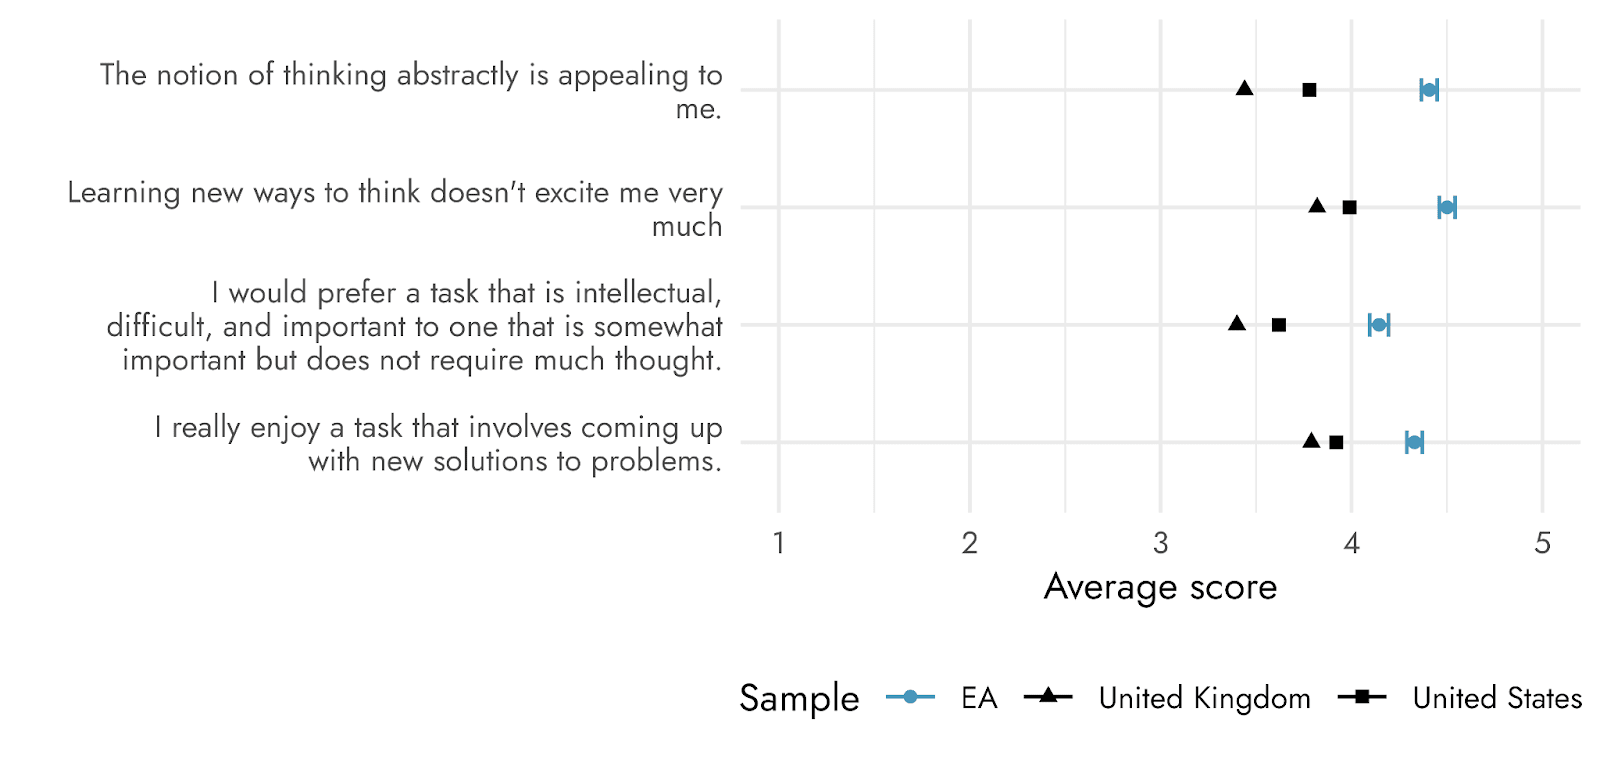
Respondents were also asked to indicate their agreement with four statements assessing their need for cognition. Specifically, respondents were asked to respond to the following statements:
I really enjoy a task that involves coming up with new solutions to problems.
Learning new ways to think doesn't excite me very much
The notion of thinking abstractly is appealing to me.
I would prefer a task that is intellectual, difficult, and important to one that is somewhat important but does not require much thought.
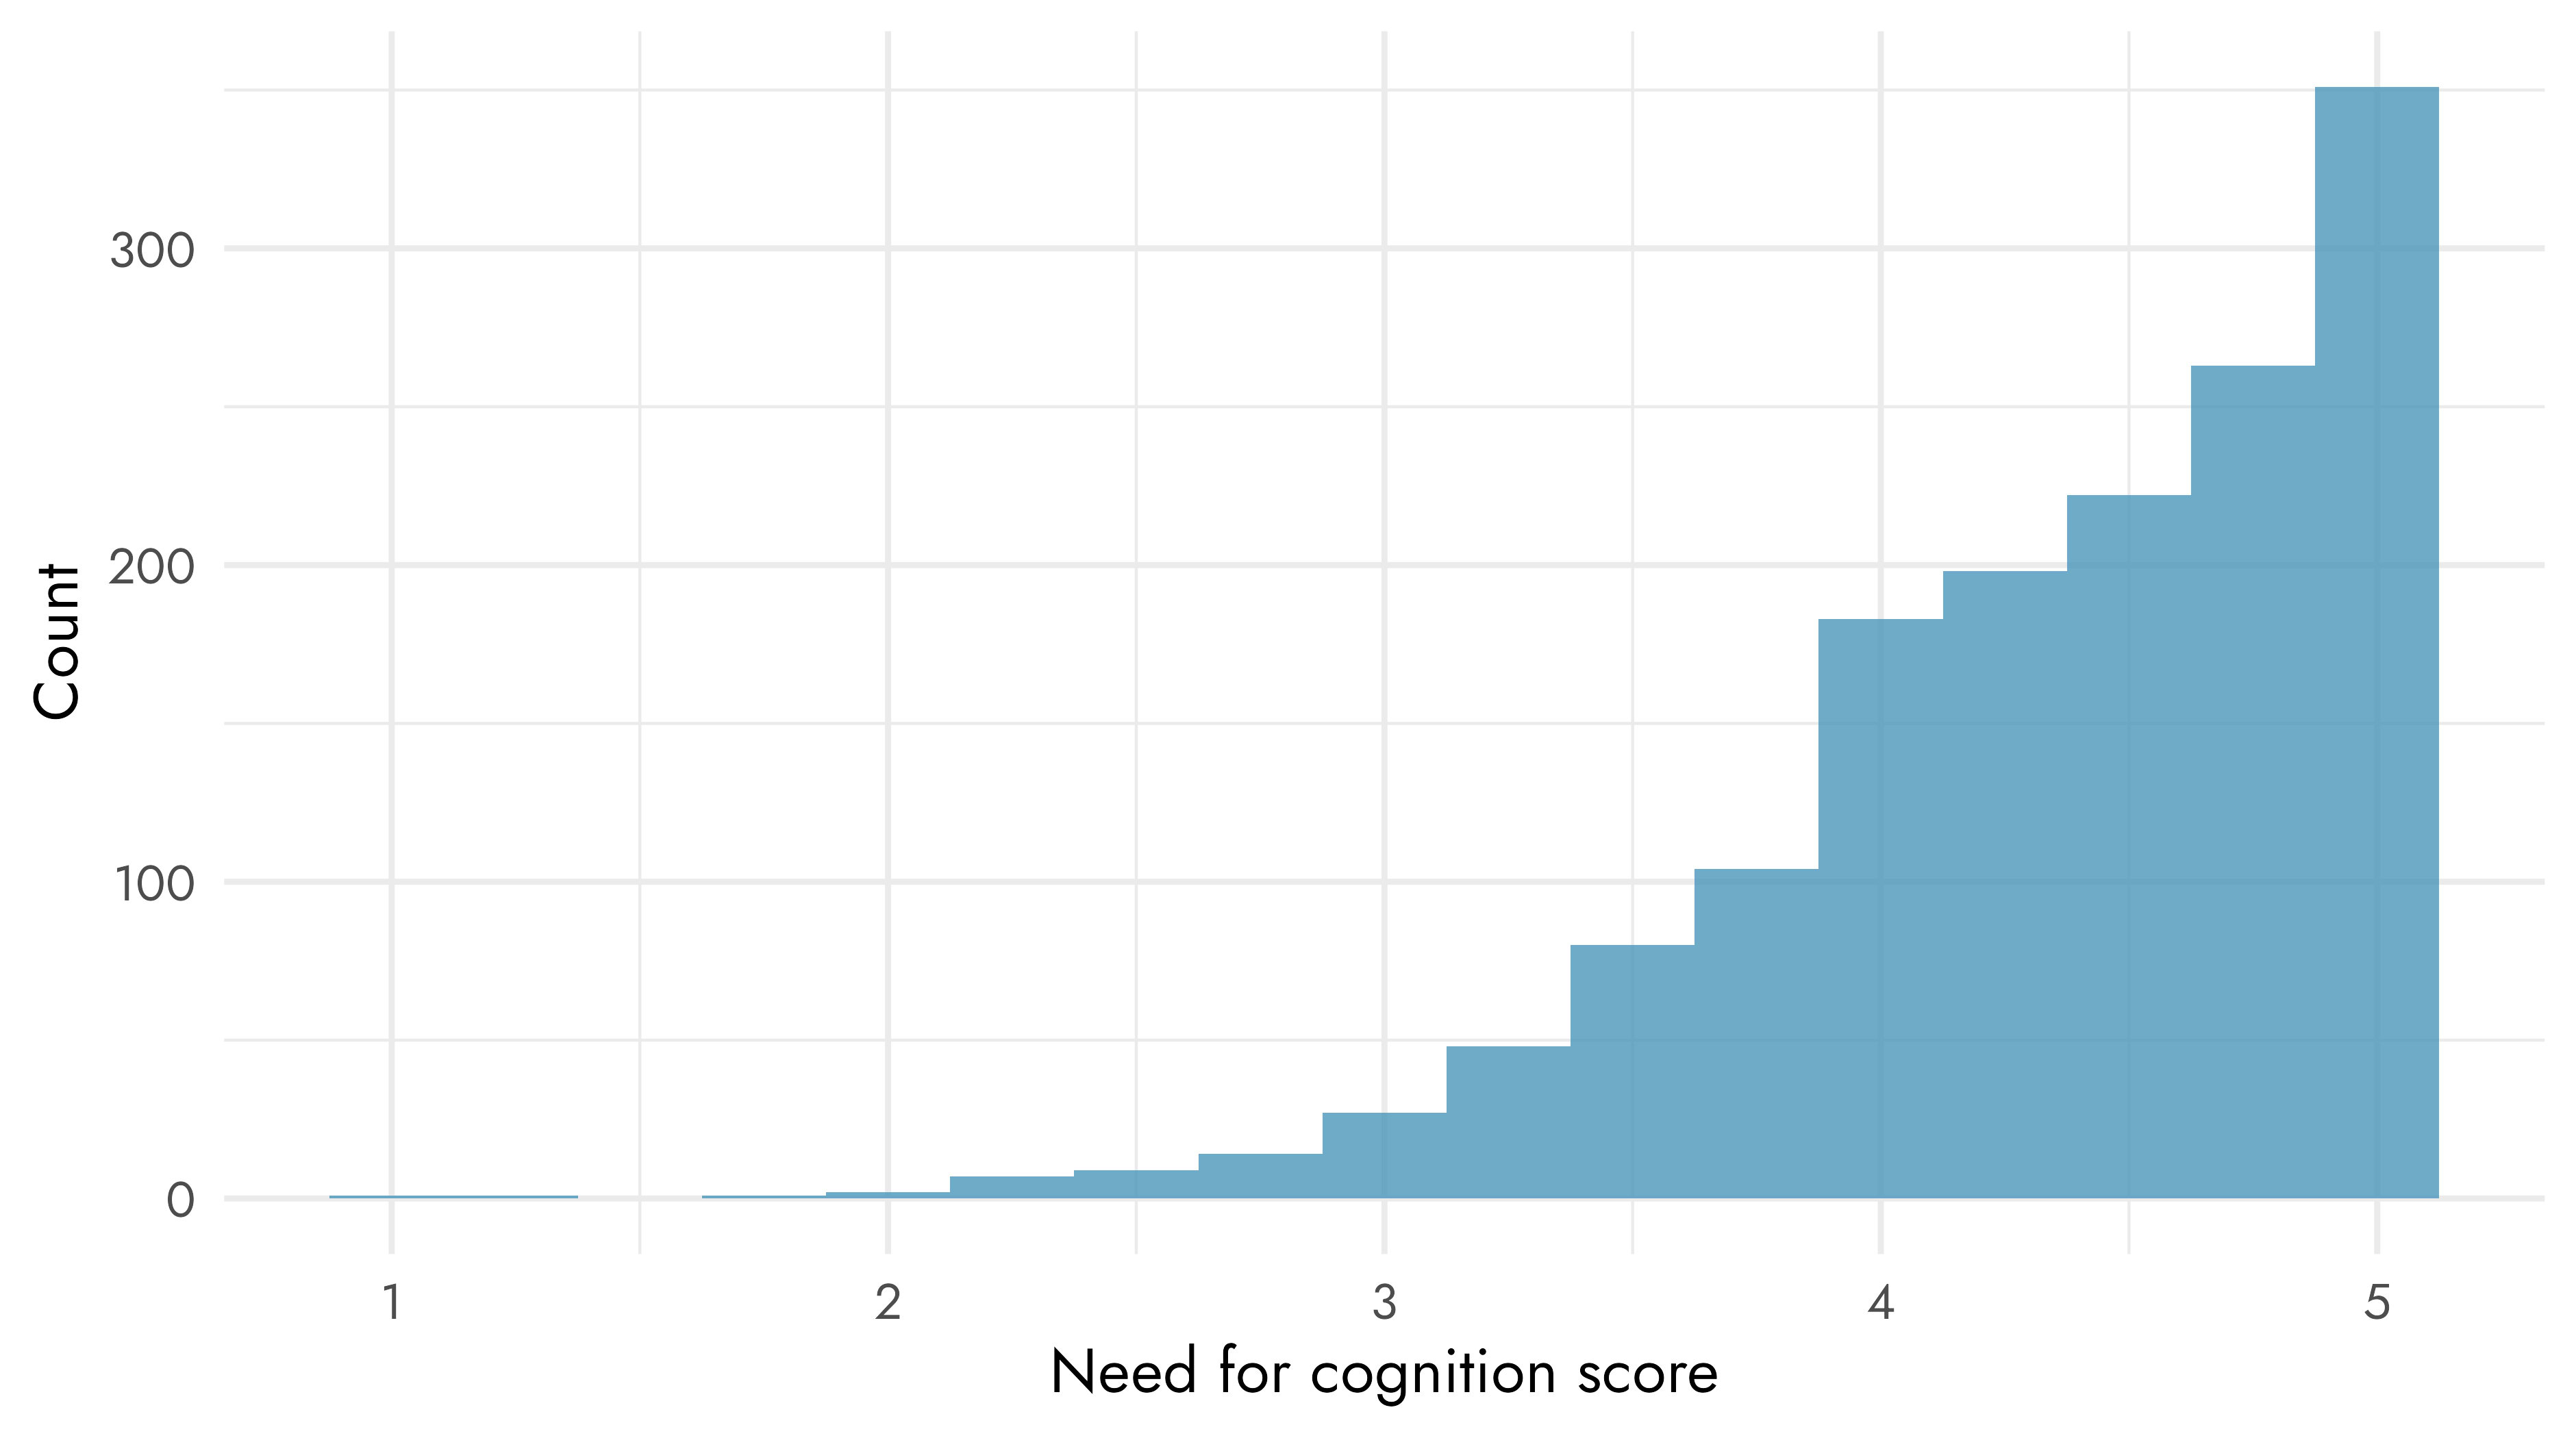
Need for cognition score distribution
The results show that EAs (N = 1511) score high on need for cognition with an average of 4.35.
Personality trait
M
SD
n
Need for cognition
4.35
0.61
1511
We are not aware of any population norms for the need for cognition, but we can compare the results to data from a study in which they administered an 18-item need for cognition questionnaire to participants from the United States and the United Kingdom, which includes the 4 items that were used in the EA Survey.
Using this data, we see that EAs score higher compared to both samples from the general population. This difference is likely to be partially due to demographic differences between the samples, such as the EA sample consisting mainly of male respondents, who also tend to score higher on the need for cognition. Though the relatively large difference between the difference samples is unlikely to be fully due to this demographic difference.
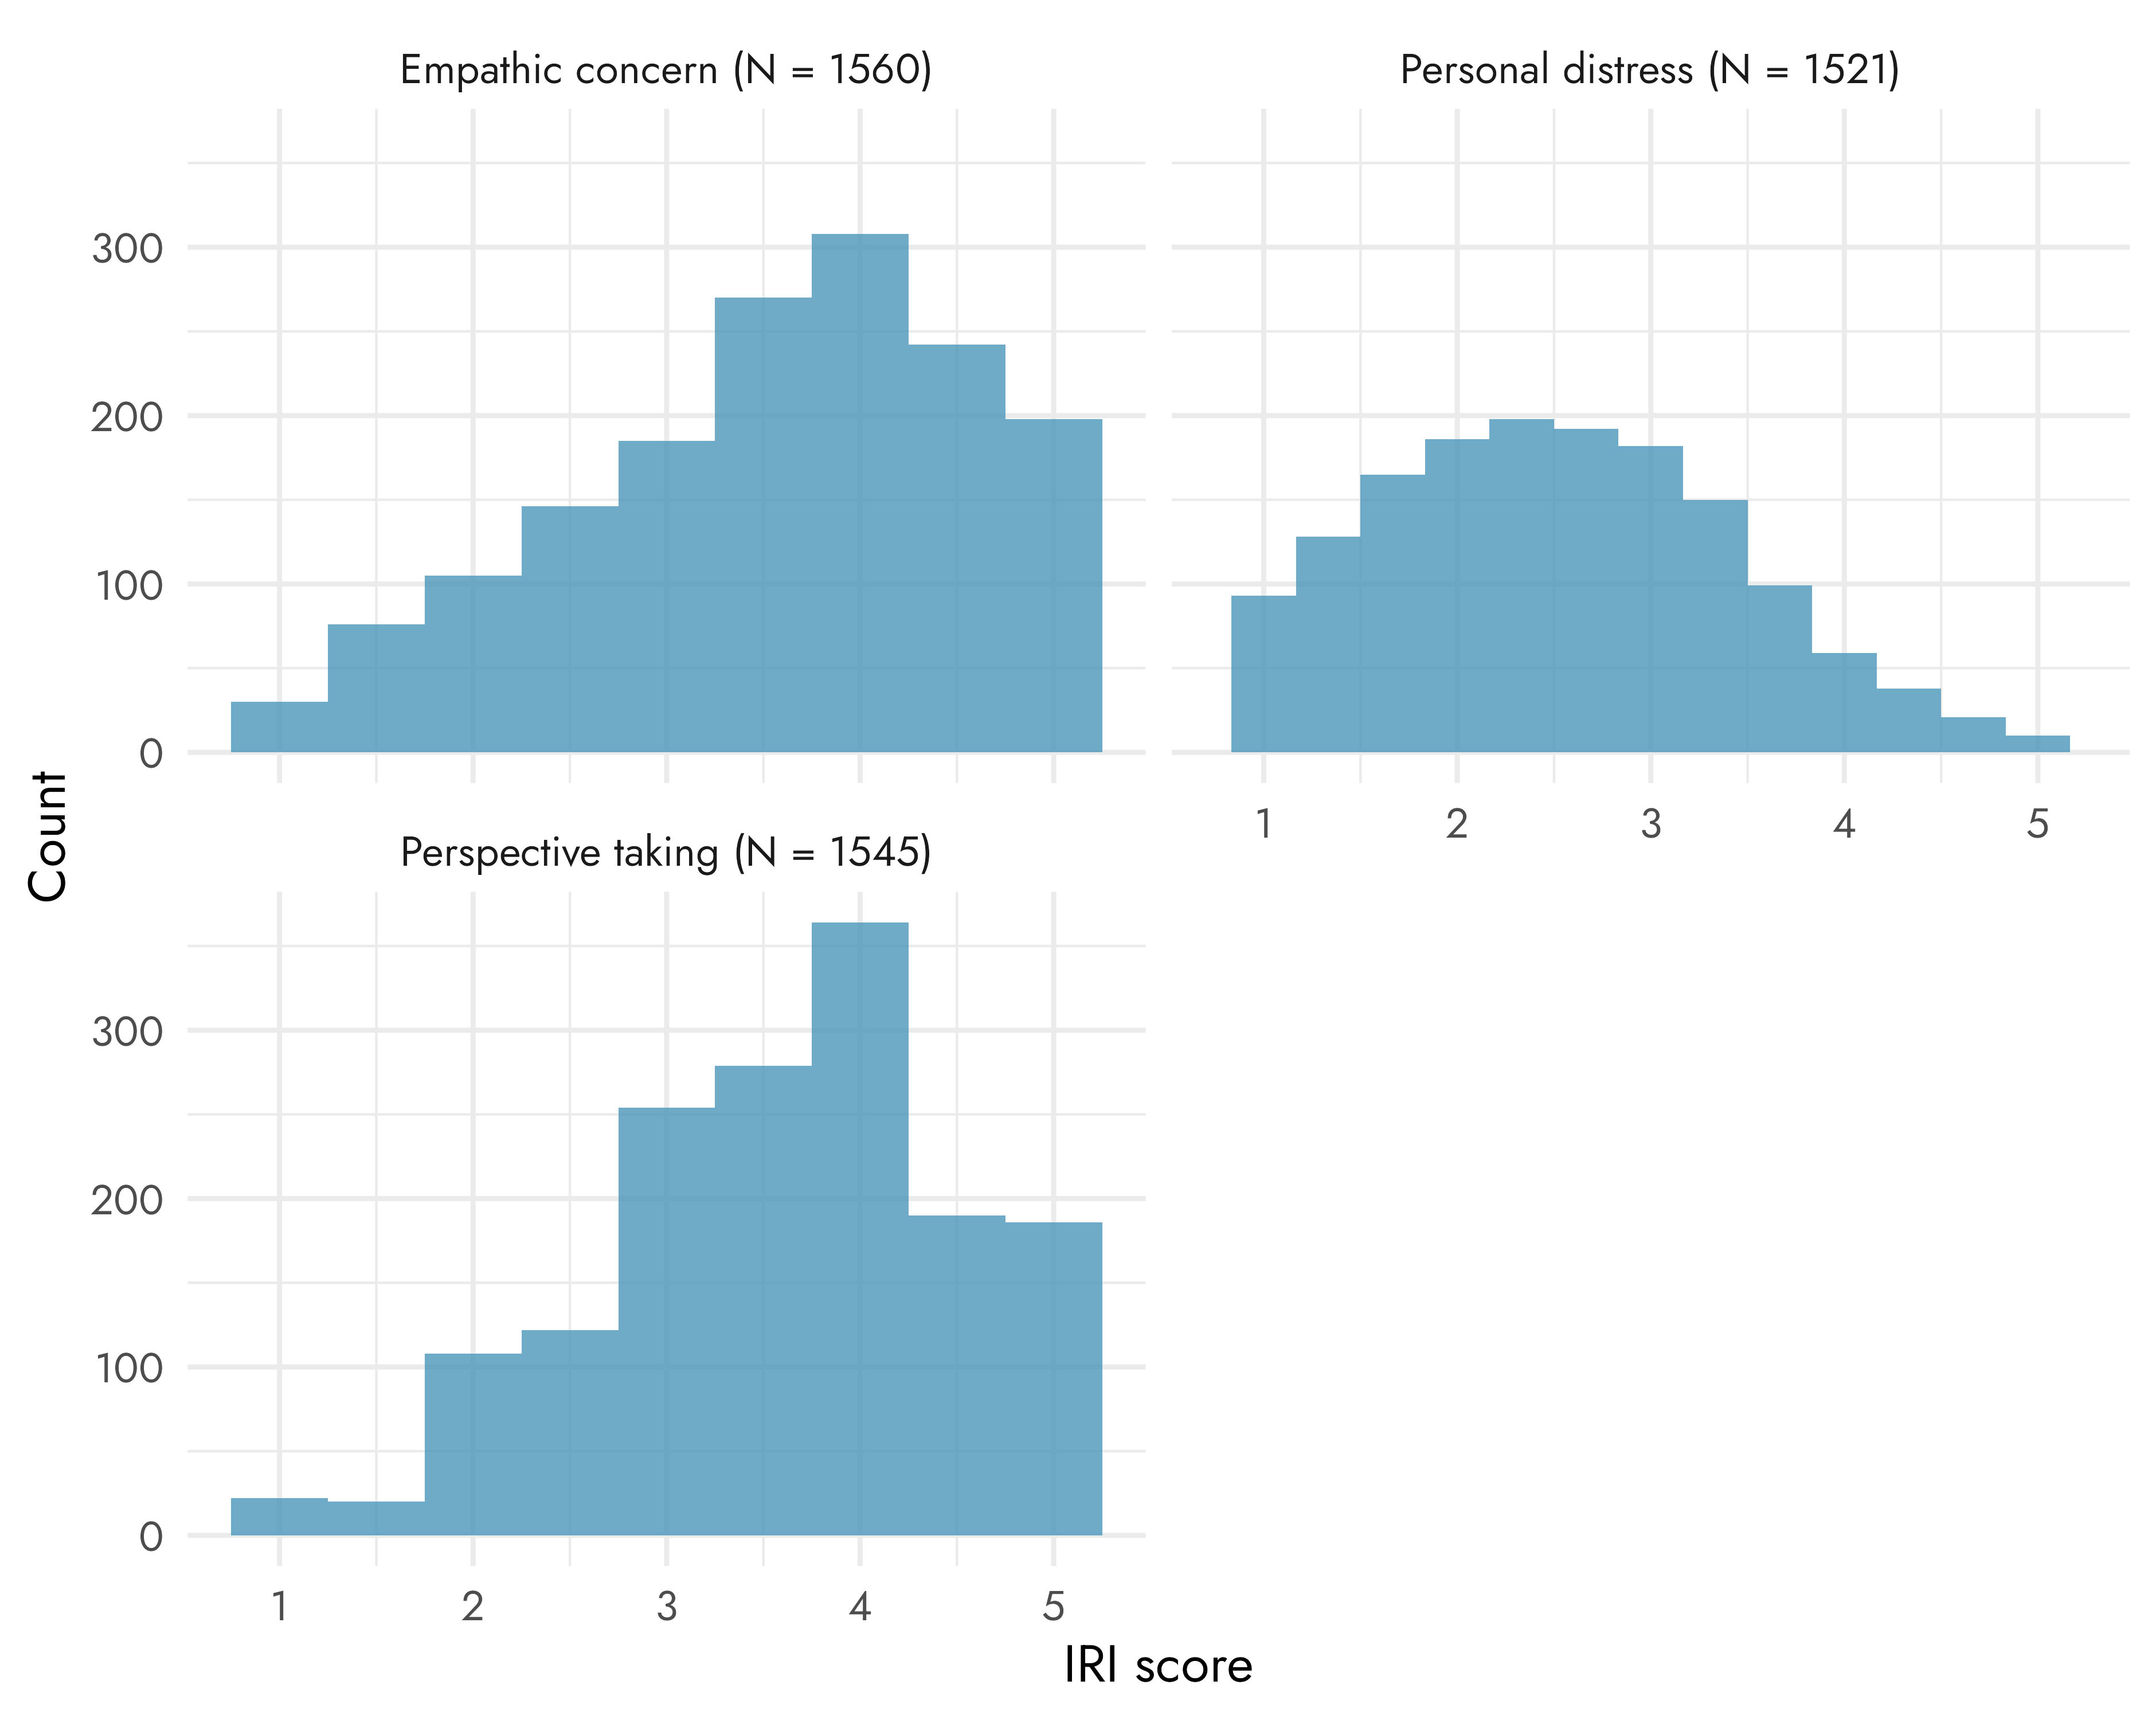
Interpersonal Reactivity Index
The Interpersonal Reactivity Index (IRI) is a measure of empathy and consists of multiple components, including ‘empathic concern’, ‘personal distress’, and ‘perspective taking’[5]. To assess these components, respondents were asked how well certain statements about their thoughts and feelings in a variety of situations describe them, using a 5-point Likert scale. The statements consisted of:
When I'm upset at someone, I usually try to "put myself in his shoes" for a while.
Before criticizing somebody, I try to imagine how I would feel if I were in their place.
IRI score distributions
Personality trait
M
SD
n
Empathic concern
3.54
1.04
1560
Personal distress
2.53
0.91
1521
Perspective taking
3.59
0.93
1545
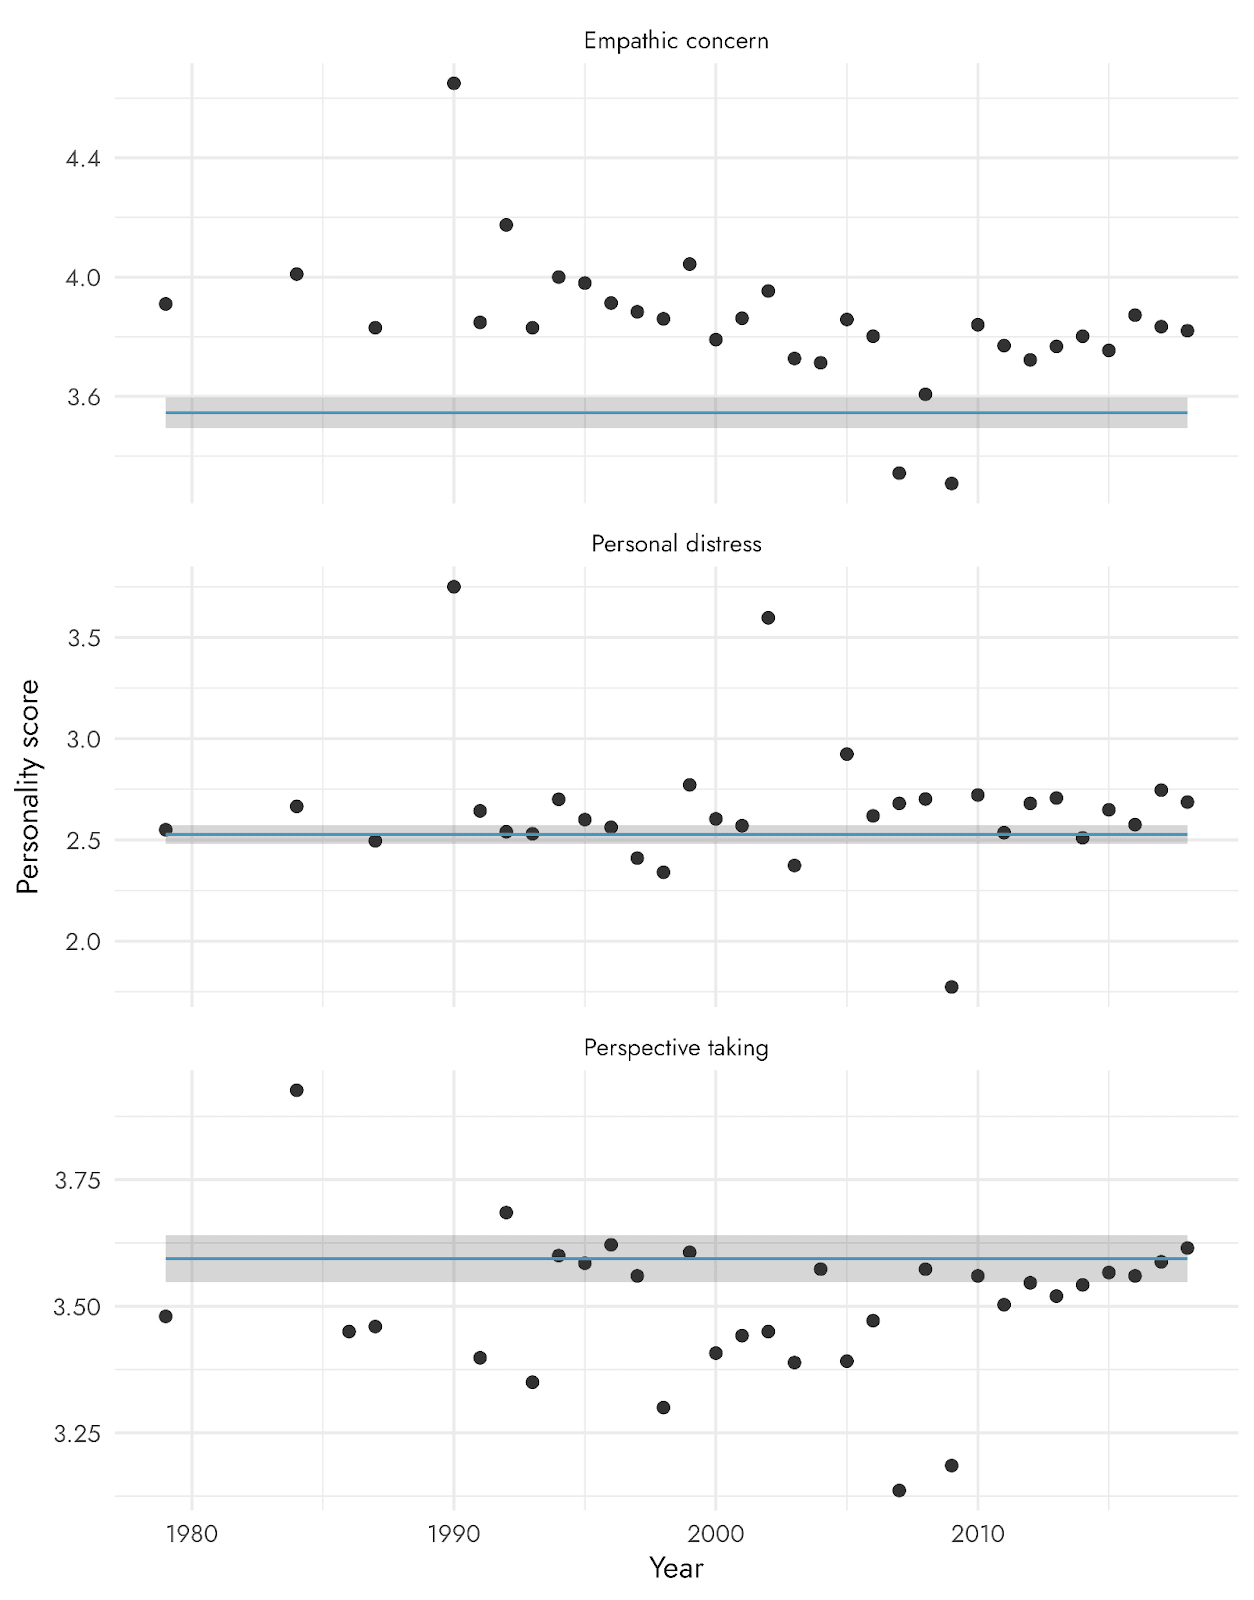
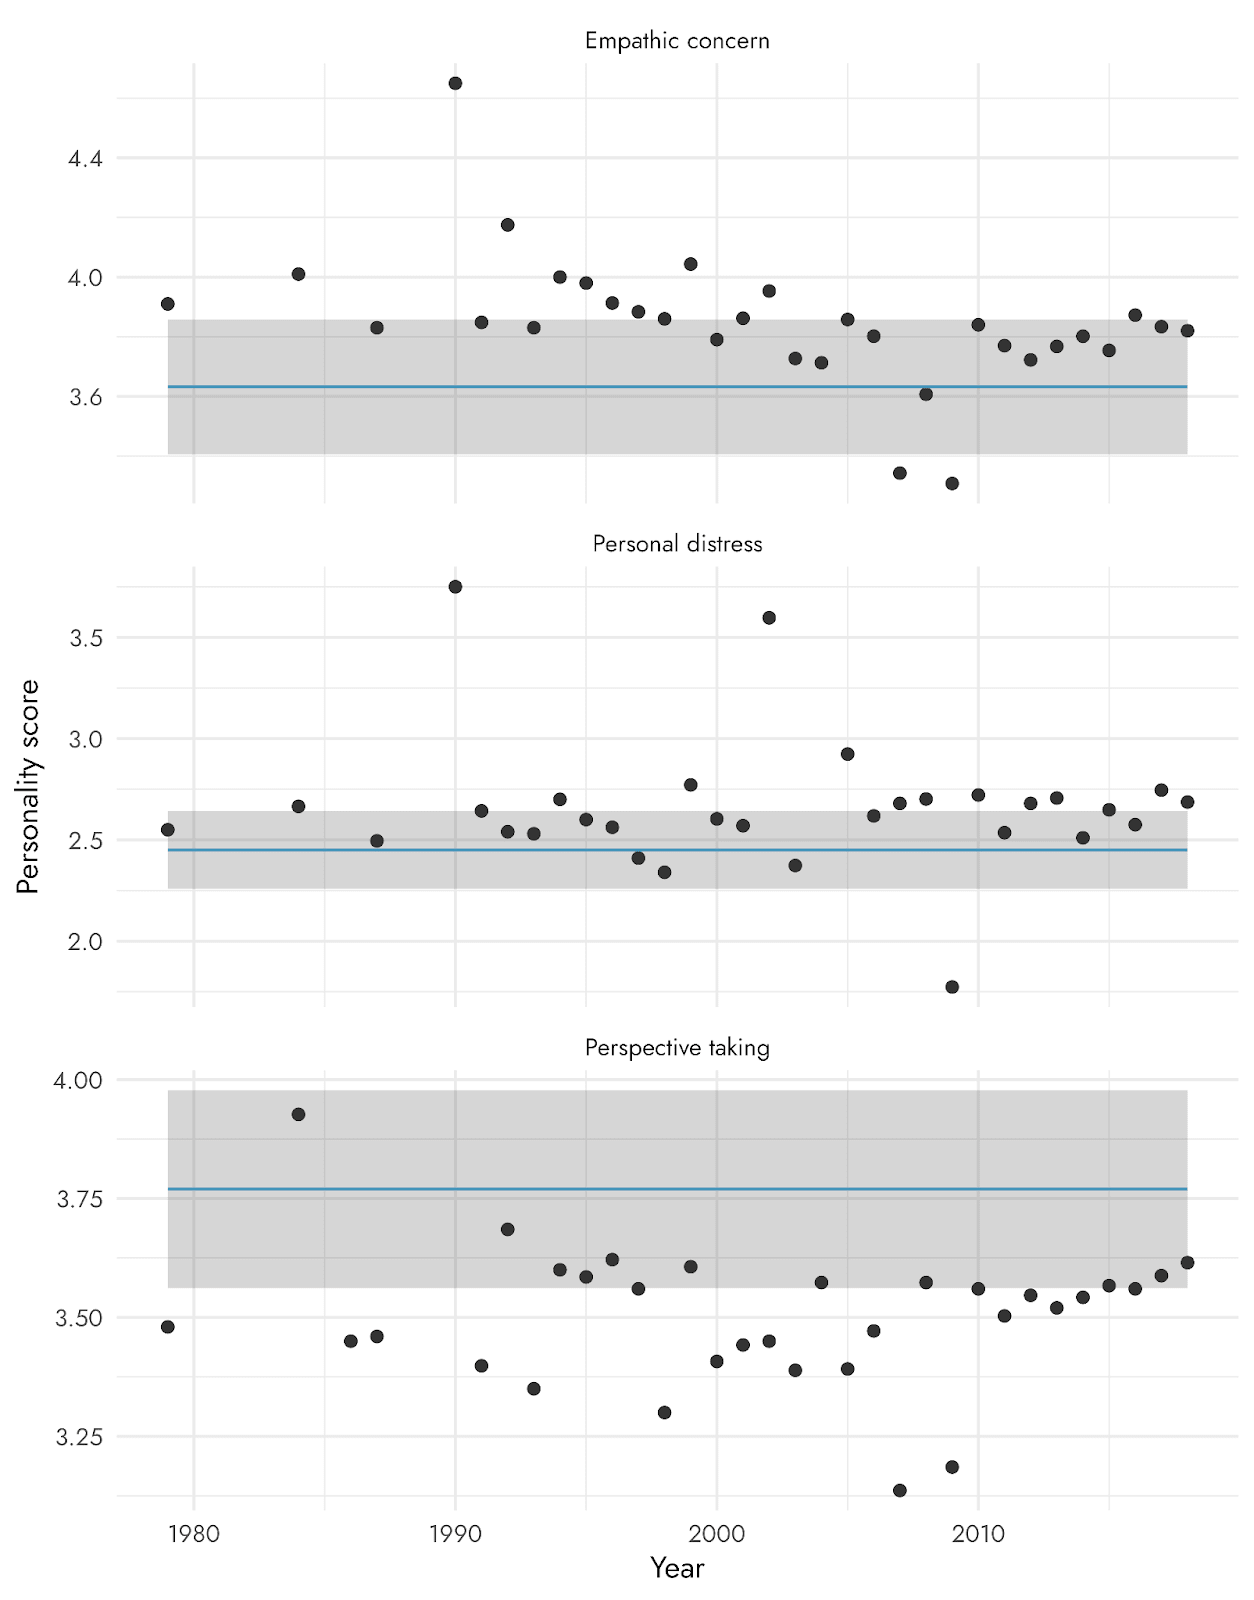
Unfortunately, we’re not aware of any recent population norms so we cannot compare our results to see whether the EA sample scores particularly low or high on any of these traits. However, there is research on dispositional empathy among U.S. undergraduates from 1979 to 2018. The graph below shows the average personality scores of the IRI across the years, with horizontal lines indicating the average scores of EAs from our survey.
Compared to these samples (U.S. undergraduates), EAs seem to show similar levels of perspective taking and personal distress, but lower levels of empathic concern. Note that here, too, the difference may be explained by demographic differences. This is particularly likely in this case because there are large trait differences on this scale between various demographics, such as gender.
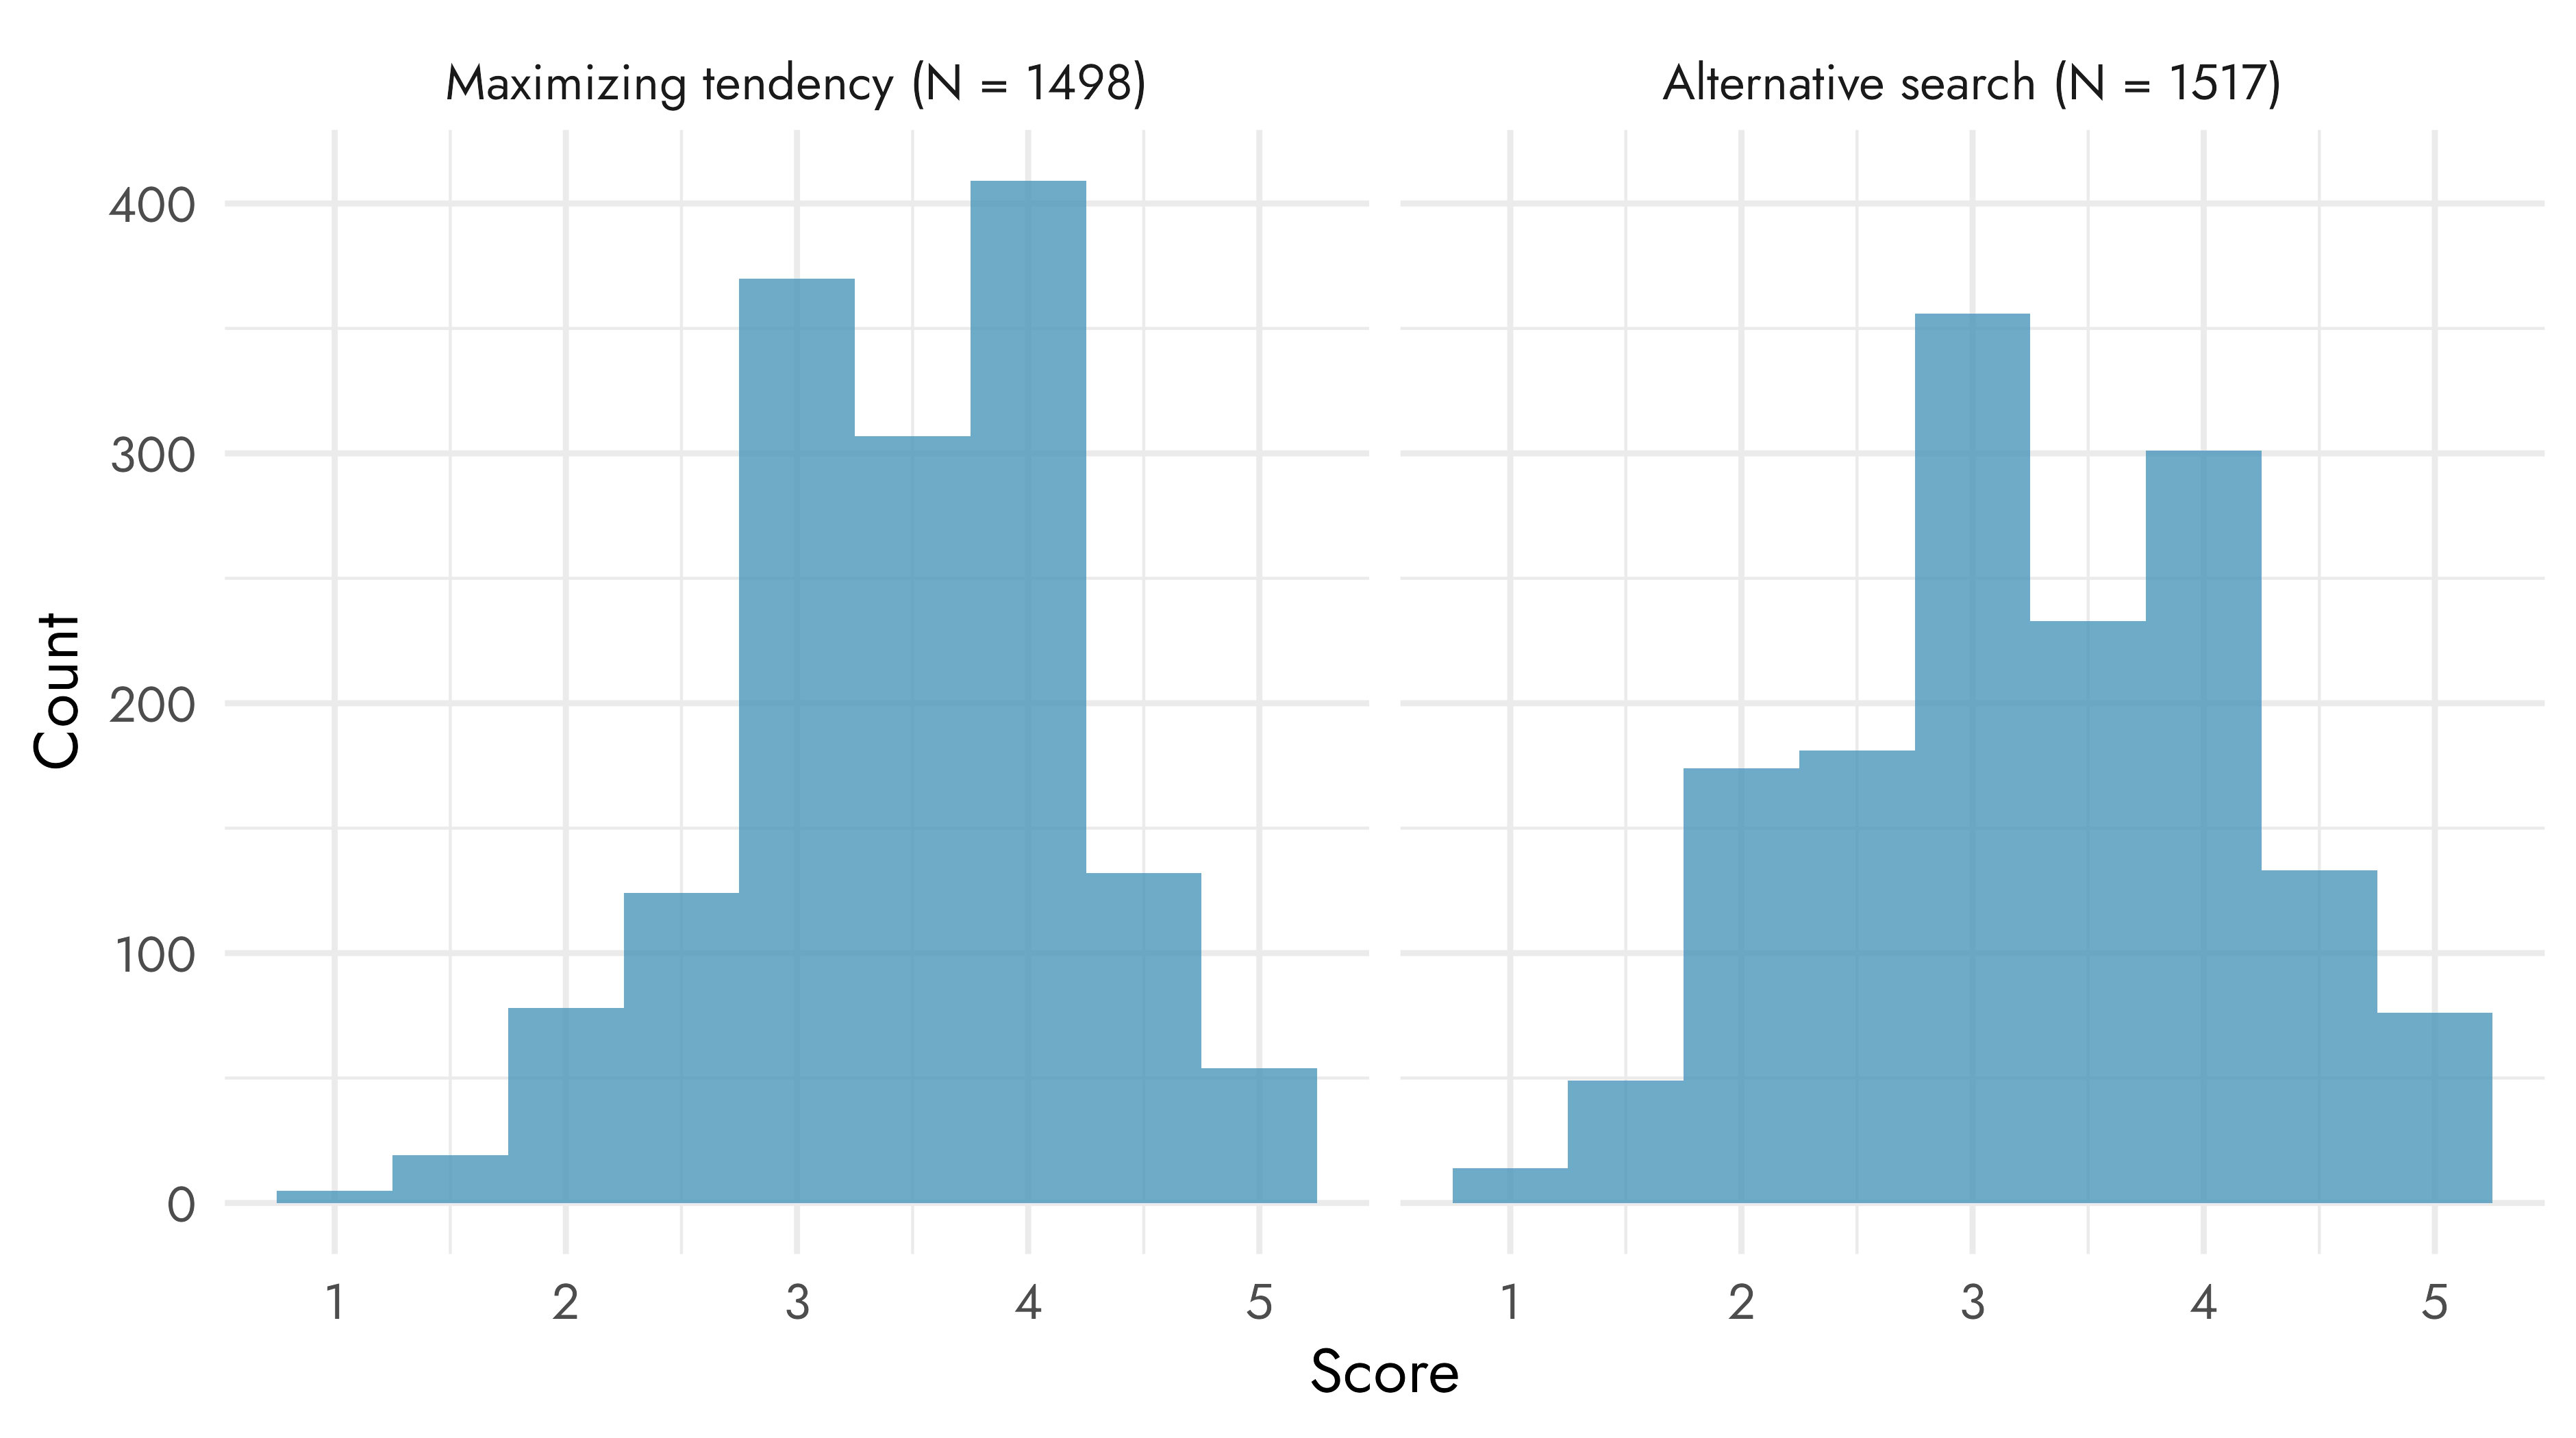
Maximization
Maximization, the tendency to want to make the best choice rather than making a choice that’s good enough (i.e., satisficing), was assessed with five items from the Maximizing Tendency Scale (MTS-7). We also assessed a maximization strategy, called alternative search, with items from the Alternative Search Scale of the Maximization Inventory. Specifically, the following items were used:
Maximization tendency:
I don’t like having to settle for good enough.
I am a maximizer.
No matter what I do, I have the highest standards for myself.
I will wait for the best option, no matter how long it takes.
No matter what it takes, I always try to choose the best thing.
Alternative search:
I can’t come to a decision unless I have carefully considered all of my options.
I take time to read the whole menu when dining out.
I find myself going to many different stores before finding the thing I want.
When shopping for something, I don’t mind spending several hours looking for it.
I take the time to consider all alternatives before making a decision.
Maximization score distributions
Personality trait
M
SD
n
Maximizing tendency
3.47
0.74
1498
Alternative search
3.26
0.89
1517
We could not find any population norms regarding the maximizing tendency trait, but we did find one study in which they report an average of 3.52 among 335 adults from the US, which is close to the average score we observed in the EA sample (3.47, 95% CI [3.43, 3.50]).
We also could not find any population norms for the alternative search trait, but we could obtain the average score using data from the paper which introduced the scale. They recruited 828 undergraduate students from Ohio State University and observed an average score of 3.18 (95% CI [3.15, 3.21]), which is slightly lower than the average score observed in the EA sample (3.26, 95% CI [3.22, 3.31]).
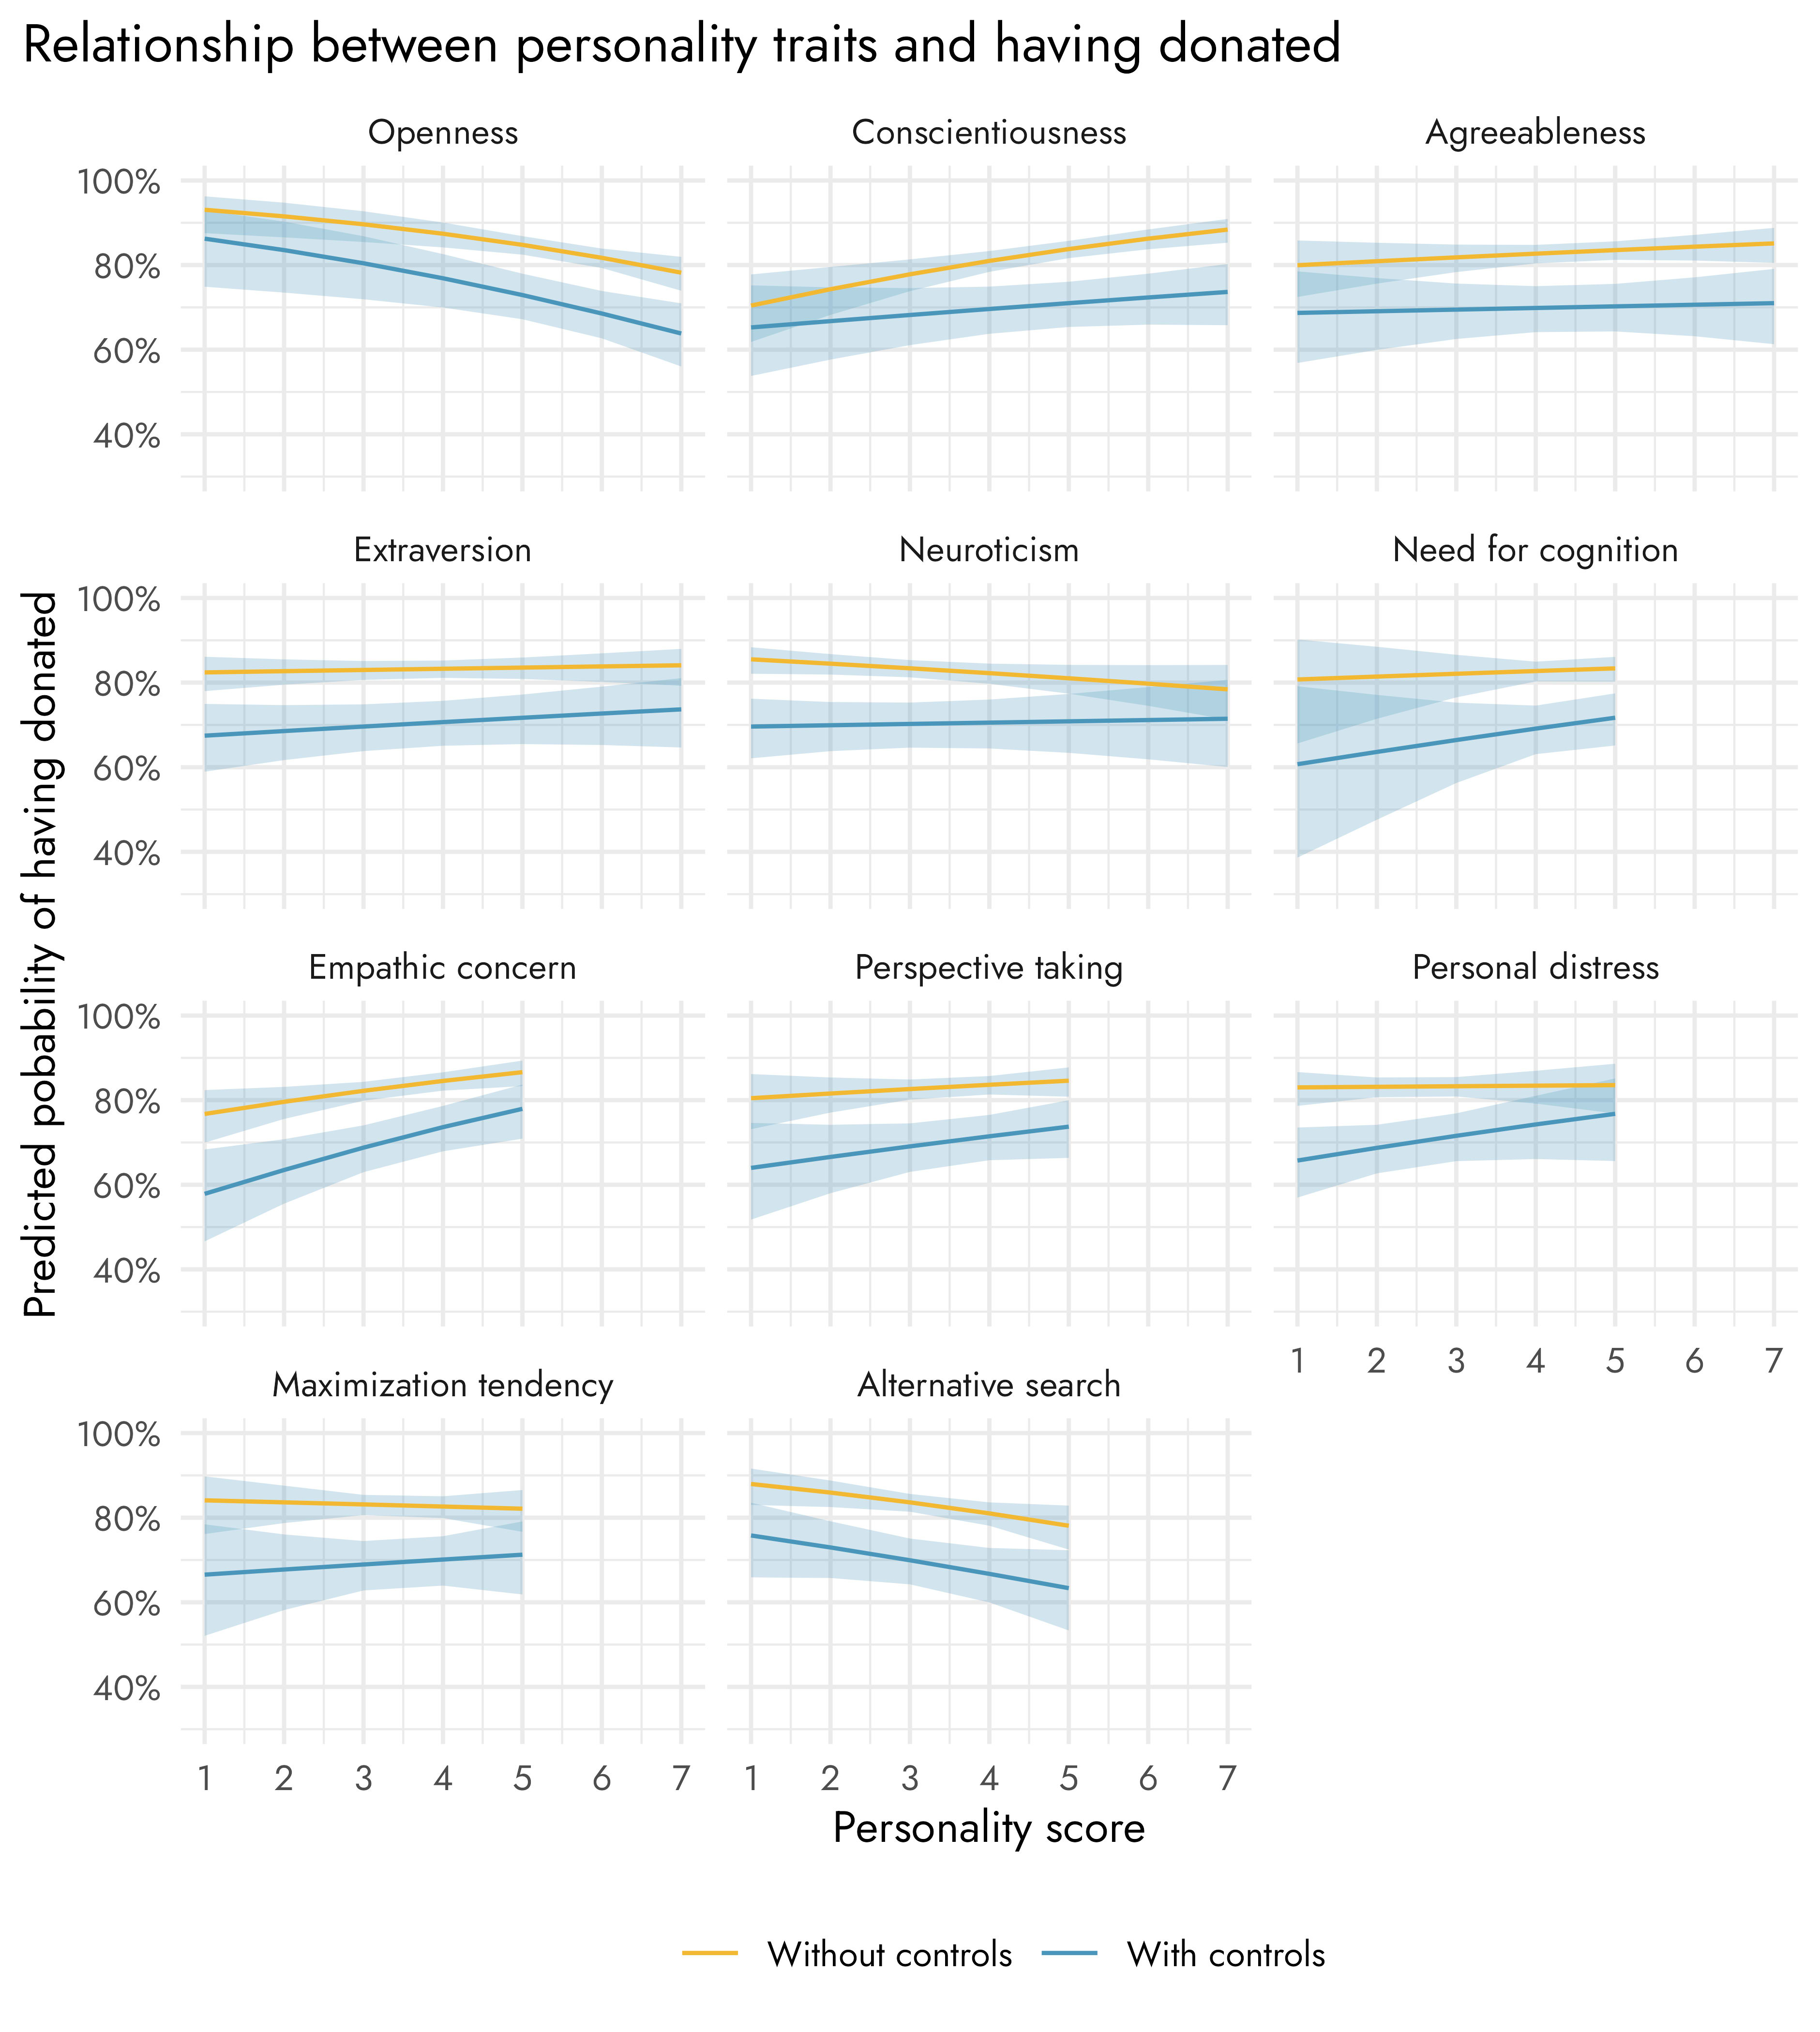
Personality traits and donations
Respondents were asked how much they had donated the year before (in 2017). We converted the donation amounts to dollars and classified respondents as having donated or not (i.e., donated more than 0 dollars or not). We then analyzed whether personality traits could ‘predict’ whether the respondent had donated or not, as well as the relationship between traits and the amount donated among respondents who had donated.
We found statistically significant relationships[6] of openness to experience and empathic concern on having donated or not. Openness to experience was negatively associated with having donated, meaning respondents with a higher score on openness to experience were less likely to have donated. In contrast, empathic concern was positively associated with having donated or not. Conscientiousness was also positively associated with having donated, and alternative search negatively, but these relationships were no longer statistically significant after controlling for individual income, gender, and age. Note that in these analyses, and the ones below, we corrected for multiple comparisons.
As for the relationship between personality traits and the size of the donations, we found that openness to experience, alternative search, and need for cognition were each negatively correlated, when controlling for age, sex and income. There were several other significant correlations, but these did not hold when controlling for age, sex, and income.
Personality traits and cause prioritization
As in any EA Survey, respondents were also asked to give an indication of how much they think each of several causes should be prioritized by EAs. We used these responses to classify respondents as having neartermist or longtermist preferences. Specifically, we calculated the average prioritization of neartermist causes (Global poverty, Mental health) and longtermist causes (Reducing risks from artificial intelligence, Existential risk (other than AI, biosecurity, or nuclear security), Biosecurity and pandemic preparedness, Nuclear security). We then subtracted the average prioritization of neartermist causes from the average of longtermist causes. Positive scores on this measure therefore indicate a prioritization of longtermist causes while negative scores indicate a prioritization of neartermist causes.
We then correlated this measure with the various personality scores and found it was negatively correlated with both empathic concern, perspective taking, and alternative search, albeit rather weakly. Several other correlations were also found, but these were not statistically significant after controlling for age and sex.
Appendix
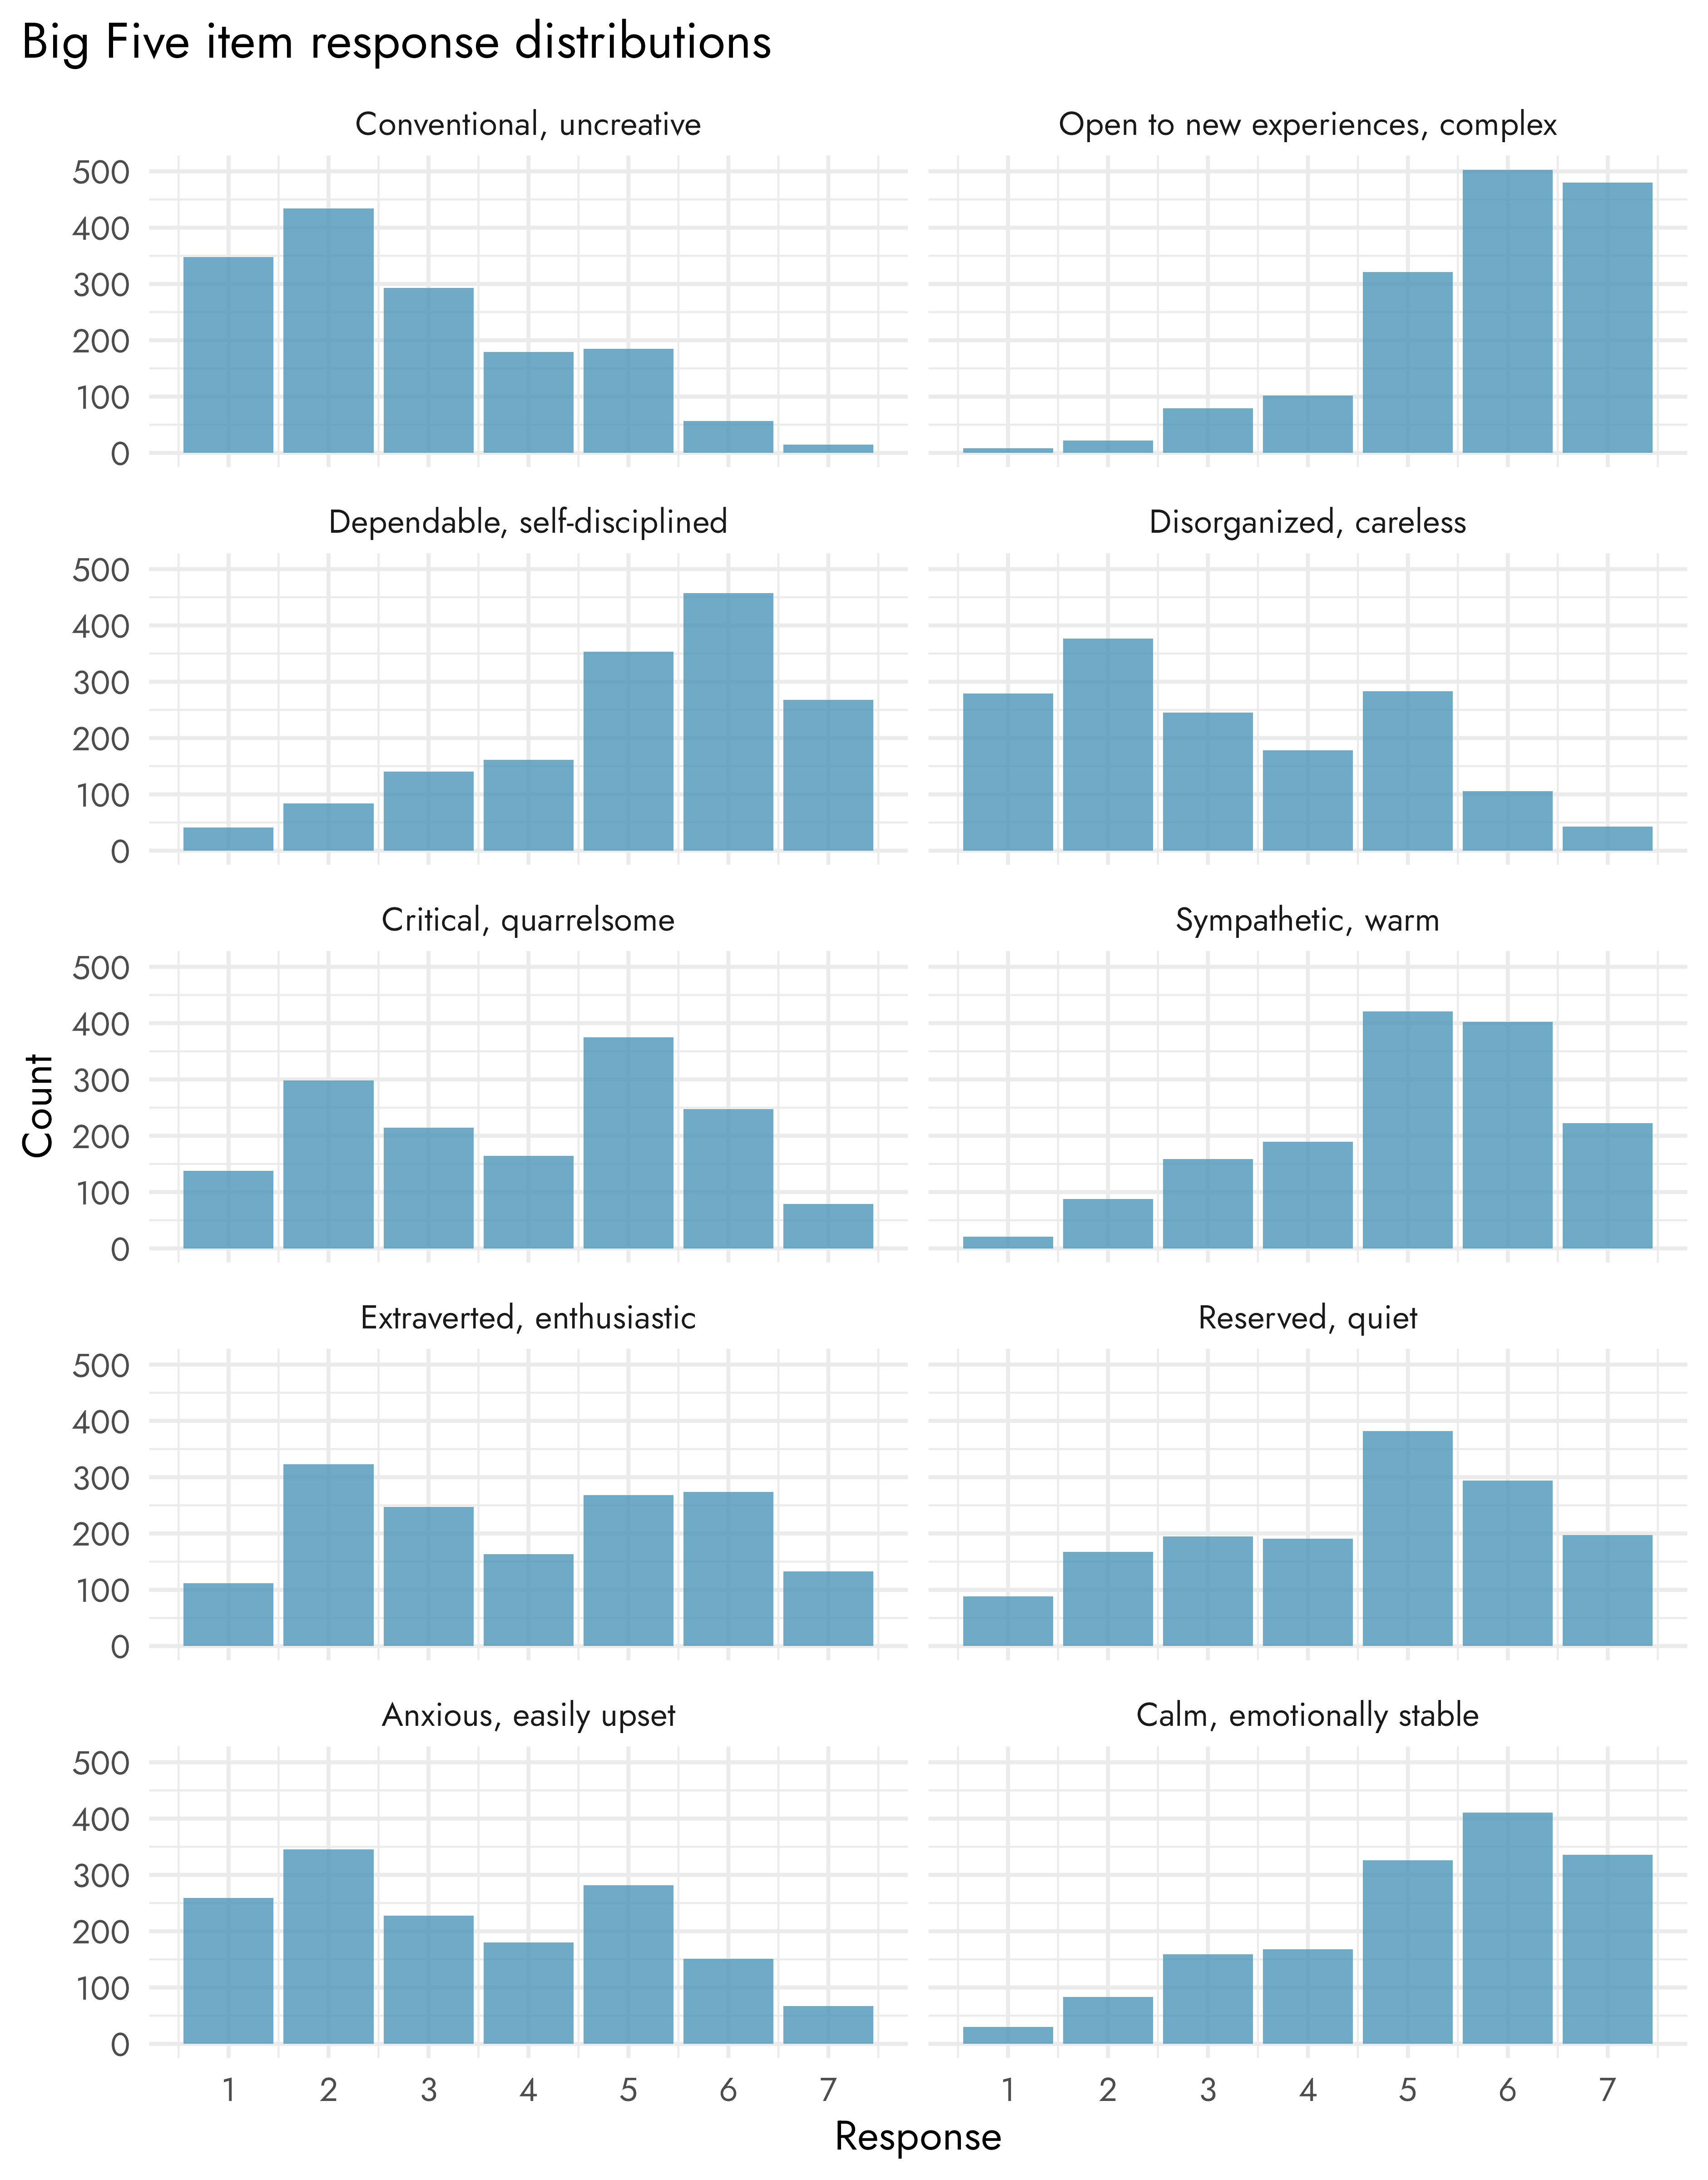
Big Five item distributions
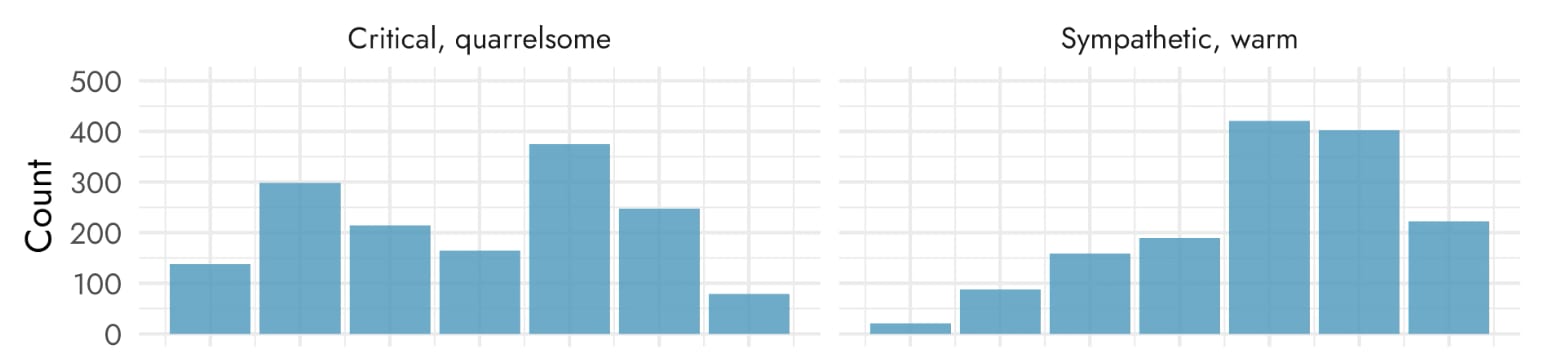
Patterns diverged for some of the individual items in the scales in ways which may be of interest.[7]
For example, EAs scored relatively highly on the Agreeableness item ‘Sympathetic, warm’, but responses were more mixed for the reversed item ‘Critical, quarrelsome’ with a large number of EAs tending to agree with this item. This seems to match common impressions of the EA community.
Alternative IRI comparison
In the main text we compared the IRI scores of the full EA sample to the scores of U.S. undergraduates from 1979 to 2018. Below we compare the scores of U.S. undergraduates to the scores of EA respondents from the United States who are currently a full or part time student pursuing an undergraduate degree. This also shows relatively low empathic concern scores and similar personal distress scores, but higher perspective taking scores. Note, however, that the confidence intervals are quite wide on this much smaller sample and are likely to be susceptible to additional differences between the samples (e.g., gender).
Acknowledgments
This research is a project of Rethink Priorities. It was written by Willem Sleegers and David Moss. Thanks to Oscar Delaney for helpful feedback. If you like our work, please consider subscribing to our newsletter. You can explore our completed public work here.
It is worth noting that associations within EA data may be attenuated by range restriction, i.e. the EA sample may be limited to people who are relatively high in the relevant predictors or outcomes.
The TIPI measures ‘Emotional Stability’, which is Neuroticism scored in reverse. We code this as Neuroticism to facilitate comparison with the AE results.
AE Studio compared mean personality scores between their sample and the sample in Mastrascusa et al. (2023), but the latter appears to only include a sample of people from Brazil, not a more general public.
We use an alpha of 0.05 to determine whether a relationship is statistically significant. In the case of multiple comparisons, we apply a Holm correction to the p-values to control the family-wise error rate.


How many of these findings are likely to be of practical (as opposed to statistical) significance? (I'm looking mostly at the 21-30 group and to a lesser extent at the 31-40 group given EA demographics and the relatedly low number of 40+ respondents.)
It's been a long time since I was a graduate student, but it looks like most of the differences are +/- 0.25 points on a seven-point scale even before we consider the error bars. In other words, it seems that the differences we can be statistically confident in are significantly less than .25 in almost all cases. Is a difference of .1 or .25 on a seven-point scale likely to be substantively meaningful?
Likewise, most of the correlations between traits and donation were .03 or less and not statistically significant. But then again, I vaguely recall that correlations can be fairly low and still meaningful when one of the variables is binary?
The exception looks to be lower rates of male neuroticism, which seems more likely to be of practical significance.
To add some specifics to my earlier comment, if we look at the confidence intervals for the effect sizes in terms of cohen's d (visualizer), we see that:
Interpreting effect sizes is, of course, not straightforward. The conventional standards are somewhat arbitrary, and it's quite widely agreed that the classic cohen's d benchmarks for small/medium/large effect sizes are quite conservative (the average effect size in psychology is no more than d=0.3). This empirically generated set of benchmarks (if you convert r into d), would suggest that around 0.2 is small and 0.4 is medium. But whether a particular effect size is practically meaningful varies depending on the context. For example, a small effect may make very little difference at the individual level, but make large differences at the aggregate level / in the long-run.
In my personal view, very few or none, if you are looking at the association between personality and outcomes. As we note the associations between personality, donation behavior and cause prioritization were "only small". I think that in itself is an important finding, since some people would expect large influences on things like donation or cause prioritisation.
If you're talking about the differences in personality between EAs and the general population, I think these are potentially more practically significant (for example, if you're considering things like influences on outreach / recruitment, or the influence of these differences on the kinds of people EA attracts). Here even small differences could be significant in a non-linear way (for example, if EA is disproportionately appealing to people who are very high in need for cognition, or similar traits, this could have a big effect). Some of these apparent differences between EA and the general population are not obviously small, though the level of confidence we can have for the analyses where we can benchmark to population levels at both the gender and age level (i.e. big 5) do not give us clarity about what the exact magnitude of the differences are. Even with 1600 respondents, the sample size is not so large when you are accounting for age and gender in this way (and we argue that you do need to do this in this case for the results to be interpretable).
I think this is also notable, whatever the effect size, because people have often predicted a directionally opposite result.
I had never thought about it, but I can see some features of the intellectual and practical ecosystem that would select against people with higher neuroticism (at least to the extent it manifested as anxiety and certain other dimensions):
So I wonder if the [edit: people who predicted high neuroticism] are conflating EA's pressures can cause neurotic symptoms with EA attracts relatively more people with neurotic temperaments. My rough (and extreme) analogy might be air-traffic controllers; the work seems very likely to cause anxiety and some other negative emotional states. At the same time, people who are higher in neuroticism may be more likely to choose another career (or be screened out by psychological testing).
Unfortunately, to test these hypotheses, one would probably need to sample an appropriate non-EA population and correlate certain attitudes toward generalized openness to the EA way of thought.
My default assumption would be that we're measuring trait-neuroticism rather than just temporary, locally caused anxiety. That's partly because personality traits are relatively stable, but also because I'd be surprised if EA were having a large effect on people's tendency to describe themselves as being "anxious, easily upset" etc. (and that doesn't seem to be the case in our results on the effect of EA on mental health). Of course, it's also worth noting that our results in this study tended towards lower neuroticism for EAs.
I do think that whether the results are driven more by EA selecting for people who are higher in emotional stability at the outset, or whether the community is losing people with higher trait-neuroticism, is a significant question however. I agree that we couldn't empirically tackle this without further data, such as by measuring personality across years and tracking dropout.
Sorry, by predictors I had meant "people who had predicted you would find higher levels of neuroticism," not your survey questions. Edited my comment to clarify.