The moral value of voting is a perennial topic in EA. This piece shows that in any election that isn't a forgone conclusion, the chance of your vote being decisive can't be much lower than 1 in the number of voters. So voting will be worth it around the point where the value your preferred candidate would bring to the average citizen exceeds the cost of you voting.
What is the chance your vote changes the outcome of an election? We know it is low, but how low?
In particular, how does it compare with an intuitive baseline of a 1 in n chance, where n is the number of voters? This baseline is an important landmark not only because it is so intuitive, but because it is roughly the threshold needed for voting to be justified in terms of the good it produces for the members of the community (since the total benefit is also going to be proportional to n).
Some political scientists have tried to estimate it with simplified theoretical models involving random voting. Depending on their assumptions, this has suggested it is much higher than the baseline — roughly 1 in the square root of n (Banzhaf 1965) — or that it is extraordinarily lower — something like 1 in 10^2659 for a US presidential election (Brennan 2011).
Statisticians have attempted to determine the chance of a vote being decisive for particular elections using detailed empirical modelling, with data from previous elections and contemporaneous polls. For example, Gelman et al (2010) use such a model to estimate that an average voter had a 1 in 60 million chance of changing the result of the 2008 US presidential election, which is about 3 times higher than the baseline.
In contrast, I’ll give a simple method that depends on almost no assumptions or data, and provides a floor for how low this probability can be. It will calculate this using just two inputs: the number of voters, n, and the probability of the underdog winning, p_u.
The method works for any two-candidate election that uses simple majority. So it wouldn’t work for the US presidential election, but would work for your chance of being decisive within your state, and could be combined with estimates that state is decisive nationally. It also applies for many minor ‘elections’ you may encounter, such as the chance of your vote being decisive on a committee.
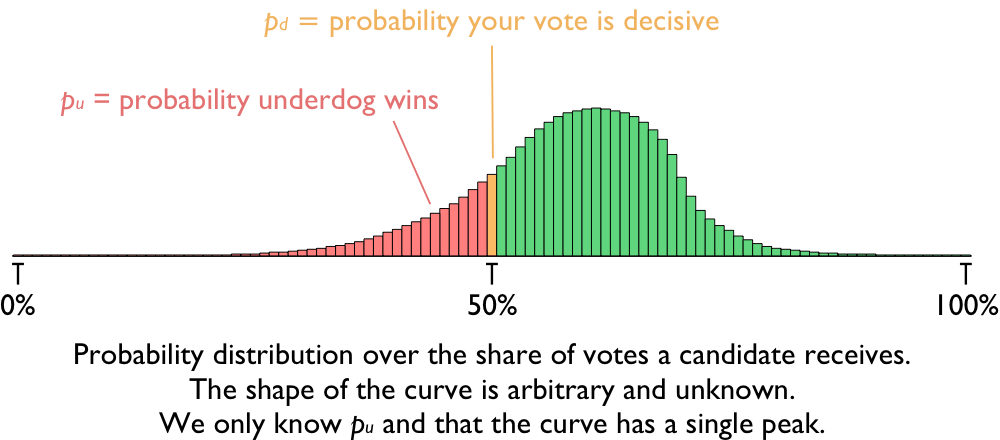
We start by considering a probability distribution over what share of the vote a candidate will get, from 0% to 100%. In theory, this distribution could have any shape, but in practice it will almost always have a single peak (which could be at one end, or somewhere in between). We will assume that the probability distribution over vote share has this shape (that it is ‘unimodal’) and this is the only substantive assumption we’ll make.
We will treat this as the probability distribution of the votes a candidate gets before factoring in your own vote. If there is an even number of votes (before yours) then your vote matters only if the vote shares are tied. In that case, which way you vote decides the election. If there is an odd number of votes (before yours), it is a little more complex, but works out about the same: Before your vote, one candidate has one fewer vote. Your vote decides whether they lose or tie, so is worth half an election. But because there are two different ways the candidates could be one vote apart (candidate A has one fewer or candidate B has one fewer), you are about twice as likely to end up in this situation, so have the same expected impact. For ease of presentation I’ll assume there is an even number of voters other than you, but nothing turns on this.
(In real elections, you may also have to worry about probabilistic recounts, but if you do the analysis, these don’t substantively change anything as there is now a large range of vote shares within which your vote improves the probability that your candidate secures a recount, wins a recount, or avoids a recount (Gelman et al 2002, p 674).)
So we are considering a unimodal probability distribution over the share of the vote a candidate will get and we are asking what is the chance that the share is exactly 50% (with an even number of voters). This corresponds to asking what is the height of the distribution in the very centre. Our parameters will be:
n — the number of voters (other than you).
p_u — the probability that the underdog would win (without you voting).
p_d — the probability that your vote is decisive.
Our job is to characterise p_d in terms of the inputs n and p_u. It is impossible to determine it precisely, but it is surprisingly easy to produce a useful lower bound.
The key observation is that as the distribution has a single mode, there must be at least one side of the distribution that doesn’t have the mode on it. That side is monotonically increasing (or at least non-decreasing) as one proceeds from the outside towards the centre. How low could the centre be? Well the entire non-decreasing side either has probability p_u or (1 – p_u), so the minimum probability it could have is p_u. And the way of spreading it out that would lead to the lowest value in the centre is if it were uniformly distributed over that side (over the n/2 outcomes ranging from the candidate getting all the vote through to getting just over half).
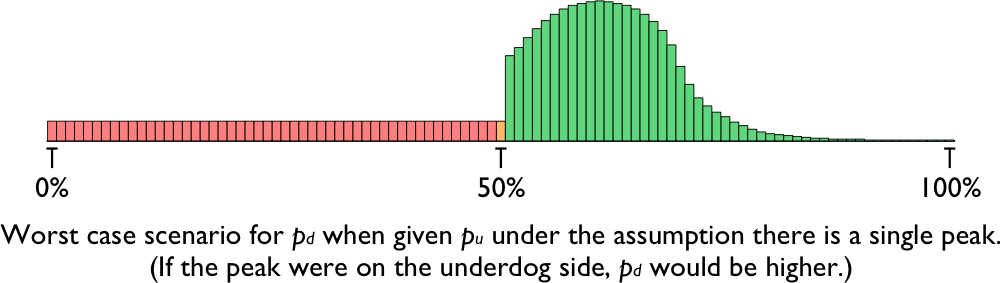
In this case, the probability in the exact centre (i.e. the probability of a decisive vote) must be at least p_u ÷ n/2. In other words:
pd≥2pun
This is highest when the candidates have equal chances (p_u ≈ 50%). Then the lower bound for having a decisive vote is simply 1/n — the intuitive baseline. The bound decreases linearly as the underdog’s chances decrease. So for example, if the underdog has a 10% chance, the bound for a decisive vote is 1/5n, and if they have a 1% chance, it is 1/50n.
So for simple elections that are not completely forgone conclusions, the chance of having a decisive vote can’t be all that much lower than 1/n.
What does probability mean here?
This analysis works for several kinds of probability, so long as the probability of the underdog winning and the probability of your vote being decisive are of the same type. So if you have a 10% degree of belief that the underdog will win, you are rationally required to have at least a 1/5n degree of belief that your vote will be decisive. And if the best informed and calibrated political models assign a 10% chance to the underdog winning, then they also need to assign at least a 1/5n chance to your vote being decisive.
What if a larger majority is required?
The earlier analysis generalises very easily. Now instead of estimating the height of the distribution at the centre, we do so it at the supermajority point (e.g. 2/3). The worst case is when the non-decreasing side is also the longer side, so the probability gets spread thinner across these possibilities, giving:
pd≥punm
where m is the size of the majority needed (i.e. a simple majority has m = 1/2, a two-thirds majority has m = 2/3).
Can we relax the assumption that the distribution is unimodal?
Our only use of this assumption was to prove that there was a side of the distribution with no mode on it. So we could replace the assumption with that weaker claim.
It wouldn’t matter if there were multiple modes, so long as they are all on the same side of the distribution. The problem with multiple modes is that there could be one on either side, with almost all the probability mass gathered near them, and a negligible amount in between at the centre. But this seems very implausible as a credence distribution in advance of an election. And even if somehow your beliefs were that it was probably going to be a landslide one way or the other, you can sometimes still apply this bound:
e.g. Suppose your credences were a mixture of (1) a very skewed unimodal distribution with 95% chance of candidate A winning and (2) another such distribution with 95% chance of candidate B winning. That would still just be the same chance of being decisive as in an election where the underdog has a 5% chance of winning (after all, you can see this as being certain the underdog has a 5% chance, you just don’t know which candidate is the underdog), and that would still leave you with a 1/10n chance of having the decisive vote.
Multi-level elections?
Many elections proceed in two stages, with individual voters electing representatives for their constituency or state, and then those representatives having their own election (e.g. for the right to appoint the president or prime minister). If each constituency has equal voting power in the higher level election, then one can simply apply my model twice.
e.g. if there are n_1 people in your constituency and a 25% chance of the local underdog winning it, then you have at least a 1/2n_1 chance of determining your constituency’s representative. If there are n_2 constituencies in the nation with a 10% chance of the national underdog winning a majority of them (conditional upon your own constituency being tied), then there is at least a 1/5n_2 chance of your constituency being nationally decisive. The chance your vote is nationally decisive is then the product of these: 1/(10 n_1 n_2).
In general, the formula is just:
pd≥2pu1n1×2pu2n2=4pu1pu2n1n2
If the constituencies are roughly equally sized, then n_1 × n_2 ≈ n, so for a competitive election and a competitive electorate, the chance of being decisive is still not much worse than the baseline of 1/n.
Note that because this involves applying a conservative lower bound twice in succession, it will tend to give probabilities that are a bit lower than if it were a simple one-level election. This may just be due to the conservativeness of focusing on worst case scenarios rather than suggesting that the two level structure actually lowers the chance of having a decisive vote.
If constituencies have different voting power (as in the US electoral college) or if some have incumbents whose seats aren’t up for re-election (as in the US senate) there are additional complications and you may want to turn to a specific model crafted for that election.
Comparisons with other work
The most prominent theoretical model for the probability of a decisive vote is the random voting model. It assumes that all other voters vote randomly, voting for candidate A with a probability p_A, which must be exactly the same for all voters. This is the background for Banzhaf’s (1965) result that p_D is roughly 1 in the square root of n — which is what you get if you also add the assumption that p_A = 50% precisely. And it is the background for Brennan’s (2011) result that p_D is something like 1 in 10^2,659 — which is what you get in an election the size of the 2004 US presidential election if you assume that p_A is a plausible sounding vote share for a close election, such as 50.5%.
This is a remarkable discrepancy between two uses of the same model. It happens because the model produces a vote-share distribution with an extremely tall and narrow peak — especially for large elections. For a presidential sized election, it would be about 1,000 times taller and 1,000 times narrower than in my illustrative diagrams. Banzhaf configured this model to have the peak lining up exactly at the 50-50 split, leading to a very high estimate for a decisive vote. Brennan nudged the peak a small distance from the centre, but the peak is so slender that the curve’s height at the centre becomes microscopic.
Both versions are known to give poor estimates for the chance of a decisive vote. Banzhaf’s has been shown to be too high on empirical grounds (Gelman et al 2004). Brennan’s has been thoroughly embarrassed by the evidence: events his model said wouldn’t happen in the lifetime of the universe have already happened. For example, in 1985 control of the upper house for my home state of Victoria (Australia) with 2,461,708 voters came down to a single vote: any additional vote in Nunawading Provence would have determined the whole election in that party’s favour.
There are a number of flaws in the random voter model that cause such inaccurate predictions. A key one is that assumptions its practitioners are making determine where the peak goes, which directly determines whether the chance of a decisive vote is large or miniscule. Effectively Brennan is just assuming it is a close, but non-tied, election and saying that conditional on this there is very little chance it is tied. That obviously begs the question. If we slightly tweak the model to allow uncertainty about where the peak is (e.g. somewhere from 40% to 60%), then the dramatic results go away and you would get something in the vicinity of 1/n. But then it is even better to avoid all need of the problematic modelling assumptions and directly use this probability distribution over vote share — or even just the simple probability that the underdog wins, as we’ve done in this piece.
I first developed this model in 2016 in the lead-up to the US presidential election, and wrote a near-final version of this essay explaining it in the wake of the 2020 election. I subsequently came across a superb paper by Zach Barnett (2020) that makes many of the same points (and more). Barnett’s paper is aimed at the broader conclusion that the expected moral value of voting often exceeds the costs to the voter, providing a moral case for voting along the lines that Parfit (1984) had advanced. As part of this, he too needed to bound the probability that one’s vote is decisive. His model for doing so was strikingly similar to mine (and we were both excited to discover the independent convergence). The key differences are:
- Instead of making the probability a function of the underdog’s chance of winning, he makes the modelling assumption that the underdog will have a >10% chance of winning.
- He makes an additional assumption that it is more likely the underdog wins by less than 10 points than that they win by more than 10 points.
By making these slightly stronger assumptions, he is able to reach a slightly stronger lower bound, which helps make the moral case for voting. Which one to use is something of a matter of taste (do you prefer unassailable assumptions or stronger conclusions?) and partly a matter of purpose: Barnett’s approach might be better for arguing that it is generally worth voting and mine for understanding the chance of a decisive vote itself.
References
J. R. Banzhaf, 1965, ‘Weighted Voting Doesn’t Work: A Mathematical Analysis’, Rutgers Law Review, 19 (1965), 317–43.
Zach Barnett, 2020, ‘Why you should vote to change the outcome’, Philosophy and Public Affairs, 48:422–446.
Jason Brennan, 2011, The Ethics of Voting (Princeton: Princeton University Press), 18–20.
Andrew Gelman, Jonathan N. Katz and Josef Bafumi, 2002, ‘Standard Voting Power Indexes Do Not Work: An Empirical Analysis’, B. J. Pol. Sci 34:657–674.
Andrew Gelman, Nate Silver and Aaron Edlin, 2010. ‘What is the probability your vote will make a difference?’, Economic Inquiry 50:321–326.
Derek Parfit, 1984, Reasons and Persons (Oxford: Oxford University Press), 73–74.

A caution re interpreting of my argument in two-level elections:
One might read the above piece as an argument that voting is generally worthwhile. But note that the two-level structure of many elections (at least in countries without PR) does dampen the value of voting for many voters. e.g. if you are in the 10%+ of the US population who live in California, then not only are you very unlikely to cast a decisive vote to win the state's electoral college votes (since the probability that the underdog wins is very low), but it is very likely that in the situation where California comes down to a single vote, the rest of the country has skewed overwhelmingly to the Republicans, making the Californian electoral college votes irrelevant. Similar situations hold for safe seats in the lower house in the US, UK or Australia.
It might still be that in some sense two-level elections function on average like a single level election, but even if so, that could be because there are some people in marginal seats/states with disproportionate chances of changing the outcome, while many or most people have very little.
So while my adjusted formula above does apply in two-level elections, the intuitive interpretation that it supports a moral case for voting for the superior candidate may not apply.