Comments
Main Takeaways
Top Findings:
- Pro forecasters beat bots but without significance: Our team of 10 Metaculus Pro Forecasters outperformed the top-10 bot team by an average of 1.25 head-to-head points per question. But this edge is small relative to the question-to-question variation and not statistically significant (one-sided p = 0.247), so this sample doesn't give us enough evidence to confirm Pros were genuinely ahead this season.
- The bot team improved notably in the last year: The bot team’s head-to-head score against Pros was -11.3 in Q3 2024 (95% CI: [-21.8, -0.7]), -8.9 in Q4 2024 (95% CI: [-18.8, 1]), -17.7 in Q1 2025 (95% CI: [-28.3, -7.0]), and then -20.03 in Q2 2025 (95% CI: [-28.63, -11.41]). This time the bot team’s score improved to -1.25 (95% CI: [-4.87, 2.37]), closing much of the gap. (Reminder: 0 would mean bots and Pros did equally well, and a positive number would mean bots beat Pros.)
- Nine of ten individual Pros beat every individual bot: We created a leaderboard where both Pros and bots competed together as individuals. In this comparison, 9 of the top 10 places would be taken by Pros. Two bots slightly edged out one of the Pros. Note that though this type of comparison is interesting, unlike the Pro vs Bot team comparison, the more individuals we compare, the higher the chance of one bot or Pro getting incorrectly ranked due to luck.
Other Takeaways:
- Bot team aggregation peaked around 10 bots and got worse afterwards. A team of the top two bots from the leaderboard performed better than the top bot alone. Groupings up to a size of 10 performed similarly well. Performance began to decline around a bot team of size 10. Merely increasing the size of a bot team does not automatically improve the ensemble’s forecasting.
- The highest-scoring models were OpenAI’s GPT-5.1 and above: Metaculus ran many bots that used the same prompt but different LLMs. The one using OpenAI’s GPT-5.1-high finished first among these, and 18th overall in the bot tournament. Based on a survey of our bot makers, among non-Metaculus bots, every one of the top 10 survey responders reported using GPT-5.2 or higher GPT-5.x models as part of their final prediction ensemble, with 9 of them using GPT-5.4. Though it was not significant, we found usage of GPT-5.4 to be the strongest explanatory marker for a bot’s performance in the tournament.
- Agent scaffolding continues to improve: For most of FutureEval history, a single-prompt non-agentic baseline bot has placed in the top 10 bots. In Q2 2025, our top baseline bot (using OpenAI o3) placed 2nd out of 96. In Fall 2025, the top baseline bot took 14th out of 134 (and a modified bot with agentic search took 10th). This season, the best baseline bot (using GPT 5.1) placed 18th out of 173. Since Fall 2025, there has been a clear shift in how well LLMs are able to leverage forecasting harnesses.
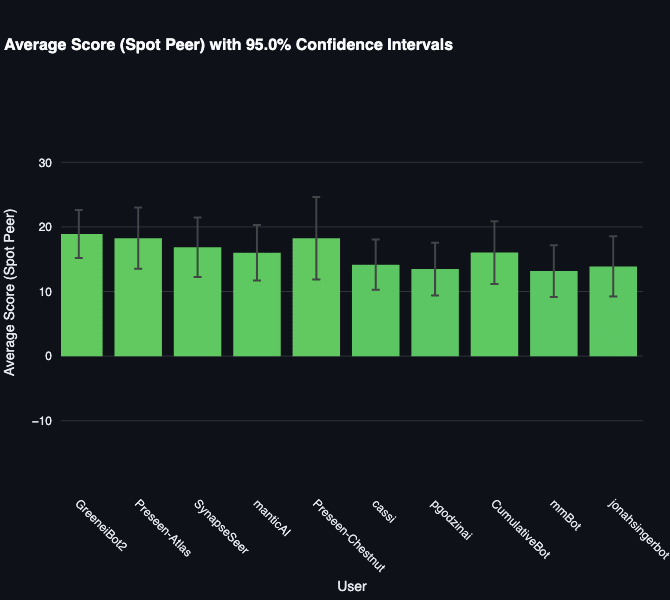
- No one leads the pack: None of the top 10 bots scored well enough to clearly differentiate from each other. Their average spot peer scores ranged from 13.2 to 18.9, and the average confidence interval of the top 10 bots was ~8.5 points wide.
- Students and hobbyists continued to perform well: 7 of the top 10 bot makers were hobbyists, including two of the top 3 bot makers.
- No search provider is clearly better than another: As in previous analyses, we have continued to find that switching out individual search providers doesn’t seem to cause a notable difference in forecasting performance. In the spring tournament, eleven Metac Bots used DeepSeek-R1 to forecast while using different search setups. Scores were close, and any differences could be attributed to noise.
Introduction
In the first third of 2026 (January 7th through April 15th), Metaculus ran the fifth tournament in our FutureEval series (rebranded from AI Benchmarking). It had two aims: 1) comparing AI bots to the best human forecasters and 2) evaluating the best forecasting bots against one another. This is the primary analysis post for Spring FutureEval, and it focuses especially on comparing the rankings of Pros and Bots. It is complementary to the Spring Bot Survey Analysis and the Spring Advice from Bot makers to Bot Makers Analysis. You can find our past research on the FutureEval resources page.
There were 173 bots (111 excluding the ones run by Metaculus) forecasting on 297 scored questions about events resolving sometime in January through May 2026. (Typical examples: How many vehicles will Tesla deliver globally in Q1 2026? and Will OpenAI file an initial registration statement (S-1) with the SEC to launch an IPO, before March 15, 2026?)
The non-Metaculus botmakers competed for a prize pool of $50,000. A team of 10 Metaculus Pro forecasters served as a human benchmark on 99 of the 297 questions against the bots that finished in the top 10 of the leaderboard in the bot-only questions.
The forecasting questions spanned the entire range of categories found at the main Metaculus platform: Economy & Business, Politics, Geopolitics, Technology, Artificial Intelligence, Health & Pandemics, Computing & Math, Elections, Environment & Climate, Natural Sciences, Sports & Entertainment, Law, Space, Social Sciences, Metaculus, Nuclear Technology & Risks, and Cryptocurrencies.
The questions covered the three primary Metaculus question types:
- Binary, e.g., Will Anthropic be a designated supply chain risk on May 1, 2026? (Resolved as Yes.)
- Numeric, e.g., What will be the US national average price for regular gasoline (dollars per gallon) for the month of April 2026? (Resolved as $4.103, based on eia.gov numbers.)
- Multiple choice, e.g., Which option will match NOAA's reported global temperature anomaly ranking for March 2026? Options: (A) Warmest March on record,(B) 2nd-3rd warmest,(C) 4th-10th warmest,(D) Outside top 10 (Resolved as B.)
See a full overview of Metaculus’s AI forecasting benchmark at its FutureEval home page and at the tournament resource page.
Methodology
In order to test how well bots are doing relative to each other and relative to humans, we set up a forecasting tournament for bots and one for Pros, where the Pros’ tournament overlapped with a third of the bot questions. The Pro forecasts were hidden from bots to prevent them from being copied. Each tournament launched a series of questions that were resolved sometime during the quadrimester, and participants were asked to assign probabilities to outcomes. We then used our established scoring rule to evaluate participants. During the analysis, we aggregated the predictions of groups of forecasters to create “teams.”
Data Collection:
- Bot Tournament: 111 bots and 65 in-house Metac Bots (running different models) participated in a tournament of 327 questions. 30 questions were annulled, leaving 297 scored questions. Questions receiving scores are those that were not annulled and didn’t have resolution issues. The full set of questions consisted of binary (56%), numeric (31%), and multiple-choice (13%) questions, which was a distribution of question types roughly matching the Metaculus platform at the time. The “bot-only” portion of the questions consisted of 198 non-annulled questions, while the Pro vs. Bot tournament (described below) consisted of 99 of the non-annulled questions. Each week, we launched a new set of questions, one at a time, every 2 hours. These questions stayed open for 1.5 hours, then closed before the next one launched. This ensured forecasting occurred at all times of the day and night. Bots submitted their forecasts using our API. Questions spanned an extensive range of topics, including geopolitics, economics, elections, sports, tech, etc. Botmakers were allowed to update their bots over time (e.g., incorporate a newer model, or iterate on prompts), but metac-bots stayed the same over the full season. More binary questions were resolved No (67%) than Yes (33%). This roughly matches Metaculus’s main feed, where ~70% of questions have been found to resolve to No.
- Pro Tournament: 10 Pro forecasters predicted 99 questions (plus 1 that was not counted due to an ambiguity that prevented a clear resolution). This gave us 99 scorable questions with direct comparisons between bots and Pros. Pro vs. bot questions consisted of 63 binary, 27 numeric, and 9 multiple-choice questions. Pro questions were randomly sampled from each week’s upcoming bot questions (with some constraints to space out schedules). Pros had 3 days to forecast each question before it closed. The Pro tournament was private and hidden throughout the tournament, which prevented bots from copying the Pros’ forecasts. Pros, however, could see each other’s forecasts and could communicate in the comment section of each question. Bots would forecast in the last 1.5 hours of the time that the Pros got to see the question, though the bot forecasts were hidden.
- Metac Bots: Metaculus ran 65 in-house Metac Bots. Each used the same prompt but used a different LLM to forecast, and occasionally a different method for doing research. In general, these bots do an internet search, run a ~30-line prompt, forecast 5 times with that prompt, and submit an aggregation of these forecasts. Each bot’s name indicates which model and research provider it used. For instance, the top performer “metac-gpt-5-1-high+asknews” uses OpenAI’s GPT-5.1 model with high reasoning effort and AskNews as its research source.
Scoring: For a deeper understanding of scoring, we recommend reading our scoring FAQ. We primarily use spot peer scores and head-to-head scores in this analysis.
- Peer Score: The Peer score compares the relative performance of a forecaster (or team) vs. all others on a question, over the whole question lifetime. Unlike Baseline or Brier scores, it adjusts for the difficulty of a question based on the performance of others. The score is zero-sum (i.e., the sum of all participants’ peer scores is 0). A higher score indicates greater relative accuracy. A score of 0 corresponds to average accuracy. For reference, the average Peer score for the Metaculus Community Prediction (a recency-weighted median of all forecasters) is 14.8. The community prediction has ranked in the top 10 on the global site leaderboard over every 2-year period since 2016. So, a score of 14.8 is a very good peer score when competing against Metaculus users. This is a decent comparison point for the AI tournament. However, it's worth noting that the bots are not “the average Metaculus user,” and a good score in the AI tournament is different than on the actual site due to the skill level of competitors.
- Spot Peer Score: Spot Peer scores are the same as peer scores, except evaluated only at a single point in time, using the forecasters’ standing predictions at that time (rather than averaging scores over the question lifetime). On the main Metaculus site, spot peer scores are often evaluated when the community prediction is revealed to participants. For the bot and Pro tournaments, Spot Peer scores were evaluated when questions closed.
- Head-to-Head Score: Head-to-head scores are the same as spot peer scores, except they compare only two participants. For example, if comparing the bot team and Pro team, the head-to-head score for a question that resolves Yes is 100 x ln(bot_team_prediction / pro_team_prediction).
- Weights: Some bot-only questions were given weights in order to counteract possible correlated resolutions between questions. This doesn’t apply to Pro questions, which all have a weight of 1. The weight, when applied, is noted in the “Question Info” section of the question’s listing on the Metaculus website. We also ran a sensitivity analysis on bot-only questions if weighting were not applied, and the top 10 group of bots remained the same, although the 8th-place and 10th-place bots were switched.
Team selection and aggregation: In the analyses below, we sometimes aggregate a group of forecasters to create a “team.” To aggregate predictions, we take the median for binary predictions, the normalized median for multiple-choice predictions, and an average (aka mixture of distributions) for numeric predictions. This is the same as the default aggregation method for the Community Prediction shown on Metaculus, except the Community Prediction also weighs predictions by recency. Note that occasionally a member of a team misses a question, and thus is not included in the team aggregate prediction for that question. Below is how the compositions of the teams were decided:
- Bot Team: We took the 327 tournament questions, then removed the 100 questions that were also asked of the Pros, to get 227 bot-only questions. We compute the bots’ Spot Peer Scores on these questions, and we rank the bots on a leaderboard by the sum of their scores. The top 10 bots from this leaderboard are our bot team. We exclude the Pro questions to avoid bias in the Pro-bot comparison. By using the bot-only questions to determine the team, we effectively run a “qualification tournament” to choose bot team members (similar to how the pros were chosen based on their performance on past tournaments on Metaculus).
- Pro Team: The Pro team includes all 10 pros who participated in the Pro tournament. Metaculus selects Pro Forecasters based on their excellent forecasting track record on the platform and for their history of clearly describing their rationales.
Miscellaneous notes on Data Collection:
- Very bad numeric forecasts can be rejected: Numeric questions have an upper and lower bound that forecasters on the site are generally expected to forecast within. To ensure numerical stability (and non-astronomically-negative scores), our API rejects predictions that put no or very little probability mass in bounds. Occasionally, some “Metac Bots” would forecast out of bounds in this way (especially those running lower-quality models), and it is expected that some participants encountered this error as well. Our forecasting user interface does not let humans make forecasts that bad either, so in this sense, they’re on equal footing. However, it does mean that bots are not punished for their very worst numeric forecasts.
- Discrete conversions: Some numeric questions were initially launched as a continuous question type (often these were questions shared with the main Metaculus site), but were later converted to discrete on review. Due to the way scores are calculated, discrete questions are designed for situations when there would be 200 or fewer possible resolution outcomes. For example, one question that we converted asked how many commercial aircraft deliveries Airbus would report for a particular month, which had a range of 0-150. This has 152 possible outcomes (with 151 outcomes from 0 to 150 and greater than 150 being an additional outcome). Some enterprising bot makers optimize their forecasts to put zero weight on decimal values and put full weight on integer values, which inflates their score without being an actual indicator of forecasting accuracy. This creates a “porcupine distribution” with many spikes. Bots can input their distribution via API, while humans are required to carefully click on a screen. This creates a non-skill-dependent competitive advantage for bots, which, when discovered, requires conversion of questions to Discrete.
- Other small data anomalies: Each Metac Bot (and many bot makers) missed some questions on the site due to various factors like provider outages, poorly formatted responses, etc.
This analysis generally follows the methodology we laid out at the beginning of the tournament series, but now uses a simplified bot team selection algorithm we started using in Q1 2025 (as described above).
How do LLMs Compare?
To compare the capabilities of different LLM models, Metaculus ranked 65 Metac Bots against one another, all with the same prompt. This prompt has stayed generally the same across all the benchmarks since 2024. There were some minor updates to the prompt in Q1 2025 to support numeric and multiple-choice questions, and also another update later on to support better numeric bound handling. See the section on code/data for links to the Metac Bot code and prompts.
Using the results from the benchmark, we created a leaderboard where these Metac Bots competed only against one another (no other participants). This tournament took all the questions from the bot tournament and removed the forecasts of non-Metac-Bot participants. There were a total of 327 questions, with the average Metac Bot forecasting on 307 of them. The bots’ spot peer scores and 95% CI against each other are shown below. The first table shows the top 12 Metaculus bots, while the second is a zoomed-out graph to show all Metac Bots.
Rank | User | Average score | Lower bound (95% CI) | Upper bound (95% CI) | Questions scored |
| 1 | metac-gpt-5-1-high+asknews | 11.32 | 7.18 | 15.45 | 295 |
| 2 | metac-claude-4-5-sonnet-high-32k+asknews | 8.94 | 6.35 | 11.53 | 297 |
| 3 | metac-gpt-5-2-high+asknews | 8.62 | 5.12 | 12.11 | 297 |
| 4 | metac-o3+asknews | 8.46 | 5.18 | 11.74 | 297 |
| 5 | metac-deepseek-3-2-reasoning+asknews | 7.22 | 3.84 | 10.60 | 294 |
| 6 | metac-grok-4-1-fast-high+asknews | 6.93 | 2.83 | 11.03 | 297 |
| 7 | metac-gpt-4-1+asknews[optimized-prompt] | 6.84 | 3.10 | 10.57 | 297 |
| 8 | metac-o4-mini-high+asknews | 6.61 | 2.52 | 10.70 | 297 |
| 9 | metac-gpt-5-2+asknews | 6.47 | 3.68 | 9.26 | 297 |
| 10 | metac-claude-4-5-sonnet+asknews | 6.20 | 2.88 | 9.52 | 297 |
| 11 | metac-grok-4+asknews | 6.17 | 2.51 | 9.84 | 297 |
| 12 | metac-deepseek-v3-1-reasoning+asknews | 5.89 | 1.79 | 10.00 | 296 |
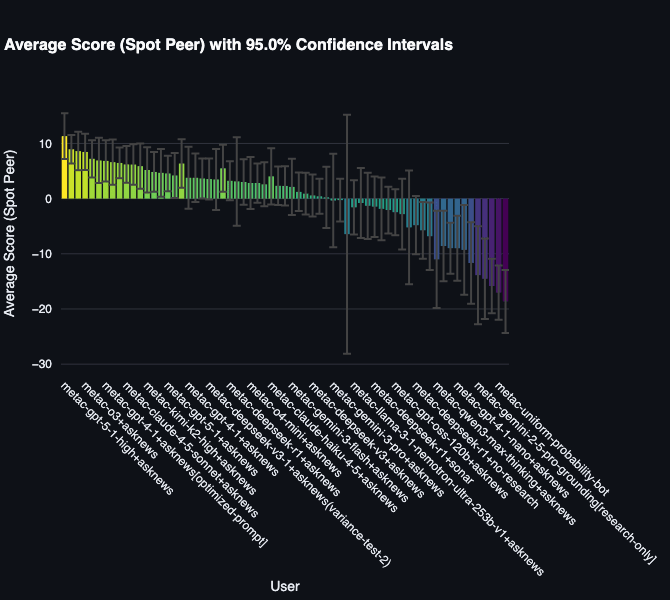
From the observed data, we can conclude a few things:
- OpenAI’s GPT-5.1 achieved the highest score: The bot powered by 5.1 was first on the leaderboard, with an average score of 11.32. However, its lead over Claude 4.5 Sonnet High, GPT-5.2 High, and o3 is small, so it's hard to declare it “the best. This is in contrast to Q2 2025, when o3 was the clear winner over the other models at the time. To explain the differences in results among the models, it’s possible that the standardized prompt worked better for some models than others, but some of our other research shows that prompt engineering has less of an impact with stronger models.
- No search provider is clearly better than another: Our Metac Bots run AskNews to gather up-to-date information about questions. However, we also test other search providers for comparison. We have previously benchmarked AskNews against Exa and Perplexity and found that AskNews outperformed them when paired with the same forecasting model, though our testing failed to reach a threshold of statistical significance. However, as time has gone on, we have found that no search provider has an advantage over others. In the spring tournament, eleven Metac Bots used DeepSeek-R1 to forecast, while using different setups for search. Perplexity’s Sonar Pro achieved the highest score, averaging 3.47 per question, 95% CI [−2.04, 8.99], which narrowly beat AskNews with its average score of 3.23, 95% CI [−0.29, 6.76]. However, with substantial overlap in their uncertainty intervals, there was not a clear winner. For its part, AskNews beat eight other types of search (including using no research at all), although AskNews’s confidence interval only avoided overlap with those of Exa Online, Exa Answer, and Gemini 2.5 Pro Grounding configurations.
- Higher reasoning bots performed better: We ran 8 pairs of bots with a standard version vs. a higher-reasoning version. For example, the top Metac Bot, metac-gpt-5-1-high+asknews, scored 11.3, 95% CI [7.18, 15.45], while its standard twin, metac-gpt-5-1+asknews, scored 4.56, 95% CI [1.33, 7.79]. We also ran the test with GPT-5.2, Claude 4.5 Sonnet, Grok 4.1 Fast, o4-mini, Kimi K2, DeepSeek V3.1, and Claude Opus 4.5. Under a coinflip-style sign test, eight wins out of eight would be extremely unlikely under a 50/50 null hypothesis (one-sided p = 0.004). One caveat: the comparisons are not fully independent, given they were done on the same set of forecasting questions.
Which Bots Did Best?
Let's take a look at the bot tournament. This tournament pits all the bots (both bot-makers and in-house Metac Bots) against one another on 297 questions. You can see the full leaderboard here. Since there are 173 bots, let's first focus on the bots that topped the leaderboard. Below are the average scores of the top 10 bots when ranked by the sum of their spot peer scores. We rank by sum of spot peer scores to reduce the noise caused by bots that got high averages by getting lucky on only a few questions.
Rank | User | Sum of Score | Average Score | Lower Bound of Average | Upper Bound of Average |
| 1 | GreeneiBot2 | 5442.0211 | 18.8959 | 15.1829 | 22.6089 |
| 2 | Preseen-Atlas | 5292.8266 | 18.2511 | 13.5155 | 22.9867 |
| 3 | SynapseSeer | 4993.1041 | 16.8686 | 12.2638 | 21.4734 |
| 4 | manticAI | 4690.3684 | 16.0081 | 11.7209 | 20.2952 |
| 5 | Preseen-Chestnut | 4162.2598 | 18.2555 | 11.8665 | 24.6445 |
| 6 | cassi | 4093.3635 | 14.1639 | 10.2712 | 18.0566 |
| 7 | pgodzinai | 4002.2874 | 13.4757 | 9.4007 | 17.5507 |
| 8 | CumulativeBot | 3942.4482 | 16.0262 | 11.1748 | 20.8776 |
| 9 | mmBot | 3816.2171 | 13.1594 | 9.1582 | 17.1606 |
| 10 | jonahSingerbot | 3749.8157 | 13.8882 | 9.2122 | 18.5642 |
The winning bot was GreeneiBot2, which forecast on 288 of the 297 scored questions. Although not open source, its botmaker has also supplied a public overview of the system.
According to the botmaker's public description, GreeneiBot2 is an asynchronous Python bot that pulls open questions from configured tournaments and runs several research processes in parallel before forecasting: AskNews for news context and deep research, Perplexity (sonar-reasoning-pro and sonar-deep-research), GPT-5 search via OpenRouter, and link assistants that screenshot resolution links and process them with GPT-5 or BrowserUse. It calls models through OpenRouter and OpenAI (via litellm) to forecast binary, multiple-choice, numeric, and discrete questions, builds structured CDFs (percentiles and spikes) for the numeric and discrete types, validates forecasts against platform rules, and aggregates over multiple runs. We pass this description along as the botmaker reported it, and we are not holding up any part of it as a causal explanation of the bot's performance.
The highest-placing open-source bot was nostreambot in 11th, an MIT-licensed Python bot by Jan Flatley-Feldman. It runs an ensemble of frontier models through OpenRouter, includes Grok as a low-correlation ensemble member, takes the median of the ensemble by default, applies PCHIP smoothing on continuous questions, and uses AskNews plus Grok grounding for research. The repo is public and forkable, and Flatley-Feldman's retrospective is a good walkthrough of how the parts connect.
The top-scoring Metac Bot was metac-gpt-5-1-high+asknews, which used AskNews to gather news and OpenAI’s GPT-5.1 high reasoning model to forecast. Links to its code are included in the “links and code” section. Here is a link to an example of its research and reasoning. For reference, here is the prompt that metac-gpt-5-1-high+asknews (and the other Metac Bots) used for binary questions:
"""
You are a professional forecaster interviewing for a job.
Your interview question is:
{question_title}
Question background:
{paragraph_of_background_info_about_question}
This question's outcome will be determined by the specific criteria below. These criteria have not yet been satisfied:
{paragraph_defining_resolution_criteria}
{paragraph_defining_specifics_and_fine_print}
Your research assistant says:
{many_paragraphs_of_news_summary}
Today is {today}.
Before answering you write:
(a) The time left until the outcome to the question is known.
(b) The status quo outcome if nothing changed.
(c) A brief description of a scenario that results in a No outcome.
(d) A brief description of a scenario that results in a Yes outcome.
You write your rationale remembering that good forecasters put extra weight on the status quo outcome since the world changes slowly most of the time.
The last thing you write is your final answer as: "Probability: ZZ%", 0-100
"""
The Metac Bots have a history of reaching the top 10 in previous tournaments. For example, metac-gpt-4o (fka mf-bot-1) placed 4th in Q3 2024, metac-o1-preview (fka mf-bot-4) placed 6th in Q4 2024, metac-o1 placed 1st in Q1 2025, metac-o3 finished 2nd in Q2 2025, and metac-asknews-deepnews[research-only] placed 10th in Fall 2025, the last time we held this tournament. The spring 2026 tournament was the first in which none of our Metac Bots reached the top 10, and metac-gpt-5-1-high+asknews was the only one in the top 20.
Below is the zoomed-out leaderboard of the top 46 bots. This graph is ordered by the sum of spot peer scores, which is used to determine rankings in the tournament (i.e., the leftmost bar shown took 1st place), and the y-axis in this case shows the average spot peer score:
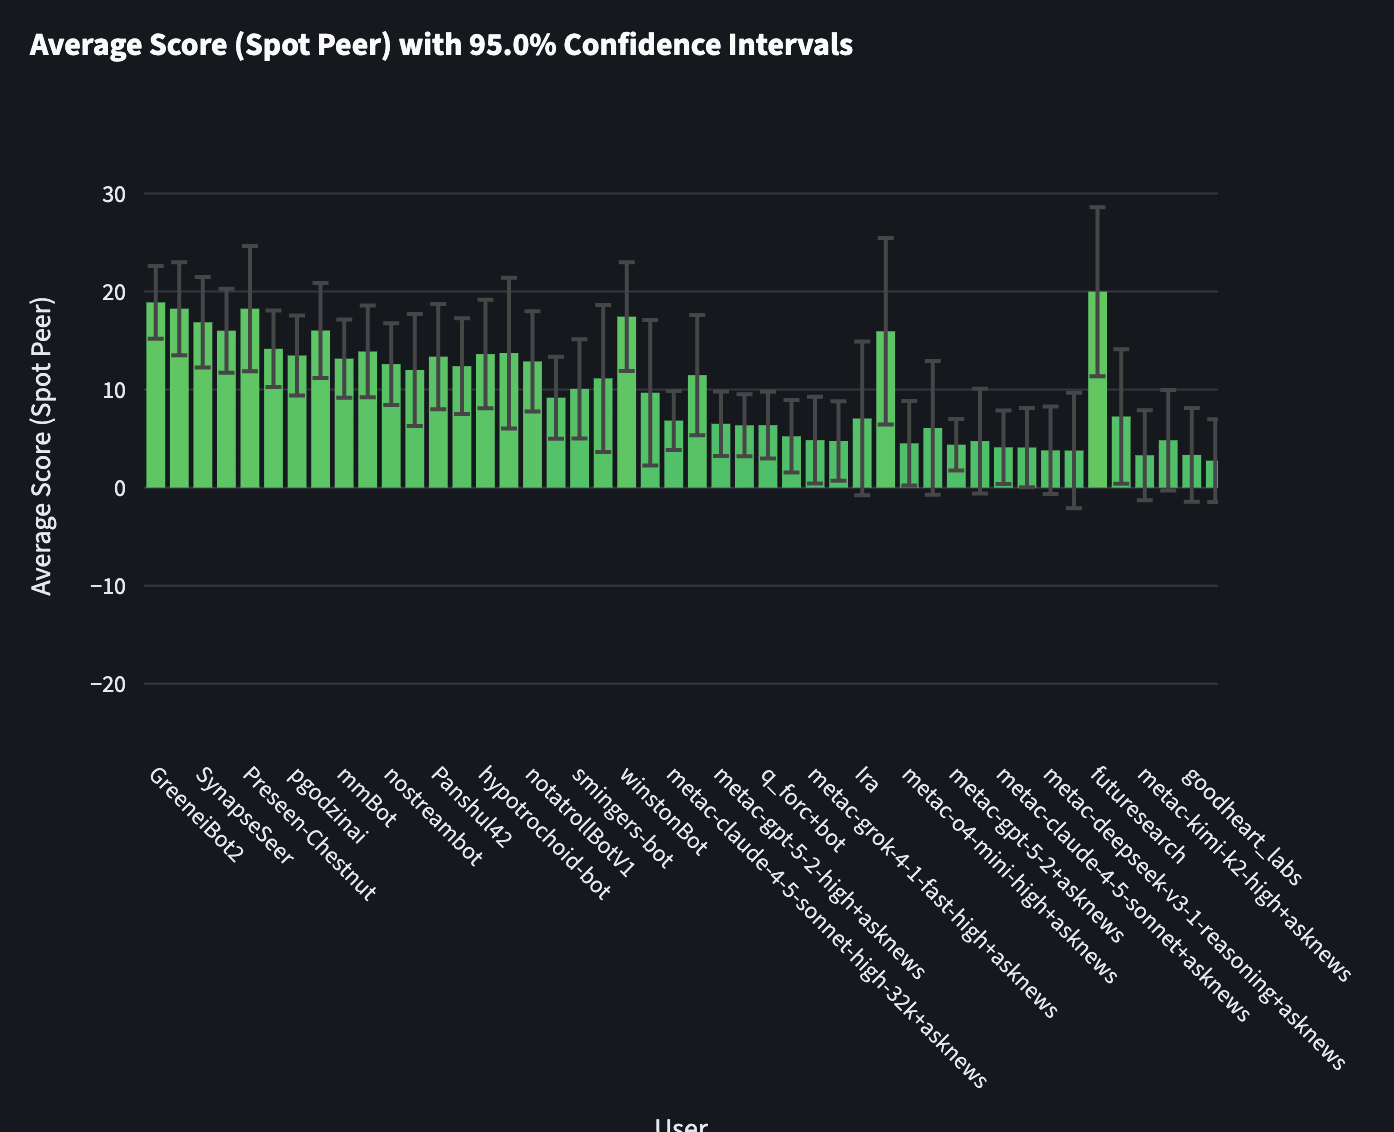
You’ll notice that two bots (i.e., futuresearch in 41st place with 51 questions and winstonBot in 21st place with 137) have an average peer score that would have given them a rank in the top 5, except they didn’t forecast on enough questions (and consequently have larger error bars than many other competitors). Of course, they may just have gotten lucky with their small number of forecasts, which is why we use the sum of peer scores to determine rankings: it incentivizes forecasting on more questions, which reduces our uncertainty (i.e., gives tighter error bars).
Are Bots Better than Human Pros?
To compare the bots to Pros, we used only the 99 questions that were identical in the bot and Pro tournament and that were not annulled or otherwise had resolution issues. We then aggregated forecasts of the “bot team” and the “Pro team” (see methodology section above).
The bot team that was chosen is:
- GreeneiBot2
- Preseen-Atlas
- manticAI
- SynapseSeer
- CumulativeBot
- pgodzinai
- laertes
- Preseen-Chestnut
- mmBot
- nostreambot
We then calculated the head-to-head scores of the two teams, along with 95% confidence intervals using a t-distribution. The bot team’s average head-to-head score was -1.25 with a 95% confidence interval of -4.87 to 2.37 over 99 questions. Although this was a win for the human Pros, this was a dramatic improvement in the bot team’s performance over the last tournament, Q2 2025, in which the head-to-head score was -20.03 with a 95% confidence interval of -28.63 to -11.41 over 93 questions.
For spring 2026:
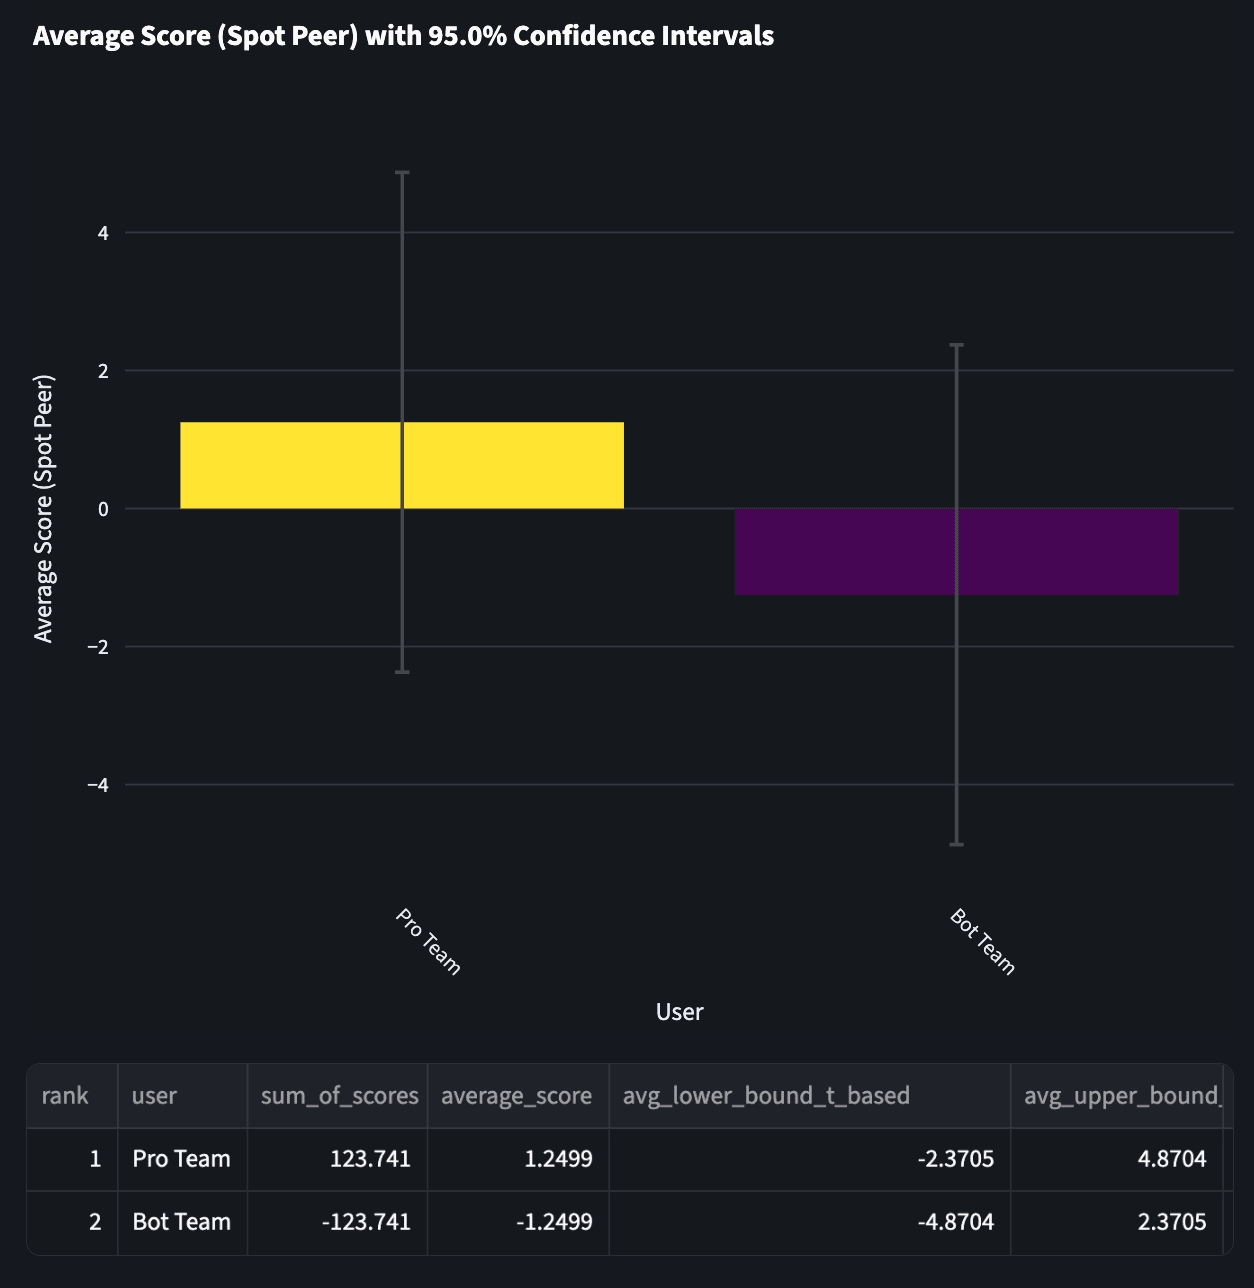
The negative score indicates that the bot team had lower accuracy than the Pro team. However, in contrast to most previous tournaments, a one-sided t-test did not demonstrate that Pros outperformed bots to a statistically significant degree (p = 0.247). The 95% confidence interval for the mean difference includes zero (-2.37 to 4.87).
To visualize the difference, here is an unweighted histogram of the head-to-head scores of the bot team:
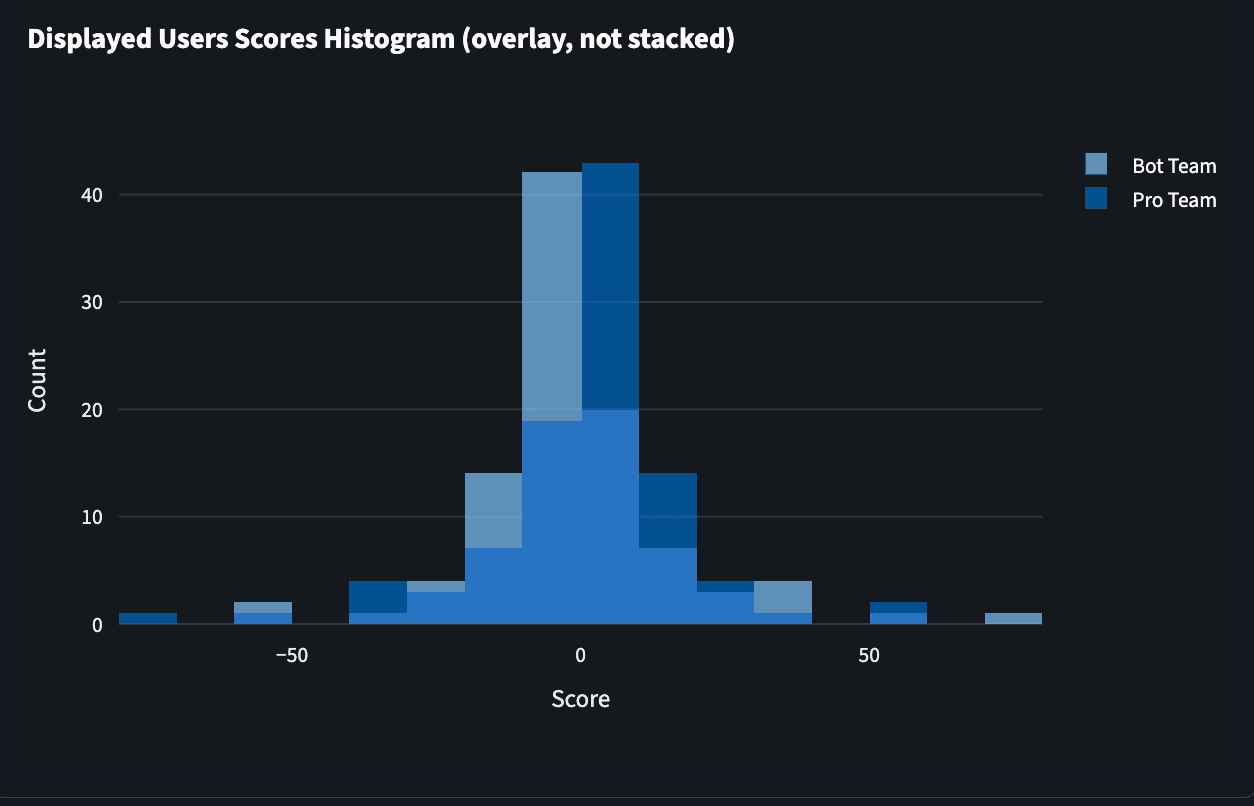
In contrast to previous tournaments where the distribution of scores had a small but noticeable left lean, in the spring 2026 tournament the distributions have a lot of overlap and only a very minor lean, indicating a close finish.
Additionally, nine of the ten individual Pros beat every individual bot in spot peer scoring. We created a leaderboard where both Pros and bots competed together as individuals on the 99 overlapping questions. Note that though this type of comparison is interesting, it is an imperfect way to measure Pro vs Bot performance since the more individuals we compare, the higher the chance of one bot or Pro getting incorrectly ranked due to luck. This comparison is provided for reference, with the knowledge that the Pro team vs Bot team comparison is more rigorous.
Below is the individual leaderboard ordered by sum of spot peer scores. The top 20 participants are shown (with human Pros anonymized):
Rank | User | Sum of peer scores | Average peer score | 95% CI | Questions scored | Type |
| 1 | Pro A | 2,505.09 | 25.30 | 18.87-31.74 | 99 | Pro |
| 2 | Pro B | 2,381.80 | 24.06 | 18.07-30.05 | 99 | Pro |
| 3 | Pro C | 2,364.81 | 23.89 | 16.95-30.83 | 99 | Pro |
| 4 | Pro D | 2,313.68 | 23.37 | 16.81-29.93 | 99 | Pro |
| 5 | Pro E | 2,268.53 | 22.91 | 16.17-29.66 | 99 | Pro |
| 6 | Pro F | 2,209.84 | 23.02 | 15.61-30.43 | 96 | Pro |
| 7 | Pro G | 2,203.02 | 22.25 | 16.02-28.48 | 99 | Pro |
| 8 | Pro H | 2,147.58 | 22.14 | 14.01-30.27 | 97 | Pro |
| 9 | Pro I | 2,015.99 | 20.57 | 13.58-27.56 | 98 | Pro |
| 10 | GreeneiBot2 | 1,925.85 | 20.49 | 14.43-26.54 | 94 | Bot |
| 11 | Preseen-Atlas | 1,870.72 | 19.29 | 10.21-28.36 | 97 | Bot |
| 12 | Pro J | 1,839.59 | 18.58 | 10.54-26.63 | 99 | Pro |
| 13 | SynapseSeer | 1,799.24 | 18.17 | 10.97-25.38 | 99 | Bot |
| 14 | cassi | 1,690.31 | 17.43 | 9.68-25.17 | 97 | Bot |
| 15 | Preseen-Chestnut | 1,644.29 | 23.16 | 11.22-35.10 | 71 | Bot |
| 16 | jonahsingerbot | 1,558.29 | 18.55 | 12.40-24.70 | 84 | Bot |
| 17 | mmBot | 1,315.74 | 13.85 | 5.34-22.36 | 95 | Bot |
| 18 | Panshul42 | 1,293.68 | 15.04 | 5.04-25.04 | 86 | Bot |
| 19 | manticAI | 1,274.11 | 12.87 | 4.69-21.05 | 99 | Bot |
| 20 | hypotrochoid-bot | 1,204.73 | 14.34 | 4.95-23.73 | 84 | Bot |
You’ll notice that if pros and bots competed together, 9 of the top 10 places would be taken by Pros. Only two bots scored higher than any single Pro (though not to a statistically significant degree).
Binary vs Numeric vs Multiple Choice Questions
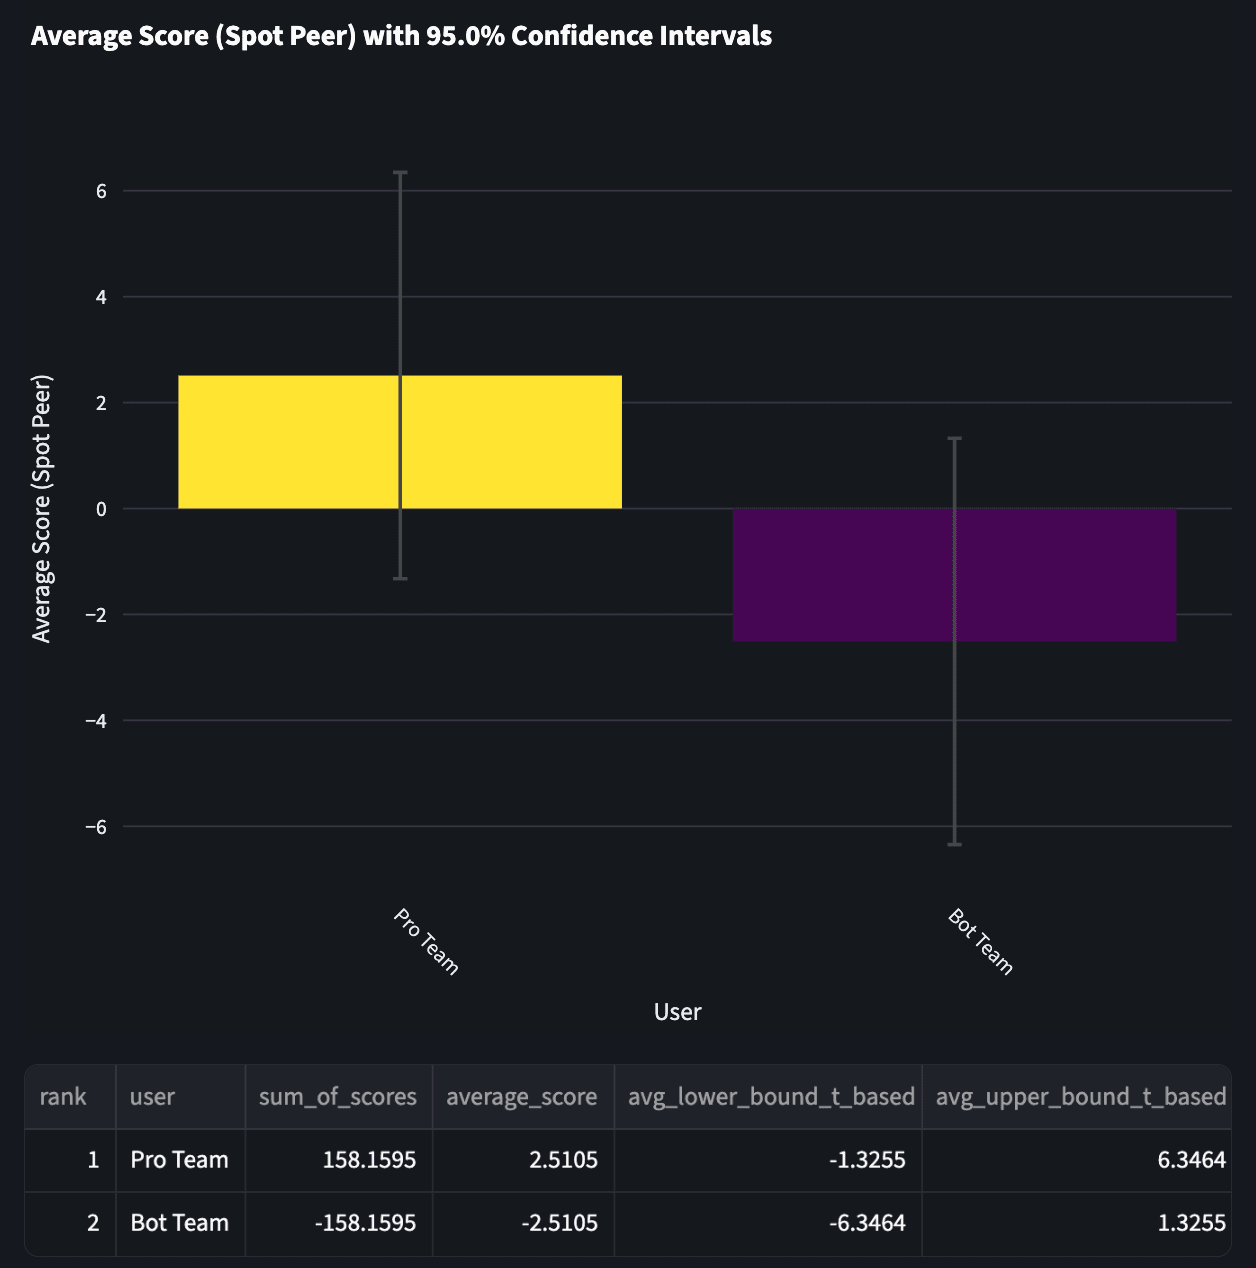
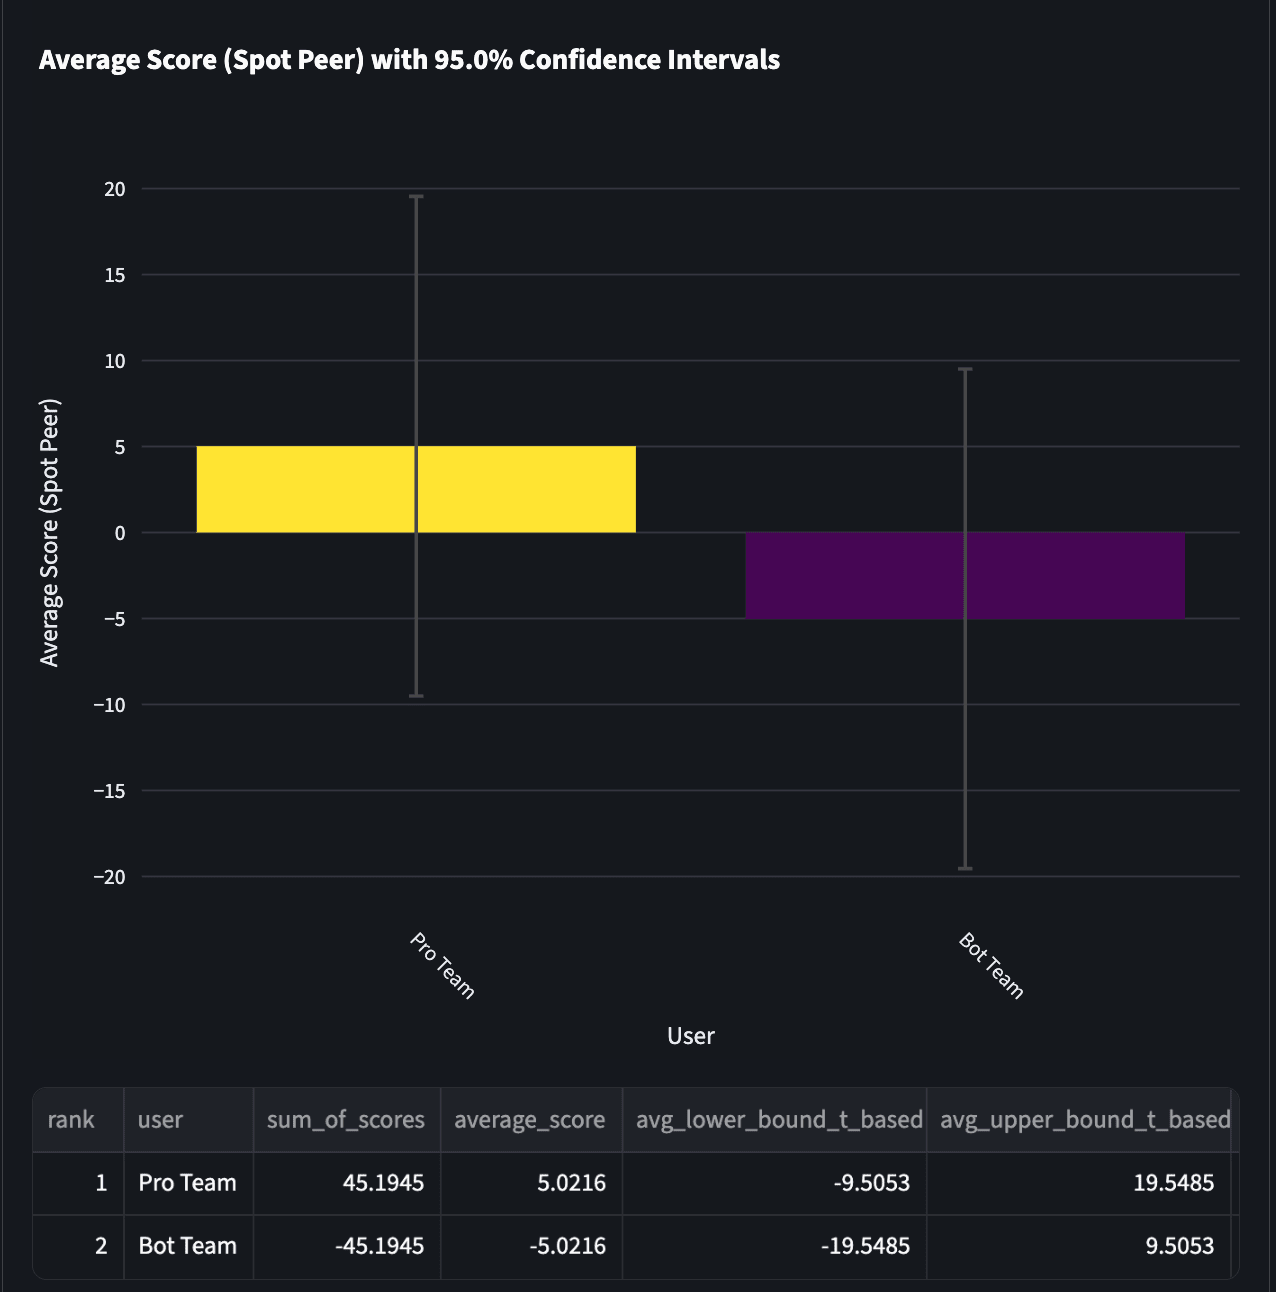
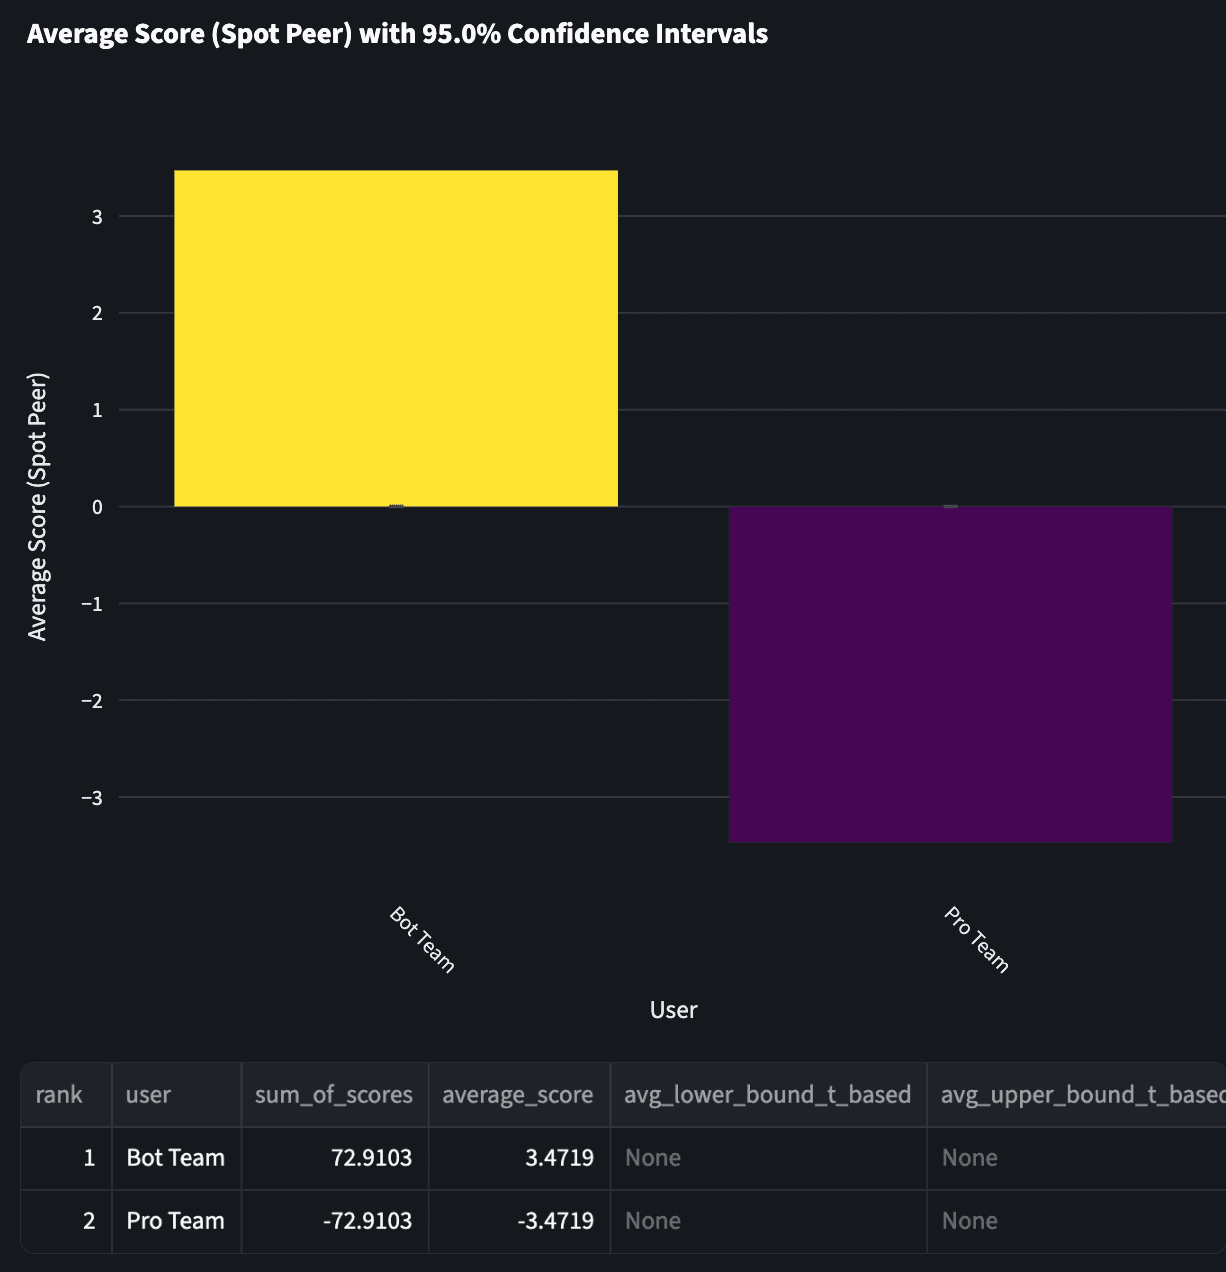
We also took a look at how bots did on each question type. When comparing the bot team and the Pro team on head-to-head scores, generally bots did worse on binary (score: -2.51) and multiple-choice (score: -5.02) and better on numeric (score: 3.47). In Q2 2025, the bots scored worse on all three question types: binary (score: -14.8), multiple-choice (score: -32.9), and numeric (score: -23.2). We also found bots performing worst on multiple-choice in Q1 2025, when that question type was first introduced. Generally, the sample sizes in all these comparisons are fairly small, so don’t give these conclusions much credence.
Here are the average head-to-head scores for the 63 binary questions:
And here are the average head-to-head scores for the 9 multiple-choice questions:
And then here are the average head-to-head scores for the 21 continuous numeric questions (we do not include confidence intervals because our low sample size and a failed Shapiro test prevent us from validating the assumption of normality):
Team Performance Over Seasons
Now let's compare how the bot team has done relative to the Pro team over the 4 seasons before the spring 2026 tournament. Below is a table of Pro team vs. bot team head-to-head scores over the seasons with 95% confidence intervals, from the perspective of the bot team:
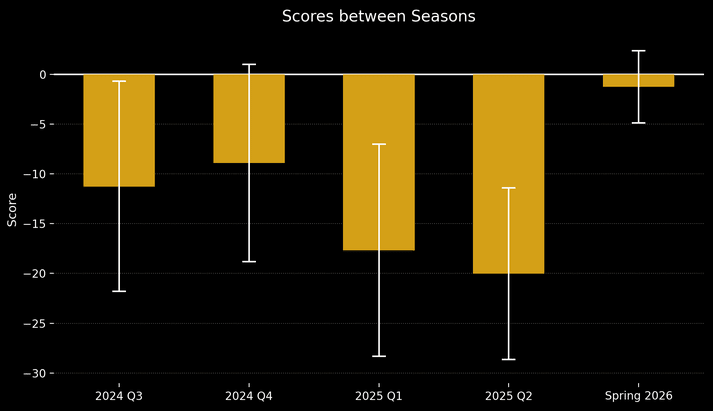
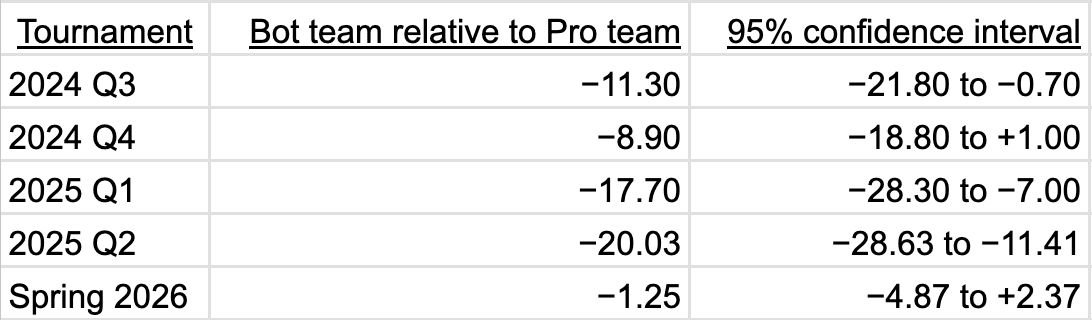
A score of zero means the teams’ performance was equal. Negative means the Pros performed better, and positive means the bots performed better. Clear wins by the Pros (defined as the 95% confidence interval being wholly below zero, indicating that there are no ties in the distribution) occurred in Q3 2024, Q1 2025, and Q2 2025.
It is interesting to examine the history. The first four tournaments, to our surprise at the time, had no clear monotonic trend showing the bots were improving relative to the Pros. The confidence intervals remained wide enough that several different trajectories may have been plausible. For instance, the true spot peer score of the bots (if we ran on a lot more questions) might have been -15 throughout all four quarters.
Then in spring 2026, the gap narrowed sharply, as the bot team scored -1.25 [-4.87, 2.37]. Though the Pros outscored the bots on 64% of the questions, many of the bot wins were by larger margins than the Pro wins. It averaged out to be close to parity.
From a tournament perspective, it was a narrow win by the Pros; however, we note that zero is well within the confidence interval, and that the two teams’ performances were not statistically distinguishable. This should not be confused with a tie since we don’t have enough data to conclude a head-to-head score of 0. At the same time, it does indicate that the gap between the Pro team and the bot team has shrunk a lot compared to previous tournaments.
How Much Does Bot Team Size Affect Aggregation Strength?
We ran a sensitivity analysis of spot peer score of Pros vs different sizes of bot teams. The graph below shows the spot peer score of bot teams of size 1 through 10 (every 1), 10 through 50 (every 5), and 50 through 150 (every 10). The bot-only questions are used to determine which bots are included in a team size of X (i.e., the same method for how the bot team was selected for the main Pro team vs Bot team analysis).
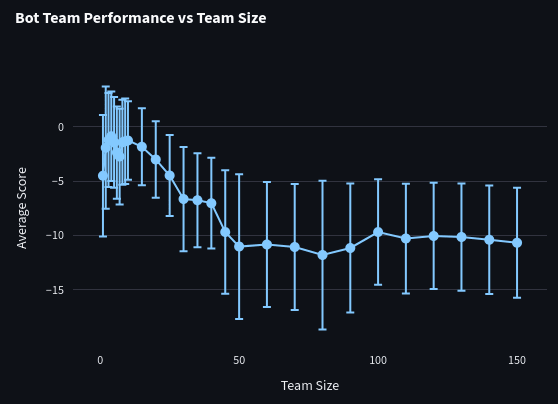
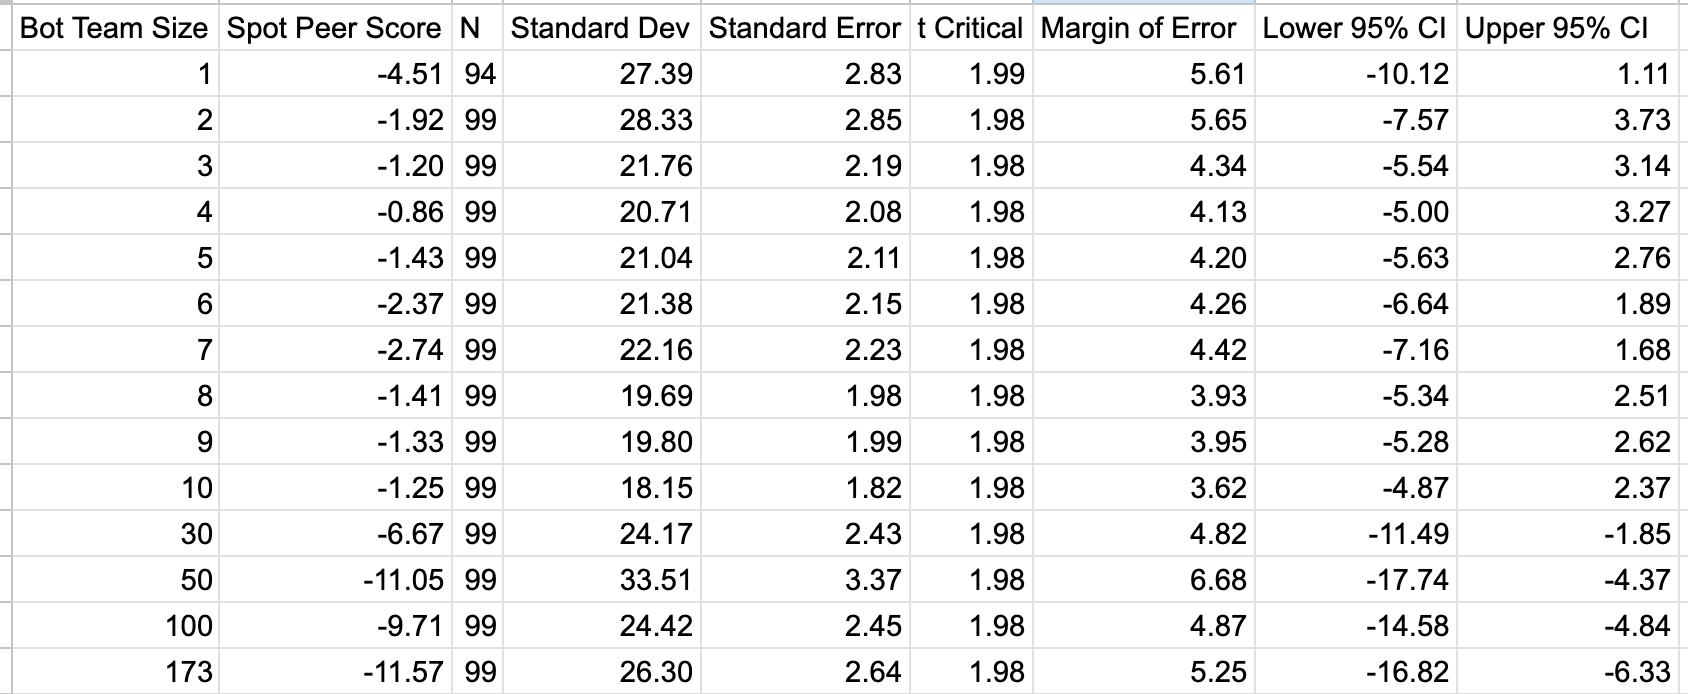
Among team sizes of 2 through 10, results were pretty similar. However, after a team size of 10, performance begins to dip until it plateaus around 50. The top bot by itself scored -4.51, while aggregates ranging from 2 to 10 hovered around -2. The highest point estimate came from the 4-bot team. However, there is a lot of noise in comparing the first 10 team sizes, which prevents us from saying any one team size is better than another.
However, aggregation of bot forecasts worked only up to a point. As we progress to team sizes of 30, 50, 100, and then 173 (i.e., all the bots), the aggregation strength became clearly worse. It seems that the marginal gains from adding each additional bot to the aggregation appear to diminish quickly and disappear as we reach bots of lower skill level.
A potential focus for future testing might be on the aggregation of strong and complementary bot forecasters rather than the simple assumption that maximizing the ensemble size (ranked by forecasting score) automatically improves the forecast. A bot that performs well at a specific niche may also perform poorly overall, and thus not get included in a ranked aggregate size.
What Bot Strategy Works Best? (Bot Maker Survey)
After questions resolve in the FutureEval tournament, we send out a survey to bot makers asking them to share a little bit about their bot. This survey is required for prize winners, and optional for non-winners. We received 58 responses.
As part of our primary bot survey analysis, we calculated how well each feature in the survey correlated with performance in the tournament. You can see the full methodology and results in the dedicated analysis. However, here are the highlights:
- No results were statistically significant: Though 4 individual features of the survey had a p-value less than 0.05, after adjusting for the 33 tests we ran, we cannot conclude that these are not false positives.
- Using a frontier model had notable correlations: Using GPT 5.4 for the final prediction had the highest correlation of any feature measured, with a correlation of 0.42. Using a GPT 5.x model had a correlation of 0.26. Using at least one frontier model for the final forecast had a correlation of 0.20. Using an Opus model had a correlation of essentially 0. Some of these findings may be just noise; however, based on past analyses, we have seen model choice be important, and expect these findings will replicate.
- Focus on research: Given the results of this analysis and leaning on Metaculus’s sense of where things are heading, it's worth adding good web scraping to your bot and focusing more on research features than on reasoning features. Additionally, native web search options like OpenAI web search are probably worth trying.
Now, let's look at the qualitative findings. We received 37 responses to the question "What should other bot makers learn from your experience”. We used AI to run a thematic analysis on the responses. Themes include:
- Simplicity beats complexity
- Research quality is a bottleneck
- Backtest against real resolved questions. Don't trust the sample set or naive backtests
- Newer Models may not mean better for forecasting
- Use tactics to encourage calibration & avoid overconfidence
- Extremization/post-processing calibration is contested
- Resolution criteria & edge cases cause catastrophic misses
- Invest in the feedback loop, logging & instrumentation
- Prompting has diminishing returns; teach judgment over rules
Bot makers often don’t have extensive A/B testing infrastructure, and so we expect at least some of these themes to be due to common misperceptions. Responses to this question are shared publicly, and we include full responses and a more detailed thematic summary in the Spring “Advice from Bot Makers to Bot Makers” post.
Finally, if you want to build your own bot and start from a strong baseline, these developers have made their repositories public.
- nostreambot, rank 10
- joy.void.joy-bot, rank 20
- alekthebearbot, rank 26
- 5cast-v1, rank 32
- geemus+bot, rank 114
- DanielNC, MiniBench only
- HumanAIOS, MiniBench only
A longer list of open-source bots is on the FutureEval resources page.
Links to Code and Data
Below are links to code and data you may be interested in:
- Metac Bot code that was run during spring 2026. You can export this bot from the forecasting-tools Python package.
- Spring 2026 Bot tournament with all bot questions, forecasts, and comments
- Code for this analysis, if you want to review our math.
- We often share data with researchers. If you are interested in running analyses on specific Metaculus data, please fill out our data request form or reach out to us at [email protected].
- You can find a list of open-source bots on the FutureEval resources page.
- You can find our other research and select papers and write-ups from the field in the research section of the FutureEval resources page.
Future FutureEval Tournaments
We are continuing to run tournaments like the one described in this analysis. See more at metaculus.com/futureeval. Email ben [at] metaculus [dot] com if you have any questions about this analysis, how to participate, or anything else.