Seth and Benny, many thanks for this extremely interesting and thought-provoking piece. This is a major contribution to the field. It is especially helpful to have the quantitative meta-analyses and meta-regressions; the typically low within-study power in this literature can obscure the picture in some other reviews that just count significant studies. It's also heartening to see how far this literature has come in the past few years in terms of measuring objective outcomes.
A few thoughts and questions:
1.) The meta-regression on self-reported vs. objectively measured outcomes is very interesting and, as you say, a little counter-intuitive. In a previous set of RCTs (Mathur 2021 in the forest plot), we found suggestive evidence of strong social desirability bias in the context of an online-administered documentary intervention. There, we only considered self-reported outcomes, but compared two types of outcomes: (1) stated intentions measured immediately (high potential for social desirability bias); vs. (2) reported consumption measured after 2 weeks (lower potential for social desirability bias). In light of your results, it could be that ours primarily reflected effects decaying over time, or genuine differences between intentions and behavior, more than pure social desirability bias. Methodologically, I think your findings point to the importance of head-to-head comparisons of self-reported vs. objective outcomes in studies that are capable of measuring both. If these findings continue to suggest little difference between these modes of outcome measurement, that would be great news for interpreting the existing literature using self-report measures and for doing future studies on the cheap, using self-report.
2.) Was there a systematic database search in addition to the thorough snowballing and manual searches? I kind of doubt that you would have found many additional studies this way, but this seems likely to come up in peer review if the paper is described as a systematic review.
3.) Very minor point: I think the argument about Glass delta = 0.3 corresponding to a 10% reduction in MAP consumption is not quite right. For a binary treatment X and continuous outcome Y, the relationship between Cohen’s d (not quite the same as Glass, as you say) and Pearson’s r is given by d = 2r / sqrt(1-r^2), such that d = 0.3 corresponds to r^2 (proportion of variance explained) = 0.02. Even so, the 2% of variation explained does not necessarily mean a 2% reduction in Y itself. Since Glass standardizes by only the control group SD, the same relationship will hold under equal SDs between the treatment and control group, and otherwise I do not think there will be a 1-1 relationship between delta and r.
Again, congratulations on this very well-conducted analysis, and best of luck with the journal submissions. I am very glad you are pursuing that.
Thank you very much for your kind words. Your two 2021 papers were big inspirations and guidance for this post.
I still believe that self-reported outcomes are at serious risk of social desirability bias, even though our test doesn't detect it. The second experiment in your 3-RCT paper is, as far as I am concerned, dispositive. I also agree that the thing we need now is an assessment of the correlation between, on the one hand, attitudes, intentions, and self-reported outcomes, and objectively measured outcomes on the other.
Apropos of this, if we have time and get more funding, I'd like to go back and code up attitudes or intentions outcomes from every paper in our dataset that has them and assess the overall within-study correlation between attitudes and behaviors (even if self-reported). At least then we know how well the Knowledge-Attitude-Practice model holds for this literature, which is another way of saying, when we alter stated attitudes, are we influencing behaviors down the line? Another paper I just wrapped up found very little on this front.
No systematic searches yet, and a discarded draft had a little quip about why: "Ordinarily, this is where a meta-analysis tells you about an exhaustive search of many different databases, reports on how many abstracts the team read, and then how many papers they ended up with. We, however, don’t have a team of RAs to help with this, so we took a slightly more indirect approach." I'm going to put this off for as long as possible because I also think it won't be that fruitful, but if an editor or peer reviewer asks, we'll hop to it 😃
edit: the following reply is based on a misread -- I thought Maya was saying that the conversion didn't work for binary outcomes, but she was saying that it didn't work for continuous outcomes and a binary treatment. (She was perfectly clear, I was reading too fast.) So the remainder of this section is not apropos of Maya's question, and is now a de facto appendix on an unrelated question, which is how do we convert binary outcomes into Glass's ∆. Thank you for this, I should have specified (and will now modify the paper to say) that this applies, roughly, to **continuous** normally distributed outcomes. For binary DVs, our procedure is to treat outcomes as draws from a Bernoulli distribution whose variance is $p * (1-p)$, where p is the proportion of some event, and the standard deviation is the square root of variance. So our estimator is Δ=p1−p2√p2∗(1−p2) So, as you noted, the correspondence between ∆ and real-life effect size depends on the underlying variance. But for reference sake, if 50% of people in the control group order a meat-free meal and 60% do in the treatment group, ∆ = (0.6 - 0.5) / sqrt(0.5 * 0.5) = 0.1 /0.5 = 0.2. If the numbers are 20% in the treatment group and 10% in control, ∆ = (0.2 - 0.1) / sqrt(0.1 * 0.9) = 0.1 / 0.3 = 0.333.
This estimator has the nice property that the computed effect size grows larger as variance grows smaller, as opposed to converting from odds ratios to ∆. As Robin Gomila writes, any given odds ratio "can translate into different Cohen’s d values, depending on the probability'' of event incidence for the "dependent variable for control group participants'' (p. 8).
I believe this is the first time I/we have proposed this estimator to an actual statistician, WDYT?
Thanks so much for the thoughtful and interesting response, and I’m honored to hear that the 2021 papers helped lead into this. Cumulative science at work!
I fully agree. Our study was at best comparing a measure with presumably less social desirability bias to one with presumably more, and lacked any gold-standard benchmark. In any case, it was also only one particular intervention and setting. I think your proposed exercise of coding attitude and intention measures for each study would be very valuable. A while back, we had tossed around some similar ideas in my lab. I’d be happy to chat offline about how we could try to help support you in this project, if that would be helpful.
Makes sense.
For binary outcomes, yes, I think your analog to delta is reasonable. Often these proportion-involving estimates are not normal across studies, but that’s easy enough to deal with using robust meta-analysis or log-transforms, etc. I guess you approximated the variance of this estimate with the delta method or similar, which makes sense. For continuous outcomes, this actually was the case I was referring to (a binary treatment X and continuous outcome Y), since that is the setting where the d-to-r conversion I cited holds. Below is an MWE in R, and please do let me know if I’ve misinterpreted what you were proposing. I hope not to give the impression of harping on a very minor point – again, I found your analysis very thoughtful and rigorous throughout; I’m just indulging a personal interest in effect-size conversions.
Thanks again, Seth!
Maya
library(dplyr)
# sample size
N = 10^5
# population parameter
delta = .3
# assume same SD conditional on X=0 and X=1 so that Glass = Cohen
sd.within = .5
# E[Y | X=0] and E[Y | X=1]
m0 = .5
m1 = m0 + delta*sd.within
# generate data
d = data.frame( X = c( rep(0, N/2), rep(1, N/2) ) )
You are 100% right about this, my mistake. First, I read your first comment too fast (I placed 'binary' on the wrong side of the equation, as you noticed), and second, I think that the original paragraph confuses percentage change with percentile change. I removed the section.
I still want the final draft to present some intuitive, drawing-on-stats-that-we-learned-in-HS way to put standardized mean effect sizes into impact estimate terms, but I think we need to think more about this.
Thanks for engaging! FWIW I ran through your code and everything makes sense to me
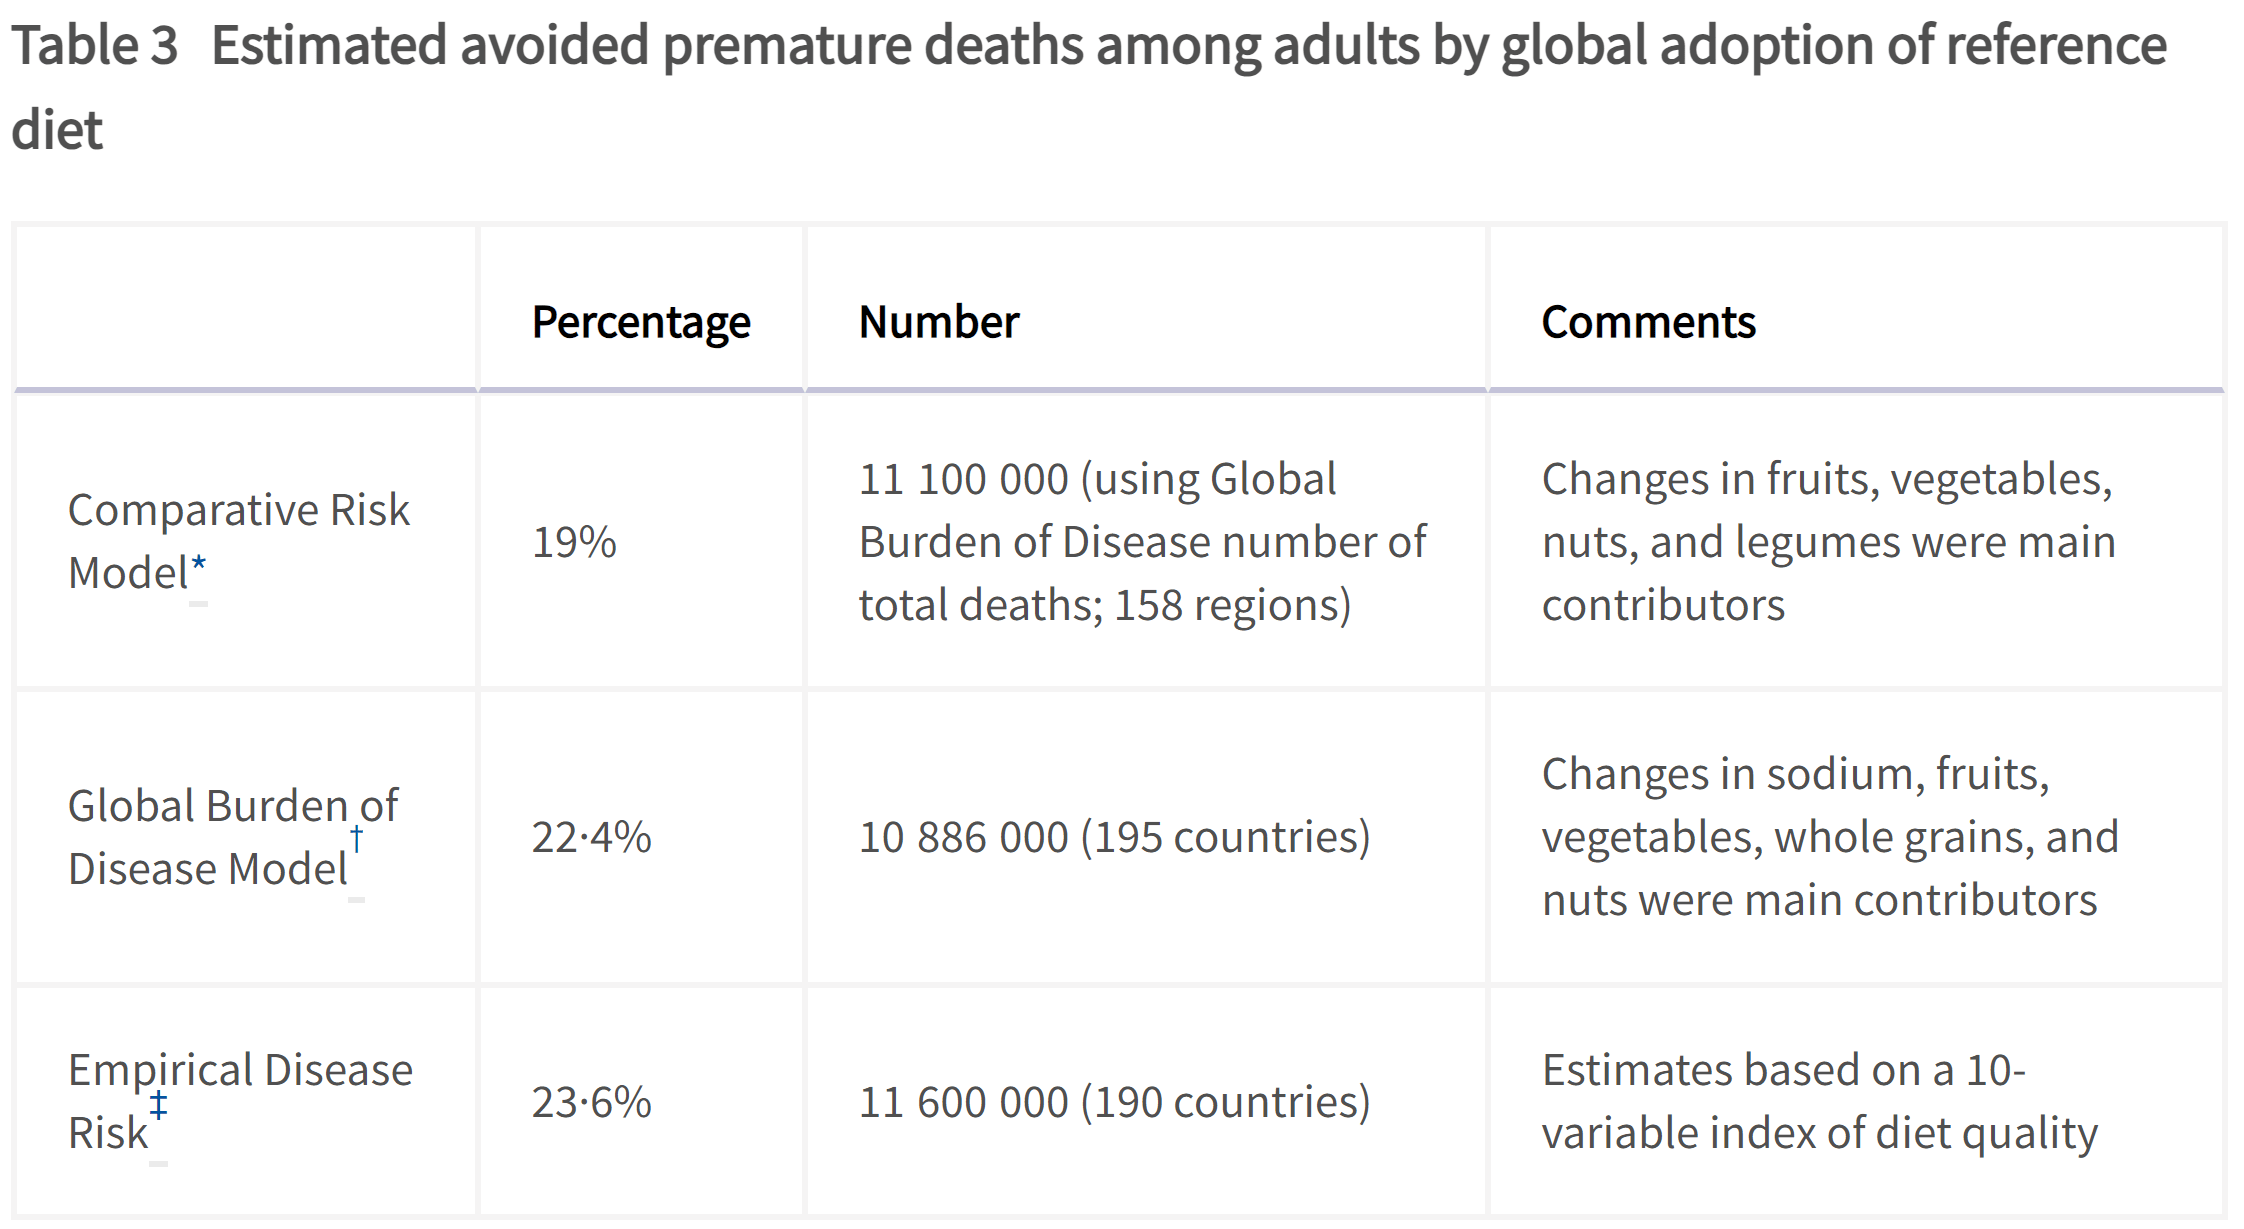
Related to the healt benefits, based on an analysis from the EAT-Lancet Commision, it looks like the global adoption of a predominantly plant-based healthy diet (described in Table 1) would decrease premature deaths of adults by 21.7 % (= (0.19 + 0.224 + 0.236)/3).
Wow that’s a very large number! I shall take a look at the paper, thank you. My first thought is that I don’t think 1/5 premature deaths is attributable to MAP — overeating, maybe, but that could be true of plant-based diets too.
You are welcome; I thought you might be interested!
Wow that’s a very large number!
As another data point, according to this systematic analysis, "in 2017, 11 million (95% uncertainty interval [UI] 10–12) deaths and 255 million (234–274) DALYs were attributable to dietary risk factors". That is 19.3 % (= 11/56.97) of the deaths in 2017, which is similar to the estimates of the EAT-Lancet Commision.
My first thought is that I don’t think 1/5 premature deaths is attributable to MAP
From the table above, the main contributors to decreasing premature adult deaths by 1/5 are decreased consumption of sodium, and increased consumption of fruits, vegetables, whole grains and nuts (see Figure 3 below). However, these changes also happen to some extent as a result of eating less animals (one has to get calories from something else), and their reference diet only has 13.6 % (= (153 + 15 + 15 + 62 + 19 + 40 + 36)/2500; see Table 1) calories coming from animal sources.
For reference, CEARCH did a shallow analysis of policy advocacy to promote greater consumption of fruits and vegetables.
Another finding I’ve seen is that widespread adoption of a plant-based diet would save ~3.3% of global GDP per year due to healthcare savings. That study also suggest a 6-10% reduction in global mortality, though I think these types of findings are necessarily pretty speculative and contingent on assumptions.
Thanks for reaching out and for including a nice note about our experiment.
A small typo you may want to fix: In our field study, no meals were sold because they were free at an event. We used this field study to establish ecological validity and then scaled the study by repeating the experiment design in an online experiment
A few more notes:
You have a subsection about how online studies have much smaller effect sizes than field studies. Is this the case in other behavioral sciences? I suggest you make a comparison.
Especially for when you write this for a journal, I suggest including motivation for the works you cover in the introduction. Why is transitioning away from MAP important?
Overall, I don't find directly comparing the effect sizes of the various studies compelling because the studies differ across so many dimensions - region, intervention type, student vs non-student population, online vs field studies - and as you mention, publication bias is a concern.
I think what is needed are studies that compare different types of interventions within the same study population. For example, imagine a study where a random subset of the participants receive an intervention highlighting how a vegan meal has a lower price, and another random subset of participants receive an intervention highlighting how a vegan meal has a lower carbon impact.
Best of luck with the project! This work is important!
(The following is a lightly edited version of an email I sent to Alex earlier this weekend)
I just fixed that typo, TY [I actually fixed it in draft on Saturday and forgot to implement]
1. Comparing online to IRL studies -- I will think about how to integrate, e.g. a study that finds similar results wr.t. the effects of intergroup contact on prejudice, but I'm not sure how much this generalizes across the behavioral sciences.
2. You're right about motivations; for the EA forum and a preprint I think we can take for granted that people agree that we should collectively eat fewer animal products, and truth be told I'm not sure what kind of journal we're going to aim for yet, so we left that kind of underspecified.
3. There are some studies that compare multiple strategies within one sample! See Feltz et al. (2022), Norris (2014) and Piester et al. (2022), though admittedly these are generally trying to test multiple implementations of one theoretical perspective, as opposed to your idea which puts the theoretical approaches head to head. I also think that's promising. I am soon to put a research agenda on this subject together and I will think about how to incorporate that.
Thanks for engaging as always!
P.S. I went to a lovely vegan donut shop in Beacon this weekend and the person working there mentioned that they don't always emphasize the vegan labels for certain customers because of the mixed connotations. Then again, a lot of the vegan places near me have vegan in their name --seasoned vegan, slutty vegan, and next stop vegan come to mind. This is probably a regional/NYC thing but still something I've been more on the look out for since reading your paper.
Environmental & health appeals are the most effective vegan outreach strategies — EA Forum
Environmental & health appeals are the most effective vegan outreach strategies
I used AI to fix transcription errors, rerrarange the ideas, and suggest tweaks to the title and some sentences.
Three of the most exciting projects to come out of EA in recent years are, in a vague sense, CEA spinouts:
* Kairos is directly a spinout of CEA and now handles most support for university AI safety groups. Basically everyone I've found who knows them is really excited about what they do
* NEST is an opinionated ideas-fi...
This post presents the executive summary from Giving What We Can’s impact evaluation for 2025. At the end of this post we share links to more information, including the full report and...
This post evolved into a aper published here and summarized here. We recommend you check out the updated summary because our conclusions have changed quite a bit.
Abstract
What interventions for reducing consumption of meat and animal products (MAP) have been tested and validated in the scientific literature, and what theories of change drive the most effective interventions? We address these questions with a theoretical review and meta-analysis. We find that appeals to environmental and health concerns most reliably reduce MAP consumption, while appeals to animal welfare, studies administered online, and choice architecture/nudging studies generally do not produce meaningful effects. We then outline eight areas where more research is needed and five promising interventions that have yet to be rigorously tested.
A previous review by Mathur et al. (2021 b) called on future MAP research to feature “direct behavioral outcomes” and “long-term follow-up.” Our paper shares those commitments. Therefore, while our review is theoretically comprehensive, our meta-analysis looks exclusively at randomized controlled trials (RCTs), for well-understood reasons, that meet the following quality criteria:
Measurements of actual consumption of animal products, rather than (or in addition to) measures of attitudes, behavioral intentions, or hypothetical choices.
At least 25 subjects in treatment and control groups or, for cluster-randomized studies, at least 10 clusters in total.
At least a single day separating the onset of treatment from outcome measurement. This helps identify effects that endure beyond the length of a single interaction and also helps to mitigate experimenter demand effects.
We also required that the full papers be available on the internet, rather than just a summary or abstract, and written in English. We identified 42 such interventions published in 28 papers or technical reports.
By our count, there have been 21 narrative reviews, systematic reviews, book chapters, and meta-analyses that either focus or touch on MAP reduction from 2017 onwards (See section 2, table 1 for an overview). However, past reviews are either A) organizedaroundparticulartheoriesofchange, rather than comprehensive of all literature; B) a few years outofdate, which means they miss importantrecentpapers; and/or C) notquantitative. Further, while some previous reviews noted heterogeneity in research quality, none made this a major focus. Our paper therefore fills three gaps. First, it is theoretically comprehensive. Second, it offers quantitative meta-analysis. Third, it focuses on the subset of studies whose designs credibly license causal inference on the key quantity of interest.
The remainder of this article proceeds as follows. Section 2 reviews how we assembled our database of policy-relevant MAP reduction research. Section 3 provides an overview of the findings of the six major strands of this literature. Section 4 describes our analytic methods. Section 5 meta-analyzes the assembled studies. Section 6 discusses what we know works, what we know does not work, areas where more research is needed, and promising theories and strategies that have yet to be rigorously tested. Section 7 concludes with proposed next steps for this paper.
2. Assembling the database
First, Benny knew a lot of relevant research because of his work at Allied Scholars for Animal Protection. We read those studies as well as all relevant studies cited in their bibliographies.
Table 1 provides an overview of 21 previous systematic reviews, narrative reviews, meta-analyses, and book chapters that touch on reducing MAP consumption.
Interventions targeting conscious determinants of human behavior to reduce the demand for meat: a systematic review with qualitative comparative analysis
Conscious determinants of eating meat
Systematic review
Mixed results, though appeals to health appear to change intentions
Restructuring physical micro-environments to reduce the demand for meat: a systematic review and qualitative comparative analysis
Choice architecture
Systematic review
Very mixed results, nothing conclusive mostly because of wide range of methods and rigor, though making vegetarian meals more salient and accessible seems to have effects
Effectiveness of Strategies to Decrease Animal-Sourced Protein and/or Increase Plant-Sourced Protein in Foodservice Settings: A Systematic Literature Review
Interventions aimed at decreasing animal protein and/or increasing plant protein in foodservice settings
Systematic review
Menu labeling, prompting at the point of sale, and redesigning menus, recipes, and service increased uptake of target foods
Interventions to reduce meat consumption in OECD countries: an understanding of differences in success
Behavioral interventions for meat consumption reduction
Systematic review
Influencing thoughts about the positive effects of reduction, making sbustitutes available, and tailoring interventions to gender and consumer segments are effective strategies
Measuring what works: quantifying greenhouse gas emission reductions of behavioral interventions to reduce driving, meat consumption, and household energy use
Behavior change for GHG emissions reduction
Narrative review
Nudges, such as defaults, work to reduce meat consumption
Broadly, the literature we’ve found falls into six conceptual buckets (see section 3.1 for an overview of our search process). The first three are about direct persuasion efforts. These interventions share a presumption that people’s conscious concerns have primacy in their eating choices, and thus appeal to concerns about 1) animal welfare, 2) health, and/or 3) environmental impacts and sustainability.
The second set of theories are about indirect persuasion efforts. These approaches share a presumption that indirect cues strongly influence our eating behavior, whether by manipulating our physical environment, incentives, or sense of self. The three constituent theories here are:
behavioral economics approaches (also called “nudges” or “choice architecture”) that, for example, make meat-free choices more salient or physically accessible, or increase the proportion of vegetarian meals sold in cafeterias;
economic interventions which manipulate incentives, for instance by making meat more expensive or meat alternatives less expensive;
psychological interventions which typically appeal to (and sometimes manipulate) people’s sense of norms.
Some studies combined multiple theories of change, e.g. presented information about both the health and environmental reasons for eating less meat (Jalil et al. 2023) or an appeal to psychological norms alongside a visual ranking of meal choices by their environmental impacts (Piester et al. 2020).
These studies share a commitment to the idea that people are motivated by animal welfare concerns, but otherwise draw from different disciplines, theories of change, and information mediums. However, as Mathur et al. (2021 b) note, social desirability bias in this literature is likely “widespread.” The typical study in this literature tries to persuade people that eating meat is morally unacceptable, often by confronting them with upsetting footage from factory farms, and then asks them a few weeks later how much meat they ate in the past week. Experimenter demand effects are likely.
Two studies in this strand meet our inclusion criteria andalso measure outcomes unobtrusively. The first is Haile et al. (2021), who distributed pro-vegan pamphlets on a college campus, tracked what students ate at their dining halls and find that “the pamphlet had no statistically significant long-term aggregate effects.” The second is Epperson and Gerster (2021), which shows that a “360° video about the living conditions of pigs in intensive farming via a virtual reality (VR) headset” led to a 6-9% reduction in purchased meals that contained meat in university canteens.
3.2 Appeals to health
Health concerns motivate 9 of 42 interventions in our database. These studies are often conducted and/or written by medical doctors. For example, Emmons et al. (2005 a) assigned individuals who had received a “diagnosis of adenomatous colorectal polyps” (which are potentially precancerous) to either a usual care condition or a tailored intervention that provided counseling and materials on risk factors for colorectal cancer, “including red meat consumption, fruit and vegetable intake, multivitamin intake, alcohol, smoking, and physical inactivity.” The outcome variable was self-reported servings of red meat per week measured at an 8-month follow-up, which the authors dichotomized into “more than three servings per week of red meat” or not. Overall, there was an 18% reduction in this outcome for the treatment group and a 12% reduction for the usual care condition.
One challenge to integrating these results into our database is that they often focus on red meat and/or processed meat consumption rather than MAP as a whole. There is a risk, therefore, that these interventions might induce substitution towards other animal-based products. Klöckner & Ofstad (2017), for example, recommended that subjects “substitute beef with other meats or fish,” which are arguably worse for animal welfare on a per-ounce-of-meatbasis (see Mathur 2022 for further discussion). We did not include this study in our meta-analytic database because we cannot clearly deduce its overall effect on MAP consumption. However, we included all red and/or processed meat consumption studies that did not specifically argue for switching to other MAP products. (See Matt-Navarro and Sparkman (forthcoming) for research targeting fish consumption.)
3.3 Appeals to the environment
These studies focus on the environmental harms of consuming animal products and/or promote plant-based alternatives as a more sustainable option. This framing informs 9 of 42 interventions in our database. Environmental arguments are communicated in a plethora of ways, including leaflets, signs in college cafeterias, op-eds, daily reminder text messages, and in-class lectures.
The landmark study in this branch of the literature is Jalil et al. (2023), who randomly assigned undergraduate classes to hear a “50 min talk about the role of meat consumption in global warming, along with information about the health benefits of reduced meat consumption,” and then measured their subsequent food choices at the college’s dining facilities. Overall, they find that students in the treatment group “reduced their meat consumption by 5.6 percentage points with no signs of reversal over 3 years.” No other study in this literature shows well-identified effects enduring this long.
3.4 Behavioral economics: nudges and choice architecture
This literature features some creative interventions that target realistic theories of change but also some startling design limitations. The most concerning is the use of hypothetical outcomes. For instance, Campbell-Arvai, Arvai, and Kalof (2017) intercepted college students on their way to a dining hall “under the pretence of completing a survey about their food preferences,” then led them “to a small conference room” where they were presented with different configurations of menus whose items were selected from options at the dining hall. Students told researchers which food they preferred and then left to go eat their meal, which the researchers did not track. As the authors themselves put it, this design might “be critiqued for not providing actual food choices and thus lacking any real consequences.” Along the same lines, Bacon and Krpap (2018) asked MTurk participants to “imagine a scenario in which they were catching up with a friend for dinner in a nice restaurant one evening during the week…they were also presented with an image of a cozy table in a restaurant.” The main outcome was probability of selecting a vegetarian option from a hypothetical menu.
Second, some of these studies feature a large number of subjects but assign treatment at the level of a restaurant or dining hall and include too few units for meaningful analysis. McClain et al. 2013 and Reinders et al. 2017, for instance, test plausible theories of change in a college cafeteria and a chain of restaurants, respectively, but had just 2 and 3 units in their respective treatment arms. Both studies did not meet our inclusion criteria but offer plausible theories and promising designs for future replications. Another very nice study (Berke and Larson 2023) randomly assigns folks who are attending an MIT Media lab event, which serves free food, to see either a menu with vegan/vegetarian labels or no labels (all meals were vegetarian or vegan); the authors find that labels significantly decrease the proportion of vegan meals selected. We did not include this study because it lacks delayed outcomes, but we find its underlying theory very plausible.
See Bianchi (2018 b) for a thorough review of choice architecture interventions.
3.5 Conventional economics: price manipulations
Economic manipulations seek to alter the explicit incentives behind MAP consumption. This is an underdeveloped body of research, informing just 1 of 42 interventions in our database. That study (BIanchi 2022) provides free meat-free substitutes to participants, along with “information leaflets about the health and environmental benefits of eating less meat,” recipes, and success stories from people who reduced their meat consumption. Four weeks after the intervention concluded, treated subjects reported that they ate an average of 38 grams less meat per day than those in the control group (about 11 oz per week).
Two studies in this field presented interesting, plausible theories of change but had design limitations that led us to exclude them from our meta-analysis. First, Vermeer et al. (2010) surveyed people at a fast food restaurant and contrasted two pricing schemes, one where larger sizes were cheaper on a per-ounce basis and one where price-per-ounce was held constant. They found no effect on consumers’ intended portion size purchases, but the real prices were not altered and no real food purchases were measured. As the authors note, “[m]ore research in realistic settings with actual behaviour as outcome measure is required.” Second, Garnett et al. (2021) introduced a small price change at a “college cafeteria in the University of Cambridge (UK), introducing a small change to the price of vegetarian meals (decreased by 20p from £2.05 to £1.85) and meat meals (increased by 20p from £2.52 to £2.72).” The intervention had no main effect on meat sales but increased sales of vegetarian meals by 3.2%. However, treatment and control had just one cluster apiece. This study is an excellent candidate for replication.
A strong study in this category is Sparkman and Walton (2017), who presented people waiting in line at a Stanford cafeteria the opportunity to participate in a 'survey' in exchange for a meal coupon, where the survey presented one of two norms-based messages: a 'static' message about how "30% of Americans make an effort to limit their meat consumption," or a dynamic message emphasizing how behavior is changing over time and that vegetarianism is taking off among participants' peers. The authors find that 17% of participants in the static group ordered a meatless lunch vs. 23% in the control group and 34% in the dynamic norm group.
For an overview of psychological theories of vegetarianism, see Rosenfeld (2018).
4 Meta-analytic methods
For primers on reading and writing meta-analyses, see Frank et al. 2023, chapter 16, or Lakens 2022, chapter 11.
4.1 Coding the database
Condensing an intervention to an estimate of average treatment effect and associated variance sometimes involves judgment calls. Here are the general guidelines we followed:
We take the outcome that most clearly maps to changes in actual consumption behavior.
We take the latest possible outcome to test for the presence of enduring effects, and our sample sizes are taken from the same measurement wave.
For cluster-assigned treatments, our Ns are the number of clusters rather than participants. This includes studies that cluster by day (e.g. everyone who comes to a restaurant on some day gets treated).
We convert all effect sizes to estimates of standardized mean differences: Average Treatment Effect (ATE) / standard deviation (SD).
When possible, we calculate ATE using difference in differences((TT2−TT1)−(CT2−CT1)), which we prefer to difference in means (TT2−CT2) because it leads to more precise estimates. When pretest scores aren’t available, we use difference in means.
When possible, we standardize by the SD of the control group, a measure called Glass’s Delta (written as ∆). We prefer Glass’s Delta to Cohen’s d, a measure that standardizes by the SD of the entire sample, because we want to to avoid any additional assumptions about equivalence of variance between treatment and control groups. When we don’t have enough information to calculate ∆, we use d.
When authors tell us that results were “not significant” but don’t specify more precisely, we call the effect type "unspecified null" and record it as ∆ = 0.01.
4.2 Meta-analytic methods
Our meta-analysis employs a random effects model rather than a fixed effects model, for reasons explained here. Our code mainly uses functions from the metafor and tidyverse packages in R as well as some custom wrappers that Seth wrote for previous meta-analyses.
The coefficients we report are:
Glass’s Delta (∆), which indicates a meta-analytic estimate: a weighted average of many point estimates, where larger, more precisely estimated studies influence the average proportionally more than smaller ones.
Beta (β), a regression coefficient. Linear regression tells you E(Y | X), i.e. for some value of X (or many Xs), the expected value of Y. We report this coefficient when we discuss publication bias or the effects associated with covariates.
SE (standard error) is the standard deviation of the sampling distribution, e.g. ∆ or β. Smaller standard errors mean more precise estimates.
Section 5.1 provides descriptive statistics about our database. Sections 5.2-5.8 are our pre-registered analyses reported in the order we originally intended. Sections 5.9 and 5.10 are exploratory analyses we came up with after writing our pre-analysis plan.
5.1 Descriptive overview of the database
Our database comprises 28 papers that detail 42 interventions. For interventions with assignment at the level of the individual, the average sample size is 427 participants, and the average cluster-assigned intervention has 64 clusters (the equivalent median numbers are 214 and 54, respectively).
Twenty-seven interventions take place exclusively in the United States — 20 in person and 7 online with US participants. An additional seven take place in the United Kingdom and three take place in Italy. Australia, Germany, and Canada have one intervention each, while one multisite intervention takes place in the UK, Germany, and, Australia, and one intervention recruits internet participants in the US, UK, Canada, Australia, and “other.”
Twenty-six interventions take place at colleges or universities, while twelve look at adults (18+), and one specifically looks at older adults (40+). One intervention looks at people of all ages (including children), while one looks at women ages 13-25. Sixteen interventions take place on a US college campus.
23 of 42 outcomes are self-reported. These range in granularity from reporting whether subjects had ≤ 3 servings of red meat in a given week (Sorensen et al. 2005) to food questionnaires asking participants to recall everything they recently ate, e.g. in the past 24 hours (Feltz et al. 2022) or the past week (Mathur et al. 2021 a).
The 19 outcomes that are not self-reported are typically recorded at a restaurant or college dining hall. Most are straightforward records of how many meals sold did or did not have meat (Coker et al. 2022, Garnett et al. 2020). By contrast, Piester et al. (2020) affixed menus with “images of zero to five leaves, with more leaves indicating greater sustainability” and then compared the average leaf ratings of meals purchased by the treatment and control groups.
5.2 Overall effect
The overall effect of this literature is small, but statistically significant and precisely estimated: ∆ = 0.131 (SE = 0.03), p < 0.0001. By convention, ∆ = 0.2 is considered to be a “small” effect size, though see Funder and Ozer (2019) for critical discussion.
Another way to consider these results is to take these papers at their word on whether they produced backlash, null, or positive results. Across the 42 interventions reviewed here, 21 report positive, statistically significant results and 16 report null results. However, we don’t observe meaningful backlash effects. Although 5 of 42 interventions report more MAP consumption in the treatment group than in the control, none of these effects were statistically or substantively significant.
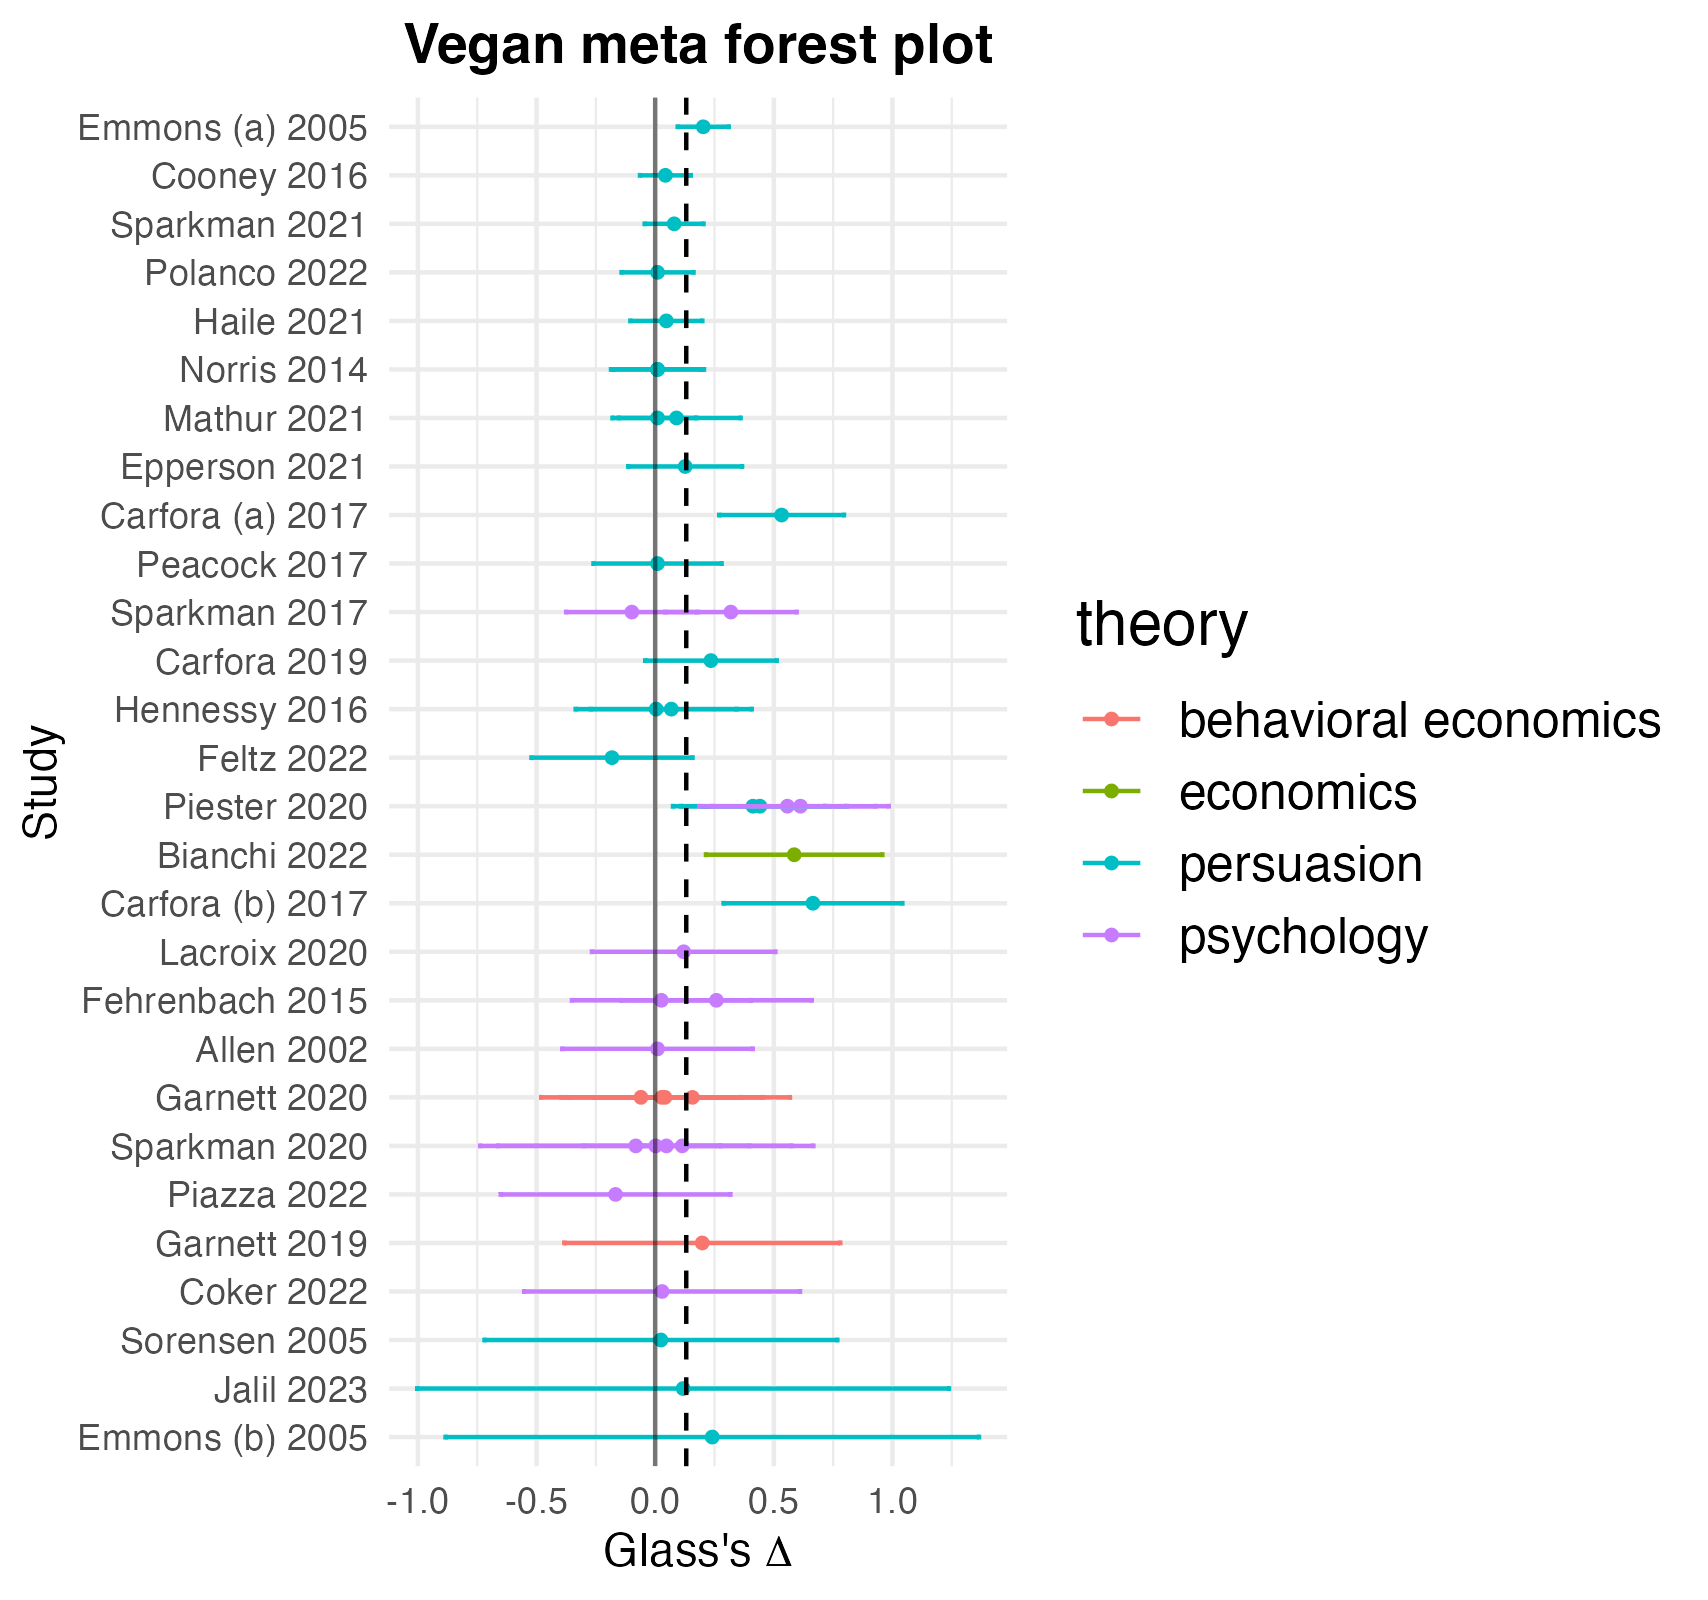
Figure 1 presents these results graphically.
Figure 1: Meta-analysis forest plot. Each dot is a point estimate from an intervention, clustered by the paper it was published in. The lines to their sides correspond to 95% confidence intervals. Studies are color-coded by their underlying academic theory, with animal welfare, health, and environmental appeals all grouped together as “persuasion” (persuasion studies often appeal on multiple angles at once, with no clear hierarchy between them, which makes coding them at the level of persuasion content tricky). The dark black line is an effect size of 0 and the dotted line is the effect size we actually observe.
We find mixed, inconclusive evidence on publication bias. First, as noted before, half of the interventions in our dataset yield null or negative results, which suggests that insignificant and null findings in this literature are able to see the light of day. Second, the relationship between standard error and effect size is small and insignificant: β = -0.0236 (SE = 0.292). (This essentially means that smaller, noisier studies have not been contradicted by larger, better-powered results.)
We do, however, find a moderate though statistically insignificant relationship between a paper’s having a DOI (digital object identifier), which generally means that it has been published in an academic journal, and effect size: β = 0.11382 (SE = 0.07635). In our dataset, the thirty interventions from papers with a DOI have an meta-analytic effect of ∆ = 0.175 (SE = 0.041), p = 0.0002 while the ten studies without a DOI have a meta-analytic effect of ∆ = 0.038 (SE = 0.012), p = 0.009. This might suggest that a study needs to have positive results to be published in a peer-reviewed journal. However, we don’t read too much into this, because many of the studies without DOIs are published by vegan advocacy organizations such as Faunalytics, The Humane League, and Mercy for Animals, which, to their credit, publicize their null results, and sometimes critically re-examine their own findings.
5.4 Differences by assignment, theory and self-report
5.4.1 Cluster-assigned interventions show smaller effects on average
The 14 interventions where treatment is cluster-assigned show much smaller effects on average: ∆ = 0.036 (SE = 0.025), p = 0.181, versus ∆ = 0.57 (SE = 0.037), p = 0.0002 for the 28 interventions where treatment was assigned at the level of the individual.
5.4.2 There are large differences in efficacy between theoretical approaches
Table 2 presents, for each of the six theoretical approaches outlined in section 3, the number of constituent interventions, the average meta-analytic effect, the standard error of that estimate, and stars corresponding to that estimate’s statistical significance. Note that the total N of these categories won’t equal 42, because some interventions combine multiple theoretical approaches.
Category
N (interventions)
Meta-analytic estimate (∆)
Standard Error
Animal welfare appeals
13
0.037*
0.011
Health appeals
11
0.259**
0.075
Environmental appeals
9
0.274**
0.080
Choice architecture/nudges
5
0.061
0.043
Economic incentives
1
0.586***
0.190
Psychological appeals
14
0.147*
0.062
Table 2: differences in effect size by theoretical approach. * < .05; ** < .01; *** < .001.
Based on these results, it seems that appeals to animal welfare are the least effective category of interventions. Likewise, the aggregated effect of the choice architecture approach is substantively small and not statistically significant. Psychological appeals also do not meet the conventional standard for a ‘small’ effect size in the behavioral sciences.
The most robust evidence for changing habits comes from appeals to health and the environment. Here, a reasonably sized collection of studies suggests a small but precisely estimated effect on MAP consumption. Last, manipulating economic incentives seems to produce the largest effects, but this is not a robust finding as it is drawn from just one paper.
5.4.3 The effects of self-reported outcomes
In a finding that very much surprised us, self-reported outcomes are systematically smaller than those measured obliquely.
Category
N (interventions)
Meta-analytic estimate (∆)
Standard Error
Self-reported outcomes
23
0.11**
0.037
Objectively measured outcomes
19
0.167**
0.049
Table 3: differences between self-reported and obliquely reported outcomes. * < .05; ** < .01; *** < .001.
Taking these results at face value, social desirability bias is much less of a concern in this literature than we had believed. This point merits more thinking.
5.5 Do leaflet studies work?
Four interventions in our dataset test leafleting and find an overall effect of ∆ = 0.038 (SE = 0.011), p = 0.0377. Based on this finding, leafleting is not an effective tactic.
5.6 How do studies administered online compare to in-person studies?
The eight interventions administered online have an average meta-analytic effect of ∆ = 0.048 (SE = 0.013), p = 0.008. By contrast, the 34 interventions conducted in person have an average meta-analytic effect of ∆ = 0.166 (SE = 0.013), p = 0.008. In other words, in-person interventions are about 3.45 times more effective than those administered online; but if an online intervention could reach four people for the price it would take to reach one in person, then online distribution might be more cost-effective. Nevertheless, ∆ = 0.048 is so small that we think this line of work is not fruitful.
5.7 Any relationship between delay and outcome?
Days of delay between treatment and measurement has essentially zero relationship with effect size: β = -0.00002.
5.8 What about publication date?
Effect sizes seem to be getting smaller every decade. The four interventions published in the first decade of this millennium have an average meta-analytic effect of ∆ = 0.187, compared to ∆ = 0.143 for the 14 studies published in the 2010s and ∆ = 0.123 for the 24 studies published from 2020 onwards. One interpretation for this finding is that contemporary studies tend to be more credibly designed and implemented, and post-credibilityrevolution studies are more likely to find smaller but more replicable results.
The analyses we present below were not pre-registered but struck us as interesting questions while working on the analysis.
5.9 Effects on college students vs. adults vs. other populations
Table 4 presents the average meta-analytic effects for college students, adults, and other populations (comprising two interventions, one with women ages 13-25 years and one with people of all ages).
Category
N (interventions)
Meta-analytic estimate (∆)
Standard Error
College Students
26
0.171**
0.048
Adults
14
0.092*
0.033
Other
2
0.043*
0.001
Table 4: Differences in effect size by population. * < .05; ** < .01; *** < .001.
These results suggest that extant interventions produce the largest changes for university students.
5.10 Effects by region
Table 5 presents the meta-analytic results of studies in the United States, the United Kingdom, Italy, and everywhere else:
Country
N (interventions)
Meta-analytic estimate (∆)
Standard Error
United States
28
0.097**
0.026
United Kingdom
7
0.156
0.098
Italy
3
0.459
0.124
Everywhere else
4
0.068
0.051
Table 5: differences in effect size by location. * < .05; ** < .01; *** < .001.
These results surprised us: we don’t have a clear theory for why studies in Italy showed the largest effects and studies in the US showed comparatively small results. However, we don’t read much into this because of the small Ns for the non-US categories.
6 Discussion
Overall, we’re optimistic about the state of MAP reduction research.
On the one hand, we need more credible empirical work. With just 28 papers and 42 interventions meeting pretty minimal quality standards, nothing in our analysis should be considered especially well-validated. On the other hand, recent MAP reduction papers tend to bring careful, design-based approaches to the problems of measurement validity, social desirability bias, and verisimilitude. The trend, therefore, is towards increasingly credible work. However, even the best of these studies would benefit from out-of-sample replication to help us understand where and for whom the most promising interventions work.
6.1 What works to reduce MAP consumption?
In general, appeals to health and the environment appear to reduce MAP consumption, albeit not by very large amounts. Moreover, we have a lot more confidence that these appeals work for college students than for the general population because of the results from Jalil et al. (2023). Still, we can only learn so much from one experiment at one college. We recommend replication and extension.
6.2 What doesn’t work to reduce MAP consumption?
Our review suggests that leafleting studies, studies administered online, appeals to animal welfare, and choice architecture/nudging studies generally do not move the needle on reducing MAP consumption.
We are disappointed by the lack of efficacy of appeals to animal welfare. We want people to care about animals and their needs for their own sake, not just whether eating them is good or bad for our health and welfare. It seems we have our work cut out for us in making that message persuasive.
Additionally, we find the lack of backlash effects on MAP consumption encouraging.
6.3 What we still don’t know
It is striking to us that there have been nearly as many papers aggregating and summarizing MAP reduction research — 22 including this one, with two more that we know of on the way — as there have been RCTs meeting minimal quality standards. Here are eight areas we hope to see illuminated by future work.
What interventions work to change behaviors for adults and children?
We lack rigorous evaluations of MAP reduction efforts in Latin America, Asia, and Africa.
Piester et al. (2020) find that food sustainability labels had a significant impact on women but very little impact on men. Should anti-MAP strategies generally be gender-tailored? (See Veul 2018 for further discussion.)
How much is animal welfare advocacy activating disgustavoidance vs. empathy for animals? e.g. If videos of farmed animal lives show especially squalid or pathogenic living conditions, or if pamphlets about dairy cows talk about the allowable level of blood and pus in milk products, which theoretical perspective are these interventions embodying, or could empathy and disgust be compared to one another?
Theoretically, we’d get equivalent impacts from causing 100 environmentally-conscious people to reduce their MAP consumption by 1% each and causing 1 omnivore to go fully vegan. However, the likely responders might be different populations. How do we tailor our messaging accordingly?
Because many of the studies that appeal to environmental and/or health concerns asked about red and/or processed meat consumption, we’re not sure that they reduce consumption of MAP in general. (The exception is Jalil et al. 2023, who measure effects on red meat, poultry, and fish.) What sorts of interventions might we design to improve the welfare of dairy cows, eggs-laying hens, or crustaceans?
What is the elasticity of demand for MAP? Our sample, unfortunately, does not allow us to estimate this — we would need many studies of price changes — but if we take the price, taste and convenience theory of change seriously, this is a critical parameter. It seems backwards that there have been many more behavioral economics studies on MAP consumption than well-identified economics studies. (See here and here for observational work on the subject).
A great starting point would be to replicate Garnett et al. (2021), with 1) treatment randomly altered at the level of a week rather than in chunks of 4-5 weeks; 2) for at least ten weeks total; and 3) at multiple sites/cafeterias.
Do changes to menus or restaurant layouts have effects on treated consumers a week or two later, rather than just the day of? Most studies with these designs only measure outcomes while treatment is being administered or during the control period, but we also care about lasting changes in habits.
We also note that while many studies in our dataset partnered with university dining halls, only one (Sparkman et al. 2020) partnered with a grocery/restaurant delivery or meal prep service (which “abruptly closed” in the middle of their experiment). We think this is a promising strategy for deploying large-scale interventions and measuring real-world behavior. Perhaps someone at the economics team at Instacart is interested in pursuing this?
6.4 Next steps for researchers: five promising theories of change that call for rigorous, large-scale testing
Intergroup contact. Broockman and Kalla (2016) show that a brief conversation about trans rights, with either a trans or cis canvasser, reduces transphobia for at least 3 months and increases support for a nondiscrimination law. Would a face-to-face conversation about vegan issues, either with a vegan or not, change eating behavior, and/or voting patterns on animal rights bills, e.g. Proposition 12 in California?
Extant research evaluating protests has generally measured attitudestowardprotests. What about effects on MAP consumption, either for witnesses or participants? Perhaps researchers can identify some mechanism that creates exogenous variation in whether people attend or witness a protest. Alternatively, researchers could randomly assign some on-the-fence participants free transport to a protest, and then send them a coupon to a meal delivery or grocery delivery service a month later and observe whether they select non-meat options.
What is the effect of high-intensity vegan meal planning? For instance, researchers could randomly assign 100 people to participate in https://www.swapmeat.co.uk, have them fill out periodic food diaries, and 3/6/9 months after, send them coupons to a grocery delivery service and observe their purchases.
Two intriguingpapers asks people to imagine contact with a farm animal and then gauge their attitudes and intentions. How about real contact with a farm animal or a visit to a farm sanctuary? For example, researchers could offer a lottery to students at SUNY New Paltz or Vassar for a free tour at Woodstock Farm Sanctuary, then mail them a coupon to a local cafe with vegan options and track their purchases.
Blind taste tests, e.g., have 100 people taste either meat or a meat alternative, then send them a coupon for either meat or the alternative and track what they buy.
7. Conclusion: next steps for this paper (and how you can help)
This post is effectively a pre-preprint of the academic article we aim to publish. You can help us with this in a few ways.
If you know of any studies we missed, please let us know!
Likewise, if you are a journal editor and you think your venue would be a good home for this project, please be in touch.
Thanks for reading. Comments and feedback are very welcome!
Statement on additional materials
Our analysis code, data, and pre-analysis plan are available on GitHub, including excluded_studies.csv, which lists the studies we considered but didn’t end up including, as well as a PDF of our appendices.
Our code and data are also available on Code Ocean, where they can be rerun from scratch in a frozen, code-compatible computational environment.
Acknowledgements
Thanks to Alex Berke, Alix Winter, Anson Berns, Hari Dandapani, Adin Richards, and Matt Lernerfor comments on an early draft. Thanks to Maya Mathur, Jacob Peacock, Andrew Jalil, Gregg Sparkman, Joshua Tasoff, Lucius Caviola, and Emma Garnett for helping us assemble the database and providing guidance on their studies.


Seth and Benny, many thanks for this extremely interesting and thought-provoking piece. This is a major contribution to the field. It is especially helpful to have the quantitative meta-analyses and meta-regressions; the typically low within-study power in this literature can obscure the picture in some other reviews that just count significant studies. It's also heartening to see how far this literature has come in the past few years in terms of measuring objective outcomes.
A few thoughts and questions:
1.) The meta-regression on self-reported vs. objectively measured outcomes is very interesting and, as you say, a little counter-intuitive. In a previous set of RCTs (Mathur 2021 in the forest plot), we found suggestive evidence of strong social desirability bias in the context of an online-administered documentary intervention. There, we only considered self-reported outcomes, but compared two types of outcomes: (1) stated intentions measured immediately (high potential for social desirability bias); vs. (2) reported consumption measured after 2 weeks (lower potential for social desirability bias). In light of your results, it could be that ours primarily reflected effects decaying over time, or genuine differences between intentions and behavior, more than pure social desirability bias. Methodologically, I think your findings point to the importance of head-to-head comparisons of self-reported vs. objective outcomes in studies that are capable of measuring both. If these findings continue to suggest little difference between these modes of outcome measurement, that would be great news for interpreting the existing literature using self-report measures and for doing future studies on the cheap, using self-report.
2.) Was there a systematic database search in addition to the thorough snowballing and manual searches? I kind of doubt that you would have found many additional studies this way, but this seems likely to come up in peer review if the paper is described as a systematic review.
3.) Very minor point: I think the argument about Glass delta = 0.3 corresponding to a 10% reduction in MAP consumption is not quite right. For a binary treatment X and continuous outcome Y, the relationship between Cohen’s d (not quite the same as Glass, as you say) and Pearson’s r is given by d = 2r / sqrt(1-r^2), such that d = 0.3 corresponds to r^2 (proportion of variance explained) = 0.02. Even so, the 2% of variation explained does not necessarily mean a 2% reduction in Y itself. Since Glass standardizes by only the control group SD, the same relationship will hold under equal SDs between the treatment and control group, and otherwise I do not think there will be a 1-1 relationship between delta and r.
Again, congratulations on this very well-conducted analysis, and best of luck with the journal submissions. I am very glad you are pursuing that.
Hi Maya,
Thank you very much for your kind words. Your two 2021 papers were big inspirations and guidance for this post.
Thank you for this, I should have specified (and will now modify the paper to say) that this applies, roughly, to **continuous** normally distributed outcomes. For binary DVs, our procedure is to treat outcomes as draws from a Bernoulli distribution whose variance is $p * (1-p)$, where p is the proportion of some event, and the standard deviation is the square root of variance. So our estimator is Δ=p1−p2√p2∗(1−p2) So, as you noted, the correspondence between ∆ and real-life effect size depends on the underlying variance. But for reference sake, if 50% of people in the control group order a meat-free meal and 60% do in the treatment group, ∆ = (0.6 - 0.5) / sqrt(0.5 * 0.5) = 0.1 /0.5 = 0.2. If the numbers are 20% in the treatment group and 10% in control, ∆ = (0.2 - 0.1) / sqrt(0.1 * 0.9) = 0.1 / 0.3 = 0.333.
Hi Seth,
Thanks so much for the thoughtful and interesting response, and I’m honored to hear that the 2021 papers helped lead into this. Cumulative science at work!
Thanks again, Seth!
Maya
You are 100% right about this, my mistake. First, I read your first comment too fast (I placed 'binary' on the wrong side of the equation, as you noticed), and second, I think that the original paragraph confuses percentage change with percentile change. I removed the section.
I still want the final draft to present some intuitive, drawing-on-stats-that-we-learned-in-HS way to put standardized mean effect sizes into impact estimate terms, but I think we need to think more about this.
Thanks for engaging! FWIW I ran through your code and everything makes sense to me
No worries. Effect-size conversions are very confusing. Thanks for doing this important project and for the exchange!