Comments
Note from Aaron: I've cross-posted this from GiveWell. They've posted further sources for this information on this page. Visit the original post to read the piece with embedded footnotes.
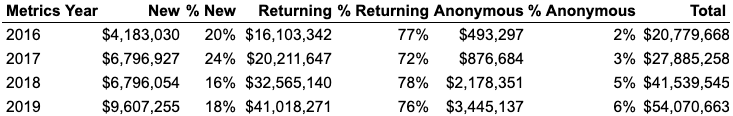
We see an early indication that GiveWell continued its trajectory of robust donor growth last year. The total value of donations processed by GiveWell increased 30% in 2019.
We’re sharing this data now because we believe it is an informative early update about our growth last year. However, GiveWell-processed donations don’t tell the full story of our impact. Many donors who rely on our research give via our partner organizations or directly to our top charities. Their gifts account for the majority of donations due to our work and are not processed by GiveWell. Information about these gifts is time-consuming to gather and has usually led us to release our metrics data many months after the end of the year. We plan to release a complete 2019 metrics report and assessment of our impact, including donations not processed by GiveWell, later this year.
Here’s what we know so far, based on the nearly complete information we have about donations we processed:
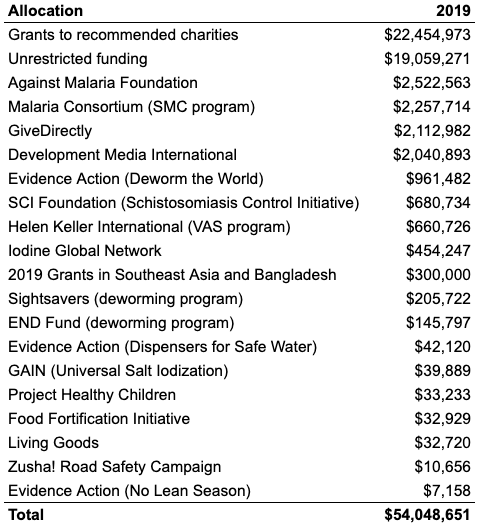
- We processed $54.1 million in donations in 2019. Sixty-five percent of this amount was restricted to our recommended charities and 35% was unrestricted, which we may use to support GiveWell’s operations.
- Support from donors giving $10,000 to $100,000 comprised the largest proportion of our growth (35%).
- Returning donors who gave more than last year made up 75% of our growth in funds donated (excluding anonymous donations).
- We believe that the majority of our growth was organic and would have occurred without any outreach and marketing efforts from GiveWell, although we can attribute some to specific outreach and marketing initiatives.
We’re encouraged by this growth and excited to write about it. We also discuss below some ways that GiveWell-processed donations could be a misleading indicator of our overall impact.
About GiveWell-processed donations
This is our first time releasing information on GiveWell-processed donations as a standalone post.
It is very time-consuming to gather and analyze information from the many disparate sources through which GiveWell donors can support GiveWell and our recommended charities. We have generally shared reports on donations due to our work quite late in the year as a result.
We do have nearly complete information at this point of the year on GiveWell-processed donations in 2019. We’re experimenting with sharing this information as an early look at our impact.
What is included in GiveWell-processed donations?
The $54.1 million only includes donations that we processed ourselves, such as gifts that were made by credit card on our website, bank transfers to GiveWell’s account, checks made out to GiveWell, and other options listed here.[7] It includes both restricted and unrestricted donations:
- Restricted: A donor tells us to use the gift for one or more of our top charities or for “Grants to recommended charities at GiveWell’s discretion,” which we allocate quarterly to the recommended charity or charities with the most pressing needs.
- Unrestricted: A donor does not place any restrictions on the donation. We may use the donation for GiveWell’s operations or grant it to charities.
The $54.1 million does not include gifts that were made directly to our recommended charities or via our partner organizations. Additional ways in which GiveWell-processed donations may not tell the full story of our impact are discussed below.
Our impact: donations we processed
Restricted donations: by donor size
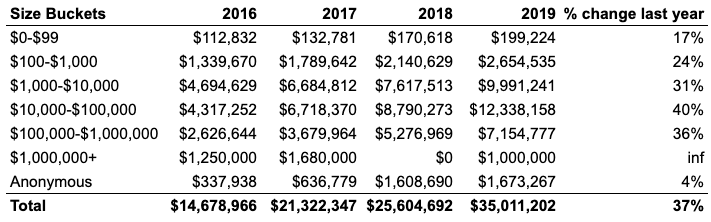
We saw strong growth in 2019 in restricted donations across donor size categories under $1 million. Most donors making restricted donations of $1 million or more give directly to our top charities and not through GiveWell; we discuss this in greater detail below.
Unrestricted donations: by donor size
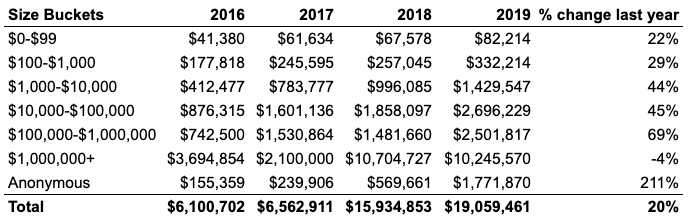
The largest absolute growth (just over $1 million) and relative growth (69%) in unrestricted donations was from donors giving between $100,000 and $1 million. We explain the slight decline in unrestricted donations from donors giving more than $1 million in the following footnote.
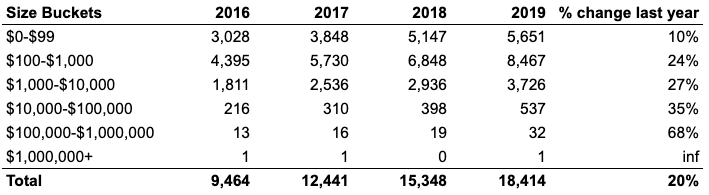
The total number of non-anonymous donors providing unrestricted gifts increased by 22%, with the strongest relative growth (34%) in the number of donors giving between $1,000 and $10,000.

New donors and returning donors
Returning donors increasing their donations drove approximately 75% of our growth in funds donated, excluding anonymous donations. Funds from new donors increased more than 40% over the previous year and accounted for approximately 25% of our total growth in non-anonymous funds donated.
How GiveWell-processed donations don’t tell the full story
While we see GiveWell-processed donations as an early indicator of strong growth, we have significant uncertainty about the final picture of our influence in 2019.
Donors giving over $1 million have tended to donate directly to our recommended charities rather than through GiveWell, and so are not well-represented in GiveWell-processed donations. They have also accounted for a large proportion of our impact each year as major contributors to our recommended charities. This group made up roughly one-third of our money moved to recommended charities in 2018, excluding donations from Open Philanthropy. Our best guess is that growth among donors giving under $1 million is related to growth among donors giving over $1 million—if more donors are giving to GiveWell in general, we think it’s likely that additional larger donors will find our work. However, we’re unsure of the extent to which 2019 donors who gave under $1 million are predictive of the 2019 donors who gave over $1 million directly to our recommended charities.
Another way in which GiveWell-processed donations could fail to predict our overall growth is if donors shifted how they gave in 2019. If a greater proportion of donors chose to give through GiveWell in 2019, extrapolating from the proportion of GiveWell-processed donations in previous years to our total impact in 2019 would be overly optimistic. Although we don’t expect this to be the case, we won’t know for sure until we see the complete data from 2019.
Additional information: Where did donors give in 2019?
Restricted gifts accounted for $35 million of the $54.1 million we processed last year. Donors allocated 64% of restricted dollars in 2019 to “Grants to recommended charities at GiveWell’s discretion,” which was (and is) our top recommendation for GiveWell donors.
The remainder of the $54.1 million ($19.1 million) was unrestricted. We typically use unrestricted funding for our operations, though some of these funds will likely be granted to charities.