Summary
- I estimated the value of each of the Giving What We Can Pledges[1] (GWWC Pledges) started between 2009 and 2022:
- Using the fraction of reported donations, and counterfactuality coefficient estimated in GWWC’s impact evaluation.
- Calculating future donations extrapolating the past annual donations of each pledge individually. In contrast, GWWC extrapolates the past annual donations per pledge, and then multiplies it by the number of pledges.
- I reckon:
- GWWC caused 384 M$ (pessimistic to optimistic, 58.4 to 587) of donations due to its pledges in that period, with the caused donations per pledge being 46.6 k$ (7.09 to 71.3).
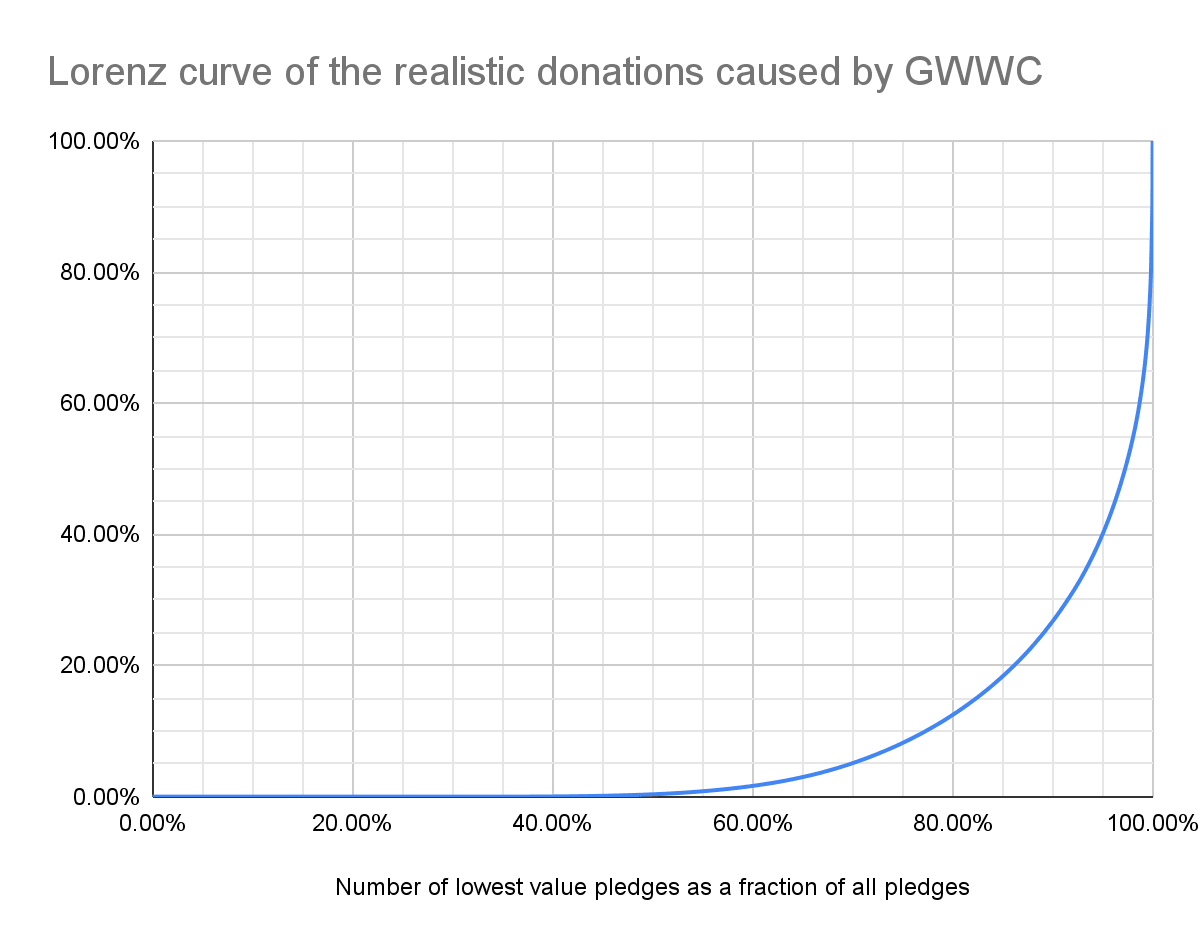
- Half of the caused donations originated from 2.75 % of pledgers.
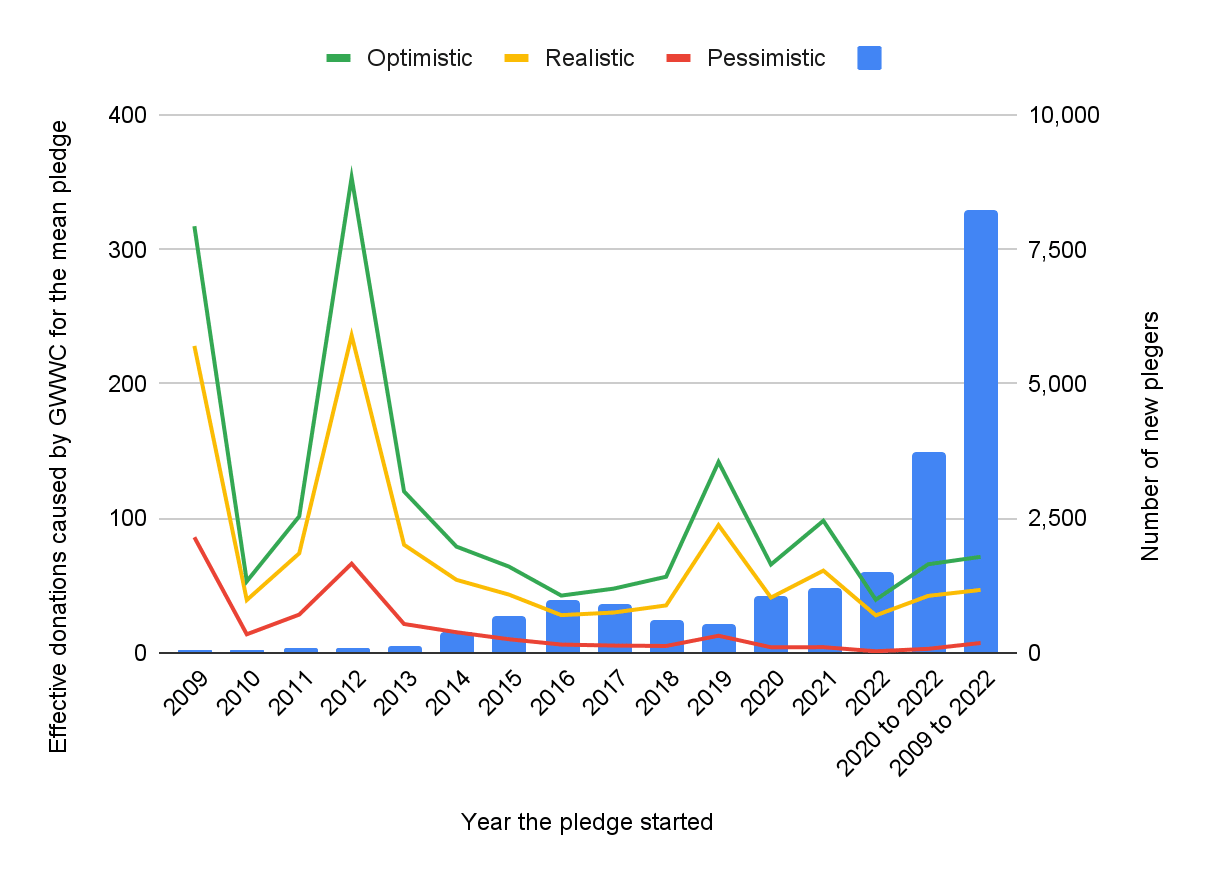
- There is a correlation of -0.570 between the number of new pledges and donations caused by GWWC per new pledge.
- I also did a shallow cost-effectiveness analysis. Accounting for pledge and non-pledge donations going to the area of creating a better future only, and excluding GWWC’s impact besides donations, I estimate:
- GWWC’s multiplier between 2020 to 2022 was 12.2 (0.797 to 19.1), which is 40.8 % GWWC’s best guess for the same period. Factoring in all donations, and using GWWC’s discount rate and effectiveness coefficient, I get a multiplier of 48.6 (4.87 to 68.3), which is 1.62 times GWWC’s best guess.
- The non-marginal cost-effectiveness of GWWC from 2020 to 2022 was 12.6 (0.208 to 47.0) times the marginal one expected for longtermism and catastrophic risk prevention.
- I believe it would be important to study (by descending order of importance):
- GWWC’s impact besides donations, which I believe may well be the driver of its overall impact.
- The current marginal cost-effectiveness, which will tend to be lower than the (non-marginal) one I have estimated for 2020 to 2022 given diminishing marginal returns. These are supported by the negative correlation between the number of new pledges and donations caused by GWWC per new pledge.
- The counterfactuality of the donations going to GWWC’s cause area of creating a better future, which in my view is the driver of the overall impact of the donations.
Acknowledgements
Thanks to Michael Townsend for feedback on the draft, and providing data.
Methods
Value of Giving What We Can Pledges
I wanted to estimate the value of Giving What We Can Pledges based on as much donation data as possible. So I considered the annual donations of each pledger individually, instead of those of all pledgers together, as GWWC did in their analysis here (which was announced here). Consequently, I can get values of the GWWC Pledges not only by year, but also by pledge.
I estimated a pessimistic, realistic, and optimistic value for each pledge. The realistic one is supposed to be the best proxy for the expected value, but I would have ideally worked with distributions instead of point estimates.
I calculated the pessimistic value from the donations caused by GWWC assuming no further donations, from the product between:
- Reported donations.
- All donations as a fraction of reported donations, which I set to 1.27, as considered by GWWC here.
- Donations caused by GWWC as a fraction of all donations, which I set to:
To determine the realistic and optimistic values, I started by estimating the future donations caused by GWWC, assuming:
- No change relative to the past (constant extrapolation). To do this:
- I supposed the future annual donations caused by GWWC are equal to the ratio between the ones caused in the past (i.e. the pessimistic value of the pledge), and the pledge age[3].
- This corresponds to a common ratio of 1 between the donations of consecutive years.
- Exponential extrapolation (growth or decay). To do this:
- I got the common ratio between the donations of consecutive years from the (exponential of the) slope of a linear regression of the logarithm of annual reported donations on year of the pledge[4].
- I weighted the data points by annual reported donations, such that large annual donations play a more important role in shaping the exponential.
- I limited the common ratio to 1.03, given annual growth rate of global real GDP has been 3 % in the last decades[5].
- For both cases:
- A downwards adjustment to the common ratio to account for existential risk, multiplying it by 99.8 % (= (1 - 1/6)^(1/100)) in agreement with Toby Ord’s guess given in The Precipice of an existential risk of 1/6 between 2021 and 2120.
- The donations to continue until the age of 65[6], as considered by GWWC (search for “being 65” here).
Finally, I obtained the realistic and optimistic values of the pledge by adding the donations caused by GWWC assuming no further donations (the pessimistic value of the pledge) to the minimum and maximum of the above (future donations caused by GWWC assuming constant or exponential extrapolation). In practice, the realistic values respect the constant extrapolation, and the optimistic ones a 3 % annual growth rate. As reported donations for each pledger increase significantly over time[7], my hard limit of 1.03 for the common ratio ends up being active for all donors except one.
Note:
- The donation data I used were retrieved from GWWC’s database on 22 February 2023. GWWC only shared anonymised data which was strictly necessary for me to carry out this analysis, and support my volunteering work.
- I adjusted all donations for inflation using these data from The World Bank for the years before 2022, and in2013dollars for 2022 and 2023.
- For each pledger, I ignored the donations made before 2009, when GWWC started.
Cost-effectiveness of Giving What We Can
I obtained the non-marginal cost-effectiveness of GWWC for the years between 2020 and 2022 from the product between:
- GWWC’s multiplier, which I computed from the product between:
- Donations caused by GWWC regarding the GWWC Pledges started between 2020 and 2022, whose estimation is described in the previous section.
- GWWC’s overall impact as a fraction of that of GWWC Pledges, which I assume to be 1.23 (= 1 + 19/83). This is based on GWWC’s estimates of 83 M$ for the donations caused by GWWC Pledges taken between 2020 and 2022, and 19 M$ for the non-pledge donations caused during the same period (see here). I have not modelled GWWC’s impact besides donations.
- Reciprocal of GWWC’s overall costs (adjusted for inflation) as estimated by GWWC here, which are in the 1st table below.
- Fraction of donations going to GWWC’s cause area of creating a better future, which is 13.3 % (= 11/(65 + 7 + 11)) based on the values provided here for the period between 2020 and 2022.
- Feel free to check this post and this comment to get a sense of why I think the sign of the impact of donations going to the areas of improving human wellbeing and improving animal wellbeing is quite unclear.
- I do not think excluding the donations going to such areas corresponds to an extreme position. From here, Benjamin Todd “would donate to the Long Term Future Fund over the global health fund, and would expect it to be perhaps 10-100x more cost-effective (and donating to global health is already very good)”. 80,000 Hours thinks global health is “important and underinvested in”, but it is not one of the 18 areas which are part of its list of the most pressing problems.
- If I had set the (non-marginal) cost-effectiveness of donations to the area of creating a better future to 100 times that of improving human/animal wellbeing, I would have got similar results.
- Marginal cost-effectiveness in bp/G$ I estimated here for the cause area of longtermism and catastrophic risk prevention with method 3 with truncation. I used my 5th percentile, mean and 95th percentile estimates for the pessimistic, realistic and optimistic ones. The values are in the 2nd table below.
Some caveats:
- I have not used the effectiveness coefficient of 0.81 mentioned here by GWWC.
- I obtained the pessimistic/optimistic non-marginal cost-effectiveness multiplying the pessimistic/optimistic GWWC multiplier by the 5th/95th percentile marginal cost-effectiveness of longtermism and catastrophic risk prevention. So my pessimistic/optimistic non-marginal cost-effectiveness is more pessimistic/optimistic than my pessimistic/optimistic GWWC multiplier. Thanks to Edo for commenting on this.
The last point means I may be overestimating the uncertainty around GWWC’s cost-effectiveness. On the other hand, I have neglected the uncertainty of other factors, such as the reporting and counterfactuality coefficients, and the fraction of donations going to creating a better future.
Year | GWWC’s overall costs (M$) |
|---|---|
2020 | 0.331 |
2021 | 0.424 |
2022 | 1.34 |
2020 to 2022 | 2.10 |
Marginal cost-effectiveness of longtermism and catastrophic risk prevention (bp/G$) | ||
|---|---|---|
5th percentile | Mean | 95th percentile |
1.03 | 3.95 | 9.71 |
Results
The data, calculations and full results are in this Sheet (see tab “TOC”).
Value of Giving What We Can Pledges
Year the pledge started | Number of new pledges | Donations caused by GWWC | |||||
|---|---|---|---|---|---|---|---|
For all pledges (M$) | Per pledge (k$) | ||||||
Pessimistic | Realistic | Optimistic | Pessimistic | Realistic | Optimistic | ||
2009 | 33 | 2.83 | 7.53 | 10.5 | 85.8 | 228 | 317 |
2010 | 36 | 0.489 | 1.41 | 1.91 | 13.6 | 39.1 | 53.0 |
2011 | 99 | 2.79 | 7.31 | 10.0 | 28.2 | 73.9 | 101 |
2012 | 101 | 6.68 | 23.8 | 35.7 | 66.2 | 236 | 354 |
2013 | 116 | 2.47 | 9.31 | 13.9 | 21.3 | 80.2 | 120 |
2014 | 398 | 6.01 | 21.5 | 31.4 | 15.1 | 54.1 | 78.8 |
2015 | 683 | 6.76 | 29.5 | 43.7 | 9.89 | 43.1 | 64.0 |
2016 | 974 | 5.76 | 27.1 | 41.3 | 5.92 | 27.8 | 42.4 |
2017 | 918 | 4.76 | 27.3 | 43.7 | 5.18 | 29.8 | 47.6 |
2018 | 615 | 2.99 | 21.6 | 34.7 | 4.87 | 35.1 | 56.4 |
2019 | 526 | 6.56 | 49.9 | 74.6 | 12.5 | 94.8 | 142 |
2020 | 1,035 | 4.05 | 42.3 | 67.8 | 3.91 | 40.9 | 65.6 |
2021 | 1,215 | 4.84 | 74.1 | 119 | 3.98 | 61.0 | 98.1 |
2022 | 1,484 | 1.38 | 41.0 | 58.3 | 0.931 | 27.6 | 39.3 |
2020 to 2022 | 3,734 | 10.3 | 157 | 245 | 2.75 | 42.2 | 65.7 |
2009 to 2022 | 8,233 | 58.4 | 384 | 587 | 7.09 | 46.6 | 71.3 |
Correlation between the number of new pledges and ... donations caused by GWWC per new pledge | ||
|---|---|---|
Pessimistic | Realistic | Optimistic |
-0.663 | -0.570 | -0.550 |
Cost-effectiveness of Giving What We Can
Year the pledge started | GWWC’s multiplier | Non-marginal cost-effectiveness of GWWC as a fraction of the marginal one expected for longtermism and catastrophic risk prevention | ||||
|---|---|---|---|---|---|---|
Pessimistic | Realistic | Optimistic | Pessimistic | Realistic | Optimistic | |
2020 | 1.99 | 20.8 | 33.4 | 0.519 | 20.8 | 82.0 |
2021 | 1.86 | 28.5 | 45.8 | 0.485 | 28.5 | 113 |
2022 | 0.168 | 4.98 | 7.08 | 0.0437 | 4.98 | 17.4 |
2020 to 2022 | 0.797 | 12.2 | 19.1 | 0.208 | 12.2 | 46.8 |
Discussion
Value of Giving What We Can Pledges
I estimate GWWC caused 384 M$ (pessimistic to optimistic, 58.4 to 587) of donations due to its pledges between 2009 and 2022, with the mean pledge being responsible for 46.6 k$ (7.09 to 71.3).
The 1st graph shows there is a negative correlation between the number of new pledges and donations caused by GWWC per new pledge. The correlation coefficient is -0.570 for my realistic estimates[8]. In other words, starting more pledges has been associated with less donations per pledge, which makes sense given diminishing returns. This suggests cost-effectiveness will decrease as GWWC widens its reach, unless the costs per new pledge decreases enough due to economies of scale.
The 2nd graph illustrates the realistic donations caused by GWWC are quite heavy-tailed. Half of them come from only 2.75 % of pledgers, and the Gini coefficient is 0.149[9]. This is qualitatively in agreement with GWWC’s finding that “less than 1% of our donors account for 50% of our recorded donations”. As a result, understanding well the extent to which GWWC caused the donations of top pledgers, and whether they have been accurately reported, is very important. Furthermore, the expansion strategy of GWWC should arguably be centred around these high return donors.
Cost-effectiveness of Giving What We Can
According to my results, GWWC’s multiplier between 2020 to 2022 was 12.2 (0.797 to 19.1), which is 40.8 % (= 12.2/30) GWWC’s best guess for the same period (see here). Nevertheless, factoring in all donations instead of just those going to the area of creating a better future, while using GWWC’s discount rate[10] and effectiveness coefficient of 0.81 (see here), I get a multiplier to 48.6 (4.87 to 68.3), which is 1.62 (= 48.6/30) times GWWC’s best guess. I believe the difference is mostly explained by me calculating future donations extrapolating the past annual donations of each pledge individually, whereas GWWC extrapolates the past annual donations per pledge, and then multiplies it by the number of pledges.
I estimate the non-marginal cost-effectiveness of GWWC from 2020 to 2022 was 12.2 (0.208 to 46.8) times that expected for longtermism and catastrophic risk prevention. There is lots of uncertainty, with my optimistic estimate for that period being 225 (= 46.8/0.208) times my pessimistic one. However, the realistic estimate being one order of magnitude above 1 suggests GWWC is quite cost-effective.
The decrease in (non-marginal) cost-effectiveness of 76.1 % (= 1 - 4.98/20.8) from 2020 to 2022 can be explained by the reduction in GWWC’s multiplier. This is related to the increase of 305 % (= 1.34/0.331 - 1) in overall costs not being accompanied by a change in donations caused by GWWC, which decreased 3.08 % (= 1 - 41.0/42.3). Nonetheless, my realistic estimate will tend to underestimate the amount of donations[11], because “[GWWC] found an increase in recorded GWWC Pledge donations with time” (see here).
I believe it would be important to study (by descending order of importance):
- GWWC’s impact besides donations, which I believe may well be the driver of its overall impact.
- The current marginal cost-effectiveness, which will tend to be lower than the (non-marginal) one I have estimated for 2020 to 2022 given diminishing marginal returns. These are supported by the negative correlation between the number of new pledges and donations caused by GWWC per new pledge.
- The counterfactuality of the donations going to GWWC’s cause area of creating a better future, which in my view is the driver of the overall impact of the donations.
- ^
These include The GWWC Pledge and The Trial Pledge.
- ^
I could have used personalised parameters for the other surveyed pledgers, and the mean parameters for the others. However, since only a tiny minority of pledgers was surveyed, I opted to use the same parameters for every pledger besides the aforementioned 3 major ones.
- ^
I got the pledge age from the difference between 2023 and the year the pledge started.
- ^
If a pledge started in year S, year Y of the pledge corresponds to the year S + Y. So, for a pledge started in 2010, years 0 and 12 correspond to 2010 and 2022.
- ^
Based on these data from The World Bank, it was 3 % (= (134.08/51.33)^(1/31) - 1) between 1990 and 2021.
- ^
I set the age of the 2.21 % (= 1 - 8,196/8,381) of pledgers whose age was not available to the mean age of 32.5 years of the pledgers whose age was available.
- ^
GWWC also “found an increase in recorded GWWC Pledge donations with time” (see here).
- ^
Calculated in B3 of tab “New pledges”.
- ^
For context, the lowest Gini coefficient respecting the income distribution within countries in 2019 was 0.308 for Albania, according to these data from Our World in Data.
- ^
My annual discount factor of 99.8 % (derived from Toby Ord’s best guess for the existential risk from 2021 to 2120) is higher than the 96.5 % considered by GWWC (in line with the UK government’s green book; see here).
- ^
Although my realistic and optimistic estimates consider donations until the age of 65.
Thanks for this analysis, Vasco!
A recurring motif in your posts is your willingness to be explicit about your uncertainty regarding the sign of the net impact of certain cause areas' interventions.
When playing the "game" of estimating an intervention's net impact, EAs typically apply the set of "house rules" within an intervention's cause area, and ignore "game extensions" which incorporate rules from other cause areas. Sadly, we often do this even when the "game extensions" involve crucial considerations which can and do flip the sign of interventions' net impact. Examples:
You seem to believe that one can't just play "house rules"--if you want to play this game properly, you have to include all of the game extensions, from the effect of malaria charities on the malaria-carrying mosquitos themselves to the effect of reducing x-risk on long-term future animal welfare. Otherwise, you risk making illegal moves and losing when you think you're winning.
I think you should further defend this view, perhaps by writing a post which is explicit about it. If this is your view, then a sizeable portion of EA money is currently going to the incinerator each year. (Also, EAs are working against each other by donating to lifesaving charities and family planning charities, among many places.) If some EAs are convinced by your post to switch to your preferred charities, then taking the time to write your post will have been highly cost-effective.
Why do you believe that donating to lifesaving charities is in tension with donating to family planning charities? Preventing early deaths from disease reduces suffering, as does allowing women greater bodily autonomy and preventing unwanted pregnancies.
Thanks for the question! Earlier, Vasco gave a consequentialist response, but I'll try to give a broader response which might chime for more ethical views.
For you, where does the goodness of a lifesaving charity come from? Saving someone's life:
These might all seem like noncontroversial benefits, but how one weights between them can have massive implications for cause prioritization. Many EAs consider point (1) to be the main benefit of saving one's life. Whether or not you're a consequentialist, if you had to choose between saving a 10-year-old and a 90-year-old, it seems sensible to choose the 10-year-old, because they have so much more life to experience.
But if point (1) is the main benefit of saving a life, even if points (2) and (3) are sizeable parts of the benefit, adding a person to the human population seems close to as good as saving a life! You're enabling another person to live an entire life's experience.
However, this bumps against the intuition of the goodness of family planning charities. Preventing an unplanned pregnancy absolutely helps a mother, but it's probably not close to as good as saving her life. (Just ask her if she'd rather die or have an unplanned pregnancy. Most would choose the latter.) But we just argued that the effect of preventing another person from living an entire life's experience is close to as bad as preventing a life from being saved.
You can also make this argument in the opposite direction: If family planning charities are good, then this must mean it's okay to prevent a person from living a life's experience, or it's at least not as bad as the goodness of supporting their mother's autonomy. This would mean lifesaving charities are much less beneficial than we thought they were.
(Full disclosure: I take the first perspective, and don't support family planning charities.)
Thank you for this thorough explanation of your views. I am quite curious as to whether you have ever been pregnant. Of course, many people who have been pregnant are vehemently anti-abortion, but my own personal experience of (wanted) pregnancy made me convinced that forcing someone to carry an unwanted pregnancy to term is a crime against their humanity.[1] If you can't understand why this might be, I would suggest reading Judith Jarvis Thompson's violinist paper.
I don't want to relitigate whether abortion ought to be legal (or encouraged, or funded, or whatever), as I find the fact that my bodily autonomy is up for debate to be somewhat dispiriting, so I am going to bow out of this conversation now, but once again I appreciate your taking the time to explain your viewpoint.
'but what of the fetus's humanity?' idk man, the fetus is a possible human and the mother is an actual human, and I think actual humans are more important than possible ones. This is also why I'm not a longtermist.
You're very welcome! I appreciate you reading and engaging :)
I'm a male and have not been pregnant. I'm familiar with Thompson's arguments, and I don't consider them decisive. Depending upon the weeks from gestation, the fetus may be a possible person, but they may also be an actual person.[1] Either way, as in longtermism, I don't endorse a moral distinction between possible and actual people.
I respect your decision to bow out, so I won't elaborate on these points unless you request me to. Thanks again for your engagement!
"Overall, the evidence, and a balanced reading of that evidence, points towards an immediate and unreflective pain experience mediated by the developing function of the nervous system from as early as 12 weeks." Derbyshire, S. W., & Bockmann, J. C. (2020). Reconsidering fetal pain. Journal of Medical Ethics, 46(1), 3–6. https://doi.org/10.1136/medethics-2019-105701
Hi britomart,
Thanks for asking! On the one hand, there is not a tension in the sense that both interventions are decreasing suffering in the short term. On the other hand:
Thanks for the explanation! I'm not a consequentialist, and I don't grant that increasing the population size is good in its own right. If you accept increased population as an intrinsic good I can see why you'd see a tension.
You are welcome!
Just to clarify, I do not see increasing human population as intrinsically good. I think it increases the welfare of humans in the nearterm (assuming the saved lives are good in expectation), but I am quite uncertain about the effects on animals, and indirect longterm effects. So I do not know whether increasing population is good or bad.
I think attempting to account for every factor is a dead end when those factors themselves have huge uncertainty around them.
e.g.:
I think when analyses ignore these considerations it's not because they're being lazy, it's simply an acknowledgment that it's only worth working with factors we have some certainty about, like that vitamin deficiencies and malaria are almost certainly bad
Thanks for engaging, Henry!
Let me try to illustrate how I think about this with an example. Imagine the following:
What do you think is a better description of our situation?
I'm curious: How do you feel about hyperfocused neartermist interventions which alter as little of the rest of the world as possible?
An example of this would be humane slaughter, which shouldn't have much affect on farmed animal, wild animal, or human populations, other than reducing a farmed animal's suffering at the moment of death.
It's plausible that certain hyperfocused neartermist interventions can be precisely targeted enough that the overall effect is more like -1 with 50% likelihood, or 3 with 50% likelihood. A portfolio of independent hyperfocused interventions could be shown to have quite strong robustness.
Thanks for asking! I have not thought much about it, but I feel like neartermist approaches which focus on increasing (animal/human) welfare per individual are more robustly good. Interventions which change human population size will lead to a different number of wild animals, which might dominate the overall nearterm effect while having an unclear sign.
I disagree with the assumption that those +1000/-1000 longterm effects can be known with any certainty, no matter how many resources you spend on studying them.
The world is a chaotic system. Trying to predict where the storm will land as the butterfly flaps its wings is unreasonable. Also, some of the measures you're trying to account for (e.g. the utility of a wild animal's life) are probably not even measurable. The combination of these two difficulties makes me very dubious about the value of trying to do things like factor in long-term mosquito wellbeing to bednet effectiveness calculations, or trying to account for the far-future risks/benefits of population growth when assessing the value of vitamin supplementation.
Thanks for following up!
I agree there will always be lots of uncertainty, even after spending tons of resources investigating the longterm effects. However, we do not need to be certain about the longterm effects. We only have to study them enough to ensure our best estimate of their expected value is resilient, i.e. that it will not change much in response to new information.
If people at Open Philanthropy and Rethink Priorities spent 10 kh researching the animal and longterm effects of GiveWell's top charities, are you confident their best estimate for the expected animal and longterm effects would be negligible in comparison with the expected nearterm human effects? I am quite open to this possibility, but I do not understand how it is possible to be confident either way, given very little research has been done so far on animal and longterm effects.
A butterfly flapping its wings can cause a storm, but it can just as well prevent a storm. These are cases of simple cluelessness in which there is evidential symmetry, so they are not problematic. The animal and longterm effects of saving lives are not symmetric in that way. For example, we can predict that humans work and eat, so increasing population will tend to grow the economy and food production.
For intuitions that measuring wild animal welfare is not impossible, you can check research from Wild Animal Initiative (one of ACE's top charities, so they are presumably doing something valuable), and Welfare Footprint Project's research on assessing wild animal welfare.
"estimate... will not change much in response to new information" seems like the definition of certainty.
It seems very optimistic to think that by doing enough calculations and data analysis we can overcome the butterfly effect. Even your example of the correlation between population and economic growth is difficult to predict (e.g. Concentrating wealth by reducing family size might have positive effects on economic growth)
Thanks for that comment, Ariel! I think you described my view quite well, and I do agree I should probably try to write a post about it.
Hi Ariel,
Joey just brought to my attention the post The Importance of Intercausal Impacts by Sebastian Joy.
Thanks for bringing that post to my attention, and for your excellent post on taking a stand between meta-cause-areas! You provoked a very important conversation.
Great point.
Thanks for conducting this impact assessment, for sharing this draft with us before publishing it, and for your help with GWWC's own impact evaluation! A few high-level comments (as a researcher at GWWC):
Regarding the difference between how you have modelled the value of the GWWC Pledge versus how we did so:
Thanks again for your work!
Hi Michael,
I think that is a great summary, thanks!
A couple of problems I have with this analysis:
Hi Henry,
Nice points!
Fixed, thanks.
I actually think the uncertainty of longtermist interventions is much larger than that of neartermist ones, in the sense that the difference between a very good and very bad outcome is larger for longtermist interventions. However, given this large uncertainty, uncovering crucial considerations is very much at the forefront of longtermist analyses, and there is often a focus on trying to ensure the expected value is positive. So I believe the uncertainty around the sign of the expected value of longtermist interventions is lower.
Good point. I have added a point about this to the last bullet of the summary:
On only including longtermist donations, if it ended up being the case that the marginal giving multiplier was <1 for longtermists, but >1 overall, committed longtermists could coordinate with others to support GWWC in proportion to the benefit towards longtermism (e.g. share of marginally raised funds towards longtermism, but also possibly other impacts). In general, supporters of each cause should be willing to contribute in proportion to the marginal impact towards the causes they support. Doing this could take coordination, but I'd imagine it could mostly be managed by larger funders, like Open Phil or the EA Funds. And maybe it already is?
See https://strivingforpositiveimpact.wordpress.com/2018/04/25/should-you-donate-to-a-fund-raising-meta-charity/.
Alternatively, GWWC could do more cause-specific work or emphasize cause areas differently in its outreach, and do that in proportion to donations earmarked for specific causes.
If the marginal multiplier for longtermists is >1, after addressing concerns about double counting, and appropriately discounting future donations based on x-risk, then they should be willing to support GWWC even without coordination (as long as other groups aren't donating to GWWC substantially less as a result, which would decrease the multiplier for them), although coordination may make it "fairer".
I realize this may sound ridiculous, but, serious question: Is it good or bad for a marginal person to take the GWWC pledge, if you take into account the effects on the human population, wild animal welfare, and x-risk? I'm interested in your conclusions on this since you've mentioned it in several other posts.
Hi Robi,
My best guess is that it is good for GWWC to increase the number of pledgers. Basically, because I think some of the donations are roughly as likely to be harmful as beneficial, and others are beneficial. I do not seem to see any donations as robustly harmful.
However, since only 13.3 % of the donations go to the area of creating a better future, assuming donations going to improving human and animal welfare have a 50 % chance of being beneficial/harmful, 2 out of 5 (as (1 - 13.3 %)/2 = 43.4 %) pledgers have net harmful donations. I have very little confidence in this claim.
Do you know how they tag the cause area of a given donation?
Is EA community building work considered separately, or included in "creating a better future"?
Hi Charles,
Good question! The correspondence is here.
It depends. If such work were funded by the Long-term Future Fund, it would be included in "creating a better future". If it were funded by Centre for Effective Altruism, or the EA Infrastructure Fund, it would be included in "multiple cause areas".
I think it would follow from this and your radical uncertainty with regard to non long term interventions that you would want to include these donations as positively impactful.
I accounted for donations going to the area of "creating a better future" which were tagged as "multiple cause areas". GWWC tagged 11 % going to creating a better future, but I assumed 13.3 % (= 11/(65 + 7 + 11) = "tagged as creating a better future"/("tagged as improving human welfare" + "tagged as improving animal welfare" + "tagged as creating a better future")) went to creating a better future. This may not be accurate if the donations going to "multiple cause areas" are disproportionally going to "creating a better future", so I take the point that it would be better to explicitly analyse where the donations in the bucket of "multiple cause areas" are going to.
Interesting work, thanks! Some questions and comments:
1
I didn't really understand this part (and the computation in the table is in hidden sheets). What do you refer to in "the above" and the "pessimistic value"?
2
In the computation of the pessimistic multipliers, you multiply several "pessimistic" values. This makes the overall result likely even more pessimistic than warranted. Similarly for optimistic.
3
Many of the links are broken. (incorrect parsing of
#s, say)Hi Edo,
Thanks for the questions and comments!
Sorry, it was confusing. I have now updated the sentence to:
2 is a great point! Added:
Thanks for noting that:
I think I have now fixed them all.
Thanks, much clearer :)
(In case anyone is confused about the mysterious link in Vasco's comment, it's because writing "#" expands into a suggested post:
)