As we can see, average support for Near-termist causes declines with increases in engagement, while support for Longtermist and Meta causes increases.
I would love to see research into the direction of causality here. I think it's very easy to assume engagement drives the realisation of belief in longtermism, and much EA messaging supports this - eg Will's(?) statement that longtermism might be the biggest breakthrough of the EA movement. But I know many people for whom it seemed to run the other way - they lost interest over time in part because of the movement's obsession with replacing concrete short term value with (as they see it) motivated speculation.
I agree it's quite possible that part of this observed positive association between engagement and longtermism (and meta) and negative association with neartermism is driven by people who are less sympathetic to longtermism leaving the community. There is some evidence that this is a factor in general. In our 2019 Community Information post, we reported that differing cause preferences were the second most commonly cited reason for respondents' level of interest in EA decreasing over the last 12 months. This was also among the most commonly cited factors in our, as yet unpublished, 2020 data. There is also some evidence from that, as yet unpublished [EDIT: this is now published here], post that support for longtermism is associated with higher satisfaction with the EA community, though I think that relationship still requires more research.
Dealing with differential attrition (i.e. different groups dropping out of the survey/community at different rates) is a perennial problem. We may be able to tackle this more as we get more data tracked across years (anything to do with engagement is very limited right now, as we only have two years of engagement data). One possible route is that, in 2019, we asked respondents about whether they had changed cause prioritisation since they joined the community and if so which causes they switched from. A majority of those that had switched did so from Global Poverty (57%) and most seem to be switching into prioritising the Long Term Future.
Broad Cause Area ChangesNarrow Cause Area Changes
It may be possible to estimate what proportion of neartermist respondents should be expected to switch to longtermism across time (assuming no dropout), then compare that with actual changes in the percentage of neartermists across time and see whether we observe fewer neartermists within cohorts across time (i.e. across surveys) than we'd expect given the estimated conversion rate. But there are lots of complexities here, some of which we discuss in more detail in later posts on satisfaction and engagement.
A couple of perhaps weakly suggestive observations are that, within 2020 data, i) engagement is more clearly associated with cause prioritisation than time in EA and ii) we also observe more engaged EAs to be more longtermist (or meta) and less neartermist even within cohorts (i.e. EAs who reported joining within the same year). Looking within different engagement levels, below, the relationship cause prioritisation across time in EA is comparatively flat (an interesting exception being neartermism among those reporting highest engagement, where it drops dramatically among the most recent cohorts (2016-2020), i.e. those who have been in EA a longer are visibly less neartermist, which is roughly the pattern I would expect to see were neartermists dropping out [though it would be odd if that was only occurring among the most engaged]).
Thanks for this! Can someone clarify the difference between "EA movement building" and "Meta (Other than EA movement building)"?
I'm not sure why that distinction was made, or what the distinction is. I'm not sure if survey respondents would have understood the distinction either. If this distinction is going to be kept for future surveys, explaining the difference between those two in the survey might be needed.
The context here was that we've always asked about "Meta" since the first surveys, but this year an org was extremely keen that we ask explicitly about "EA movement building" and separate out Meta which was not movement building.
In future years, we could well move back to just asking about Meta, or just ask about movement building, given that non-EA movement building meta both received relatively low support and was fairly well correlated with movement building.
Thanks for clarifying! But I'd still like to hear more about you or the org's conception of the difference between EA movement building and Meta work that is not movement building.
I can't speak for others, but I don't think there's any specific theoretical conception of the categories beyond the formal specification of the categories (EA movement building and Meta (other than EA movement building). Other people might have different substantive views about what does or does not count as EA movement building, specifically.
I think the pattern of results this year, when we split out these options, suggests that most respondents understood our historical "Meta" category to primarily refer to EA movement building. As noted, EA movement building received much higher support this year than non-EA movement meta; EA movement building also received similar levels of support to "Meta" in previous years; EA movement building and Meta (other than EA movement building) were quite well correlated, but only ~12% of respondents rated Meta (other than EA movement building) higher than EA movement building (44% rated movement building higher, and 43% rated them exactly the same).
I think this suggests either that we could have just kept the Meta category as in previous years or that in future years we could consider dropping Meta other than movement building as a category (though, in general, it is strongly preferable not to change categories across years).
Got it! I would guess that engaged EAs would think Meta work that is not movement building might be referring to fundraising for other causes. So I think it makes sense that it's not a high priority, given the large amount of funding already committed to EA.
Thanks for this. It is very interesting to see the changes over time and across engagement levels. In future, I'd like to see changes in the 'other causes' over time and across engagement level, if possible. For instance, it would be interesting to see if causes such as IIDM or S-risk are becoming more or less popular over time, or are mainly being suggested by new or experienced EAs.
I think that it would be very interesting if we could compare the EA communities results on this survey against a sample of 'people who don't identify as EAs' and people who identify as being in one or more 'activist groups' (e.g., vegan/climate etc) and explore the extent of our similarities and differences in values (and how these are changing over time). This in turn could inform decisions about how to communicate and collaborate with such audiences, where relevant.
In future, I'd like to see changes in the 'other causes' over time and across engagement level, if possible. For instance, it would be interesting to see if causes such as IIDM or S-risk are becoming more or less popular over time, or are mainly being suggested by new or experienced EAs.
Yeh, I agree that would be interesting. Unfortunately, if we were basing it on open comment "Other" responses, it would be extremely noisy due to low n, as well as some subjectivity in identifying categories. (Fwiw, it seemed like people mentioning S-risk were almost exclusively high engagement, which is basically what I'd expect, since I think it requires some significant level of engagement before people would usually be exposed to these ideas).
I think that it would be very interesting if we could compare the EA communities results on this survey against a sample of 'people who don't identify as EAs' and people who identify as being in one or more 'activist groups' (e.g., vegan/climate etc) and explore the extent of our similarities and differences in values (and how these are changing over time).
I agree this would be interesting. I'm particularly interested in examing differences in attitudes between EA and non-EA audiences. Examining differences in cause ratings directly might be more challenging due to a conceptual gap between EA understanding of certain causes and the general population (who may not even be familiar with what some of these terms mean). I think surveying more general populations on their support for different things (e.g. long-termist interventions, suitably explained) and observing changes in these across would be valuable though. Another way to examine differences in cause prioritisation would be to look at differences in the charitable portolios of the EA community vs wider donors, since that aggregate data is more widely available.
Unfortunately, if we were basing it on open comment "Other" responses, it would be extremely noisy due to low n, as well as some subjectivity in identifying categories.
Thanks for explaining. I see what you mean. If it seems worth it (i.e., more people than me care!), you could potentially add a closed ended 'other potential cause areas' item. These options could be generated from the most popular options in the prior year's open ended responses. E.g., you could have IIDM and S-risk as close ended 'other options' for that question next year (in addition to n other common responses) . You could keep the 'open ended other potential cause areas' as an 'Are there any other causes you feel should be priorities for the EA community that we haven't mentioned' open ended option. You could also grow the closed ended items list year as needed each year.
I agree this would be interesting. I'm particularly interested in examing differences in attitudes between EA and non-EA audiences. Examining differences in cause ratings directly might be more challenging due to a conceptual gap between EA understanding of certain causes and the general population (who may not even be familiar with what some of these terms mean). I think surveying more general populations on their support for different things (e.g. long-termist interventions, suitably explained) and observing changes in these across would be valuable though.
Yes, I agree
Another way to examine differences in cause prioritisation would be to look at differences in the charitable portolios of the EA community vs wider donors, since that aggregate data is more widely available.
Thanks - this link is interesting. Great to see that religious institutions get the most. That's definitely ideal :)
I hadn't thought about comparing donation portfolio trends. That could be very useful data if we had good data!
If it seems worth it (i.e., more people than me care!), you could potentially add a closed ended 'other potential cause areas' item. These options could be generated from the most popular options in the prior year's open ended responses. E.g., you could have IIDM and S-risk as close ended 'other options' for that question next year
Yeh that seems like it could be useful. It's useful to know what kinds of things people find valuable, because space in the survey is always very tight.
It would be great to see stats for how many people identify whether longtermism, shorttermism, or neither.
This seems to be a major divide in cause prioritisation and questions are often raised about how much of the community are longtermist so it seems like this information would be very valuable.
Thanks for your question. We've addressed this in a number of different ways over the years.
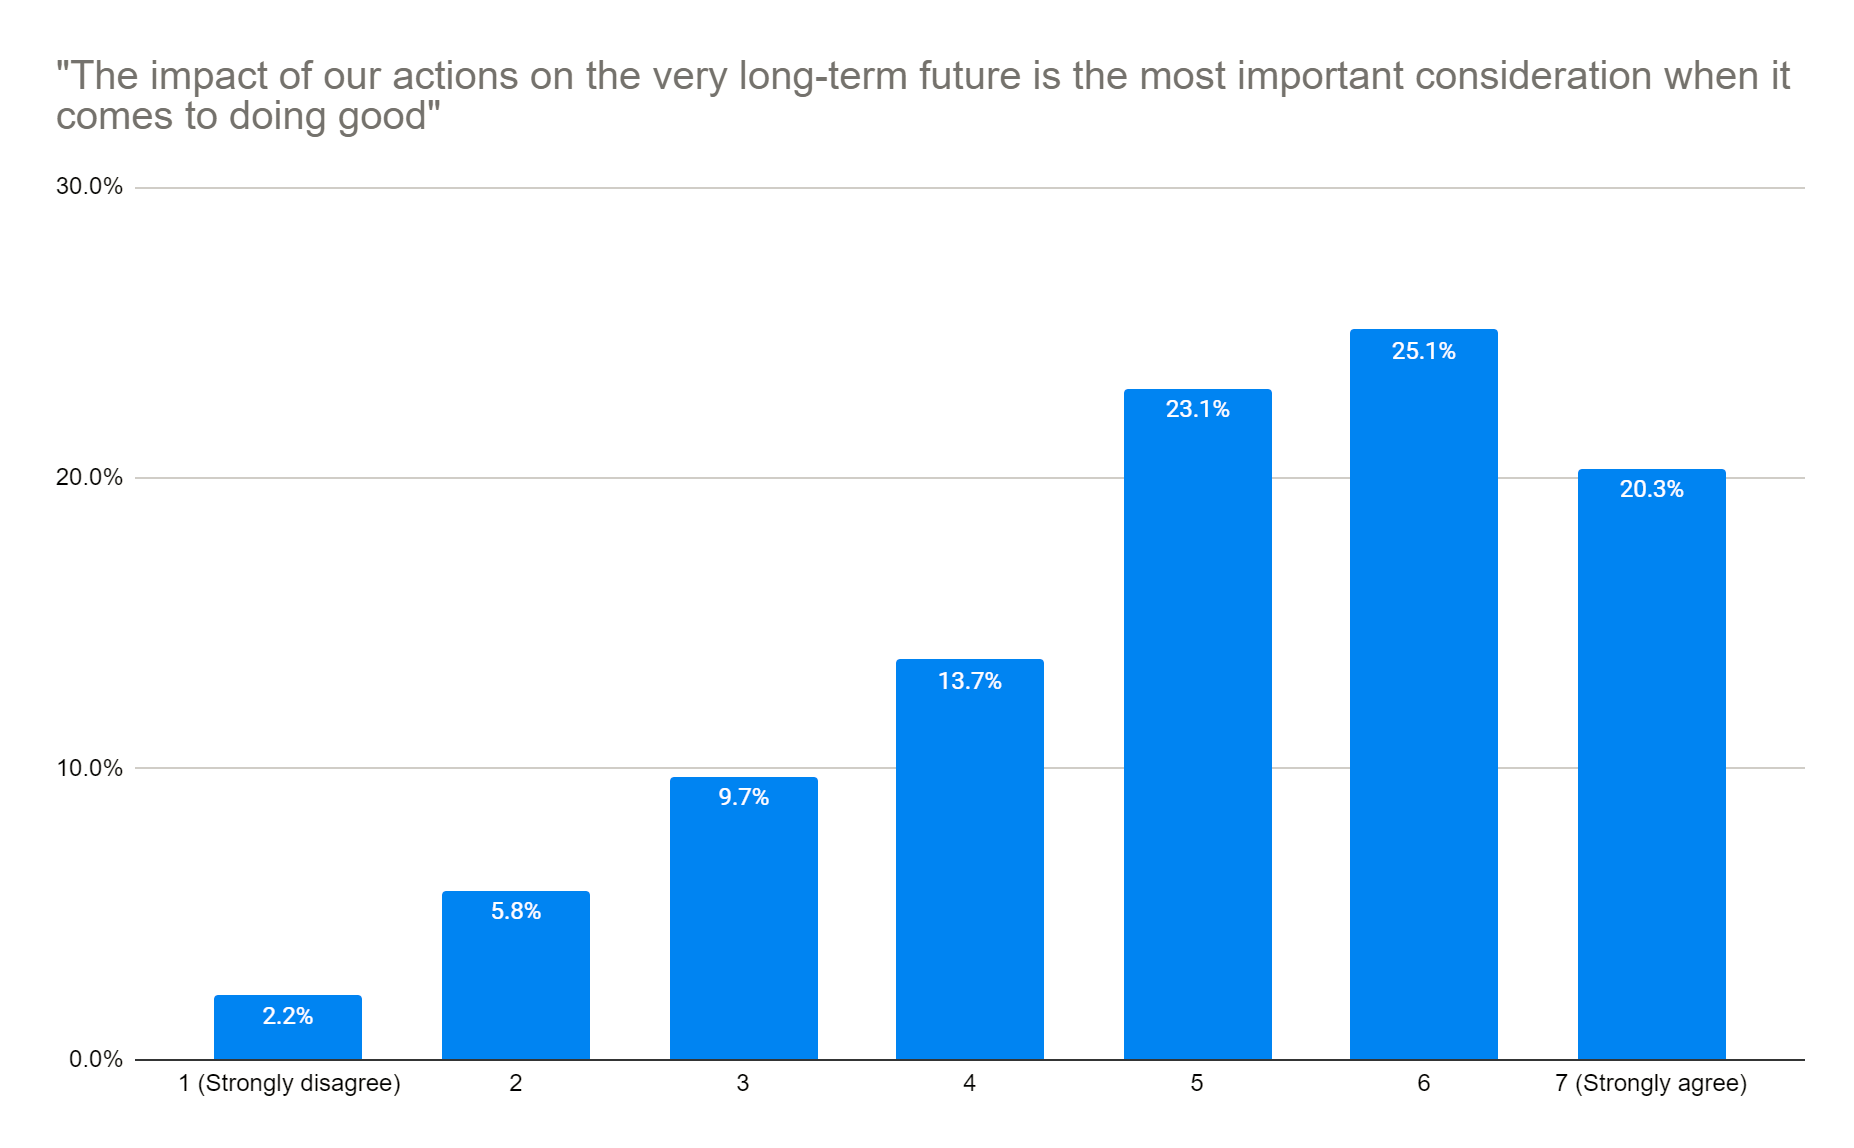
In 2020 we asked respondents how far they agreed with an explicit statement of longtermism. Agreement was very high (68.5% agreement vs 17.7% disagreement).
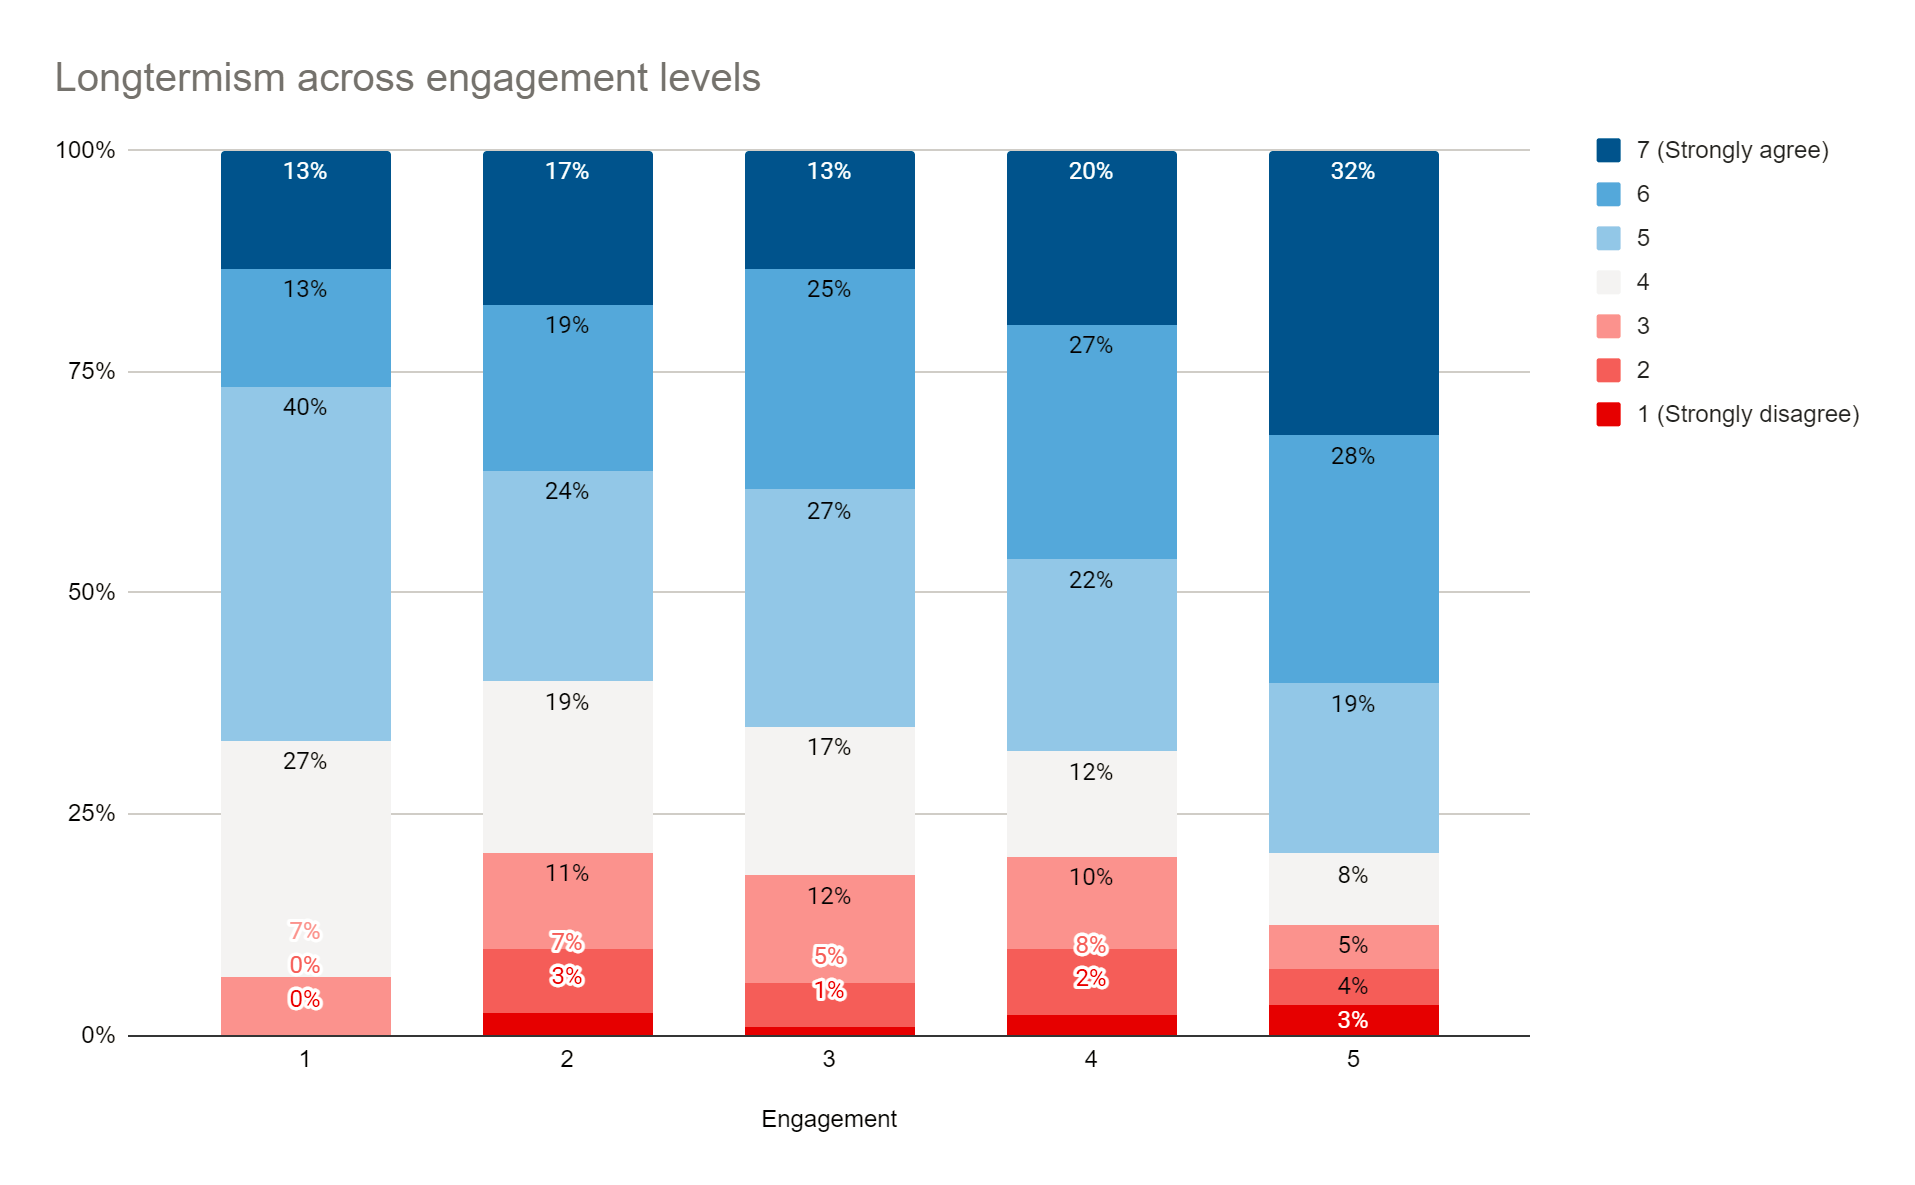
Responses to this (like our measures of longtermism and neartermism reported above and here) vary across engagement levels (see below). Since we sample a larger proportion of highly engaged people than less engaged people, the true number of people not agreeing with longtermism in the broader community is likely higher.
In contrast, in 2019 we were asked to include a broad forced-choice question between longtermism and other cause areas. 40.8% selected "Long Term Future."
Of course, this doesn't neatly capture a longtermism vs neartermism distinction since only a small number of cause areas outside "Long Term Future" are mentioned, and some of the people selecting these may nevertheless count as longtermists. For example, in our analysis of the fine-grained cause areas, we find that Meta is strongly associated with Longtermism, so some of these respondents would doubtless count as longtermists. As such, overall, I'm not a big fan of the broad forced choice question, especially since it didn't line up particularly well with responses to the more fine-grained categories.
We found support for longtermist and meta causes to increase with higher self-reported engagement in EA
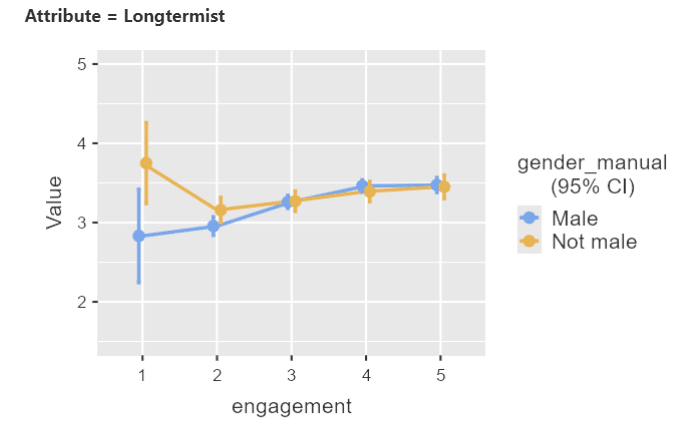
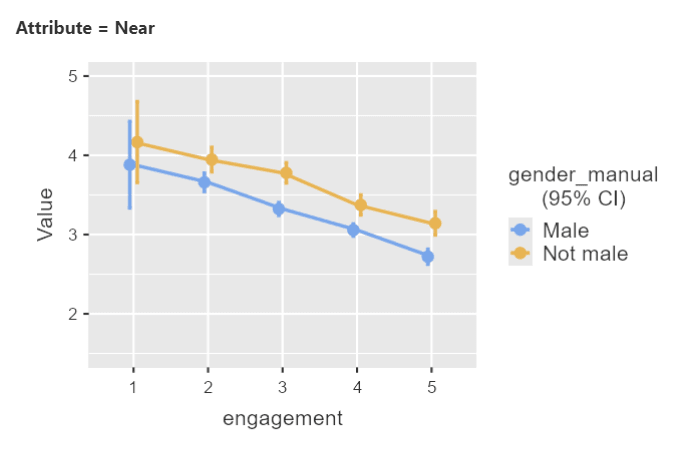
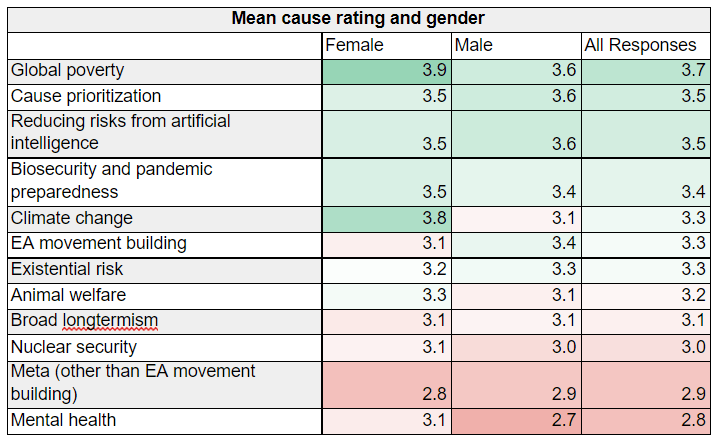
We also observed higher support for neartermist causes in non-male respondents across engagement levels, though there was no gender difference in support for longtermist causes among more engaged respondents
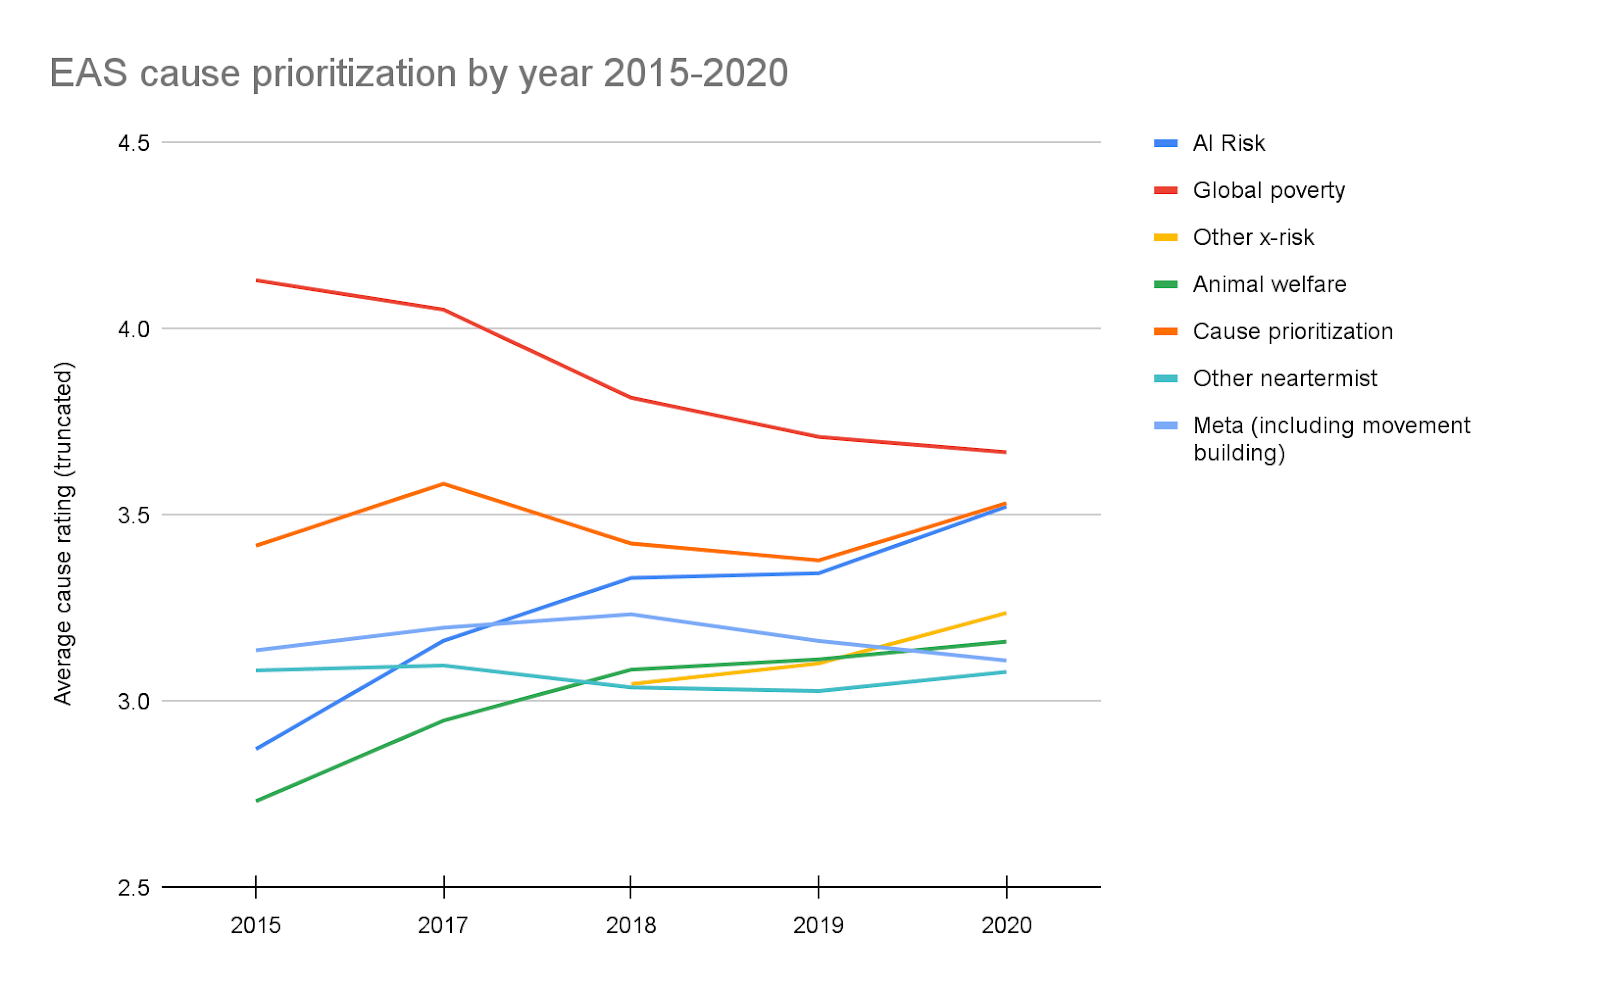
Comparing ratings across separate EA surveys, we observe a decrease in support for global poverty over time, and an increase in support for animal welfare and AI risk
Full Scale Responses
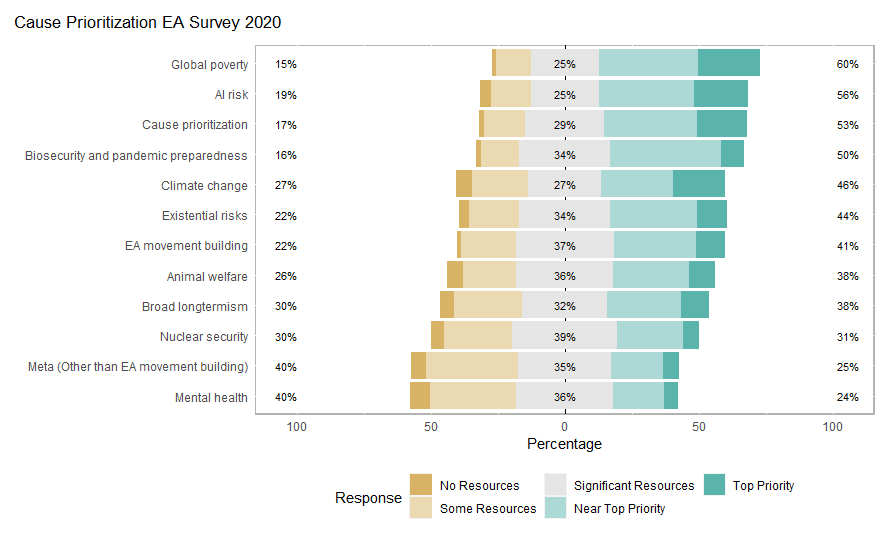
We asked respondents to evaluate a series of different causes[1] on the same 5 point scale as used in previous years.[2]
Comparing mean ratings across causes
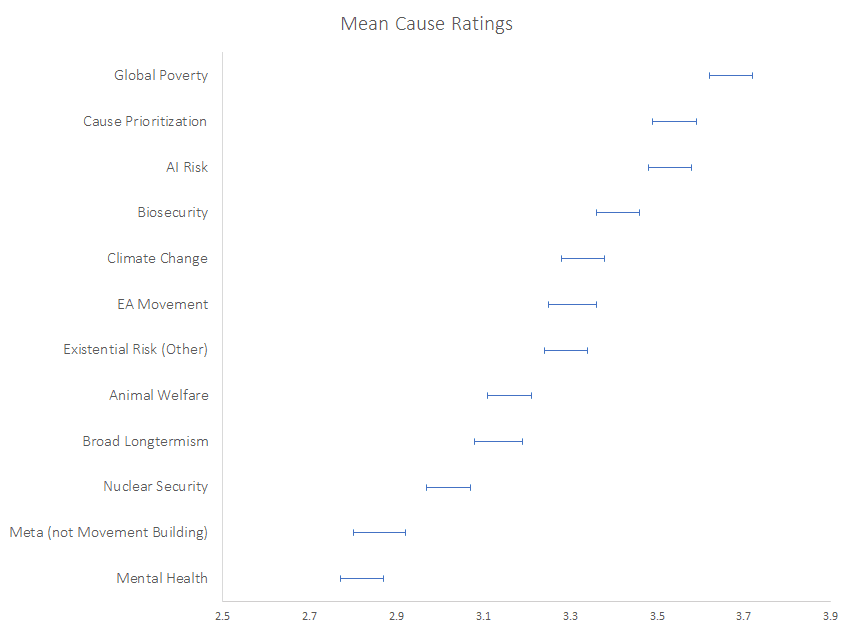
As the same participants rated multiple causes, we used a linear mixed model, with respondent as a random factor, to compare the mean ratings of different causes.
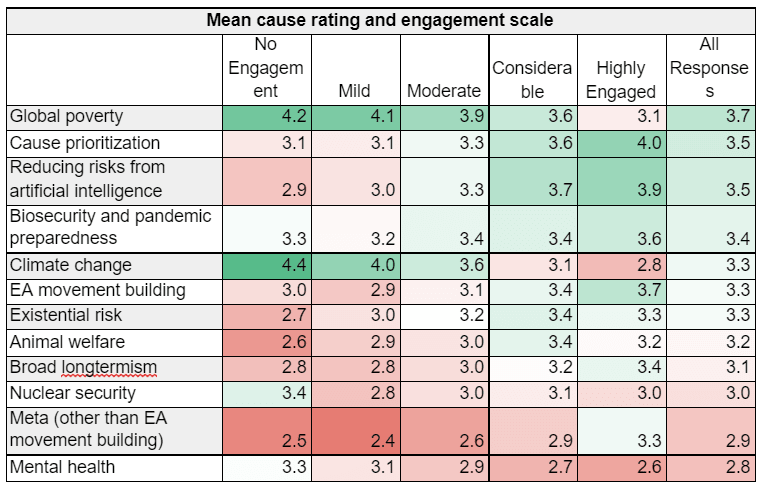
This confirms that the mean rating for Global Poverty is significantly higher than all other causes, followed by Cause Prioritization and Reducing Risks from AI.
AI Risk and Cause Prioritisation receive very similar mean ratings to each other and are the second most highly ranked.
Biosecurity, Climate Change, EA Movement Building and Existential Risk (other) all receive similar ratings (although Biosecurity and Existential Risk (other) do differ significantly[3]).
Animal Welfare and Broad Longtermism are the next highest ranked, followed by Nuclear Security and Meta (not movement building) and Mental Health.
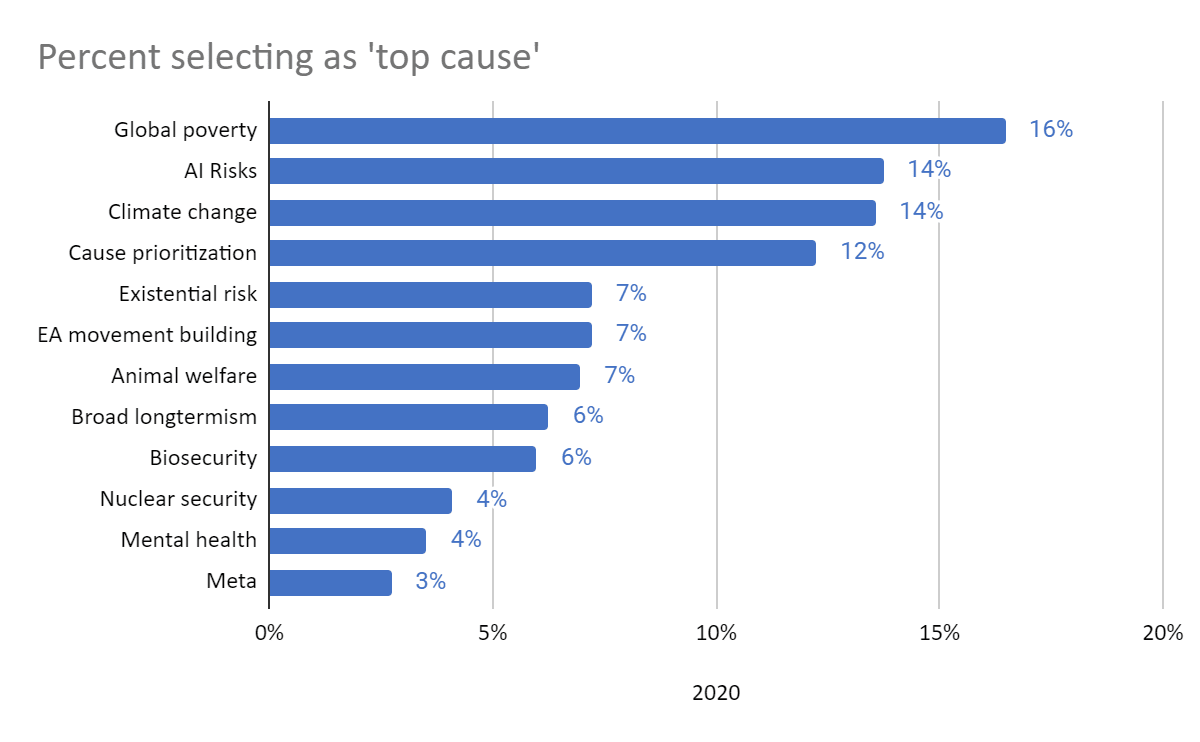
Top Cause Percentages
As in previous years, we report the percentages of respondents rating each cause as the ‘top cause.’ Of course, this is essentially just looking at one level of the responses shown in the graph above. While this leads to simple headline findings (e.g. which cause has the most people rating it ‘top’), it is likely more informative to look at the full range of responses.
One result that may be of particular interest, however, is support for Biosecurity (and pandemic preparedness), given the pandemic. This increased from 4% in 2018 and 2019 to 6% in 2020.
Relationships Between Causes
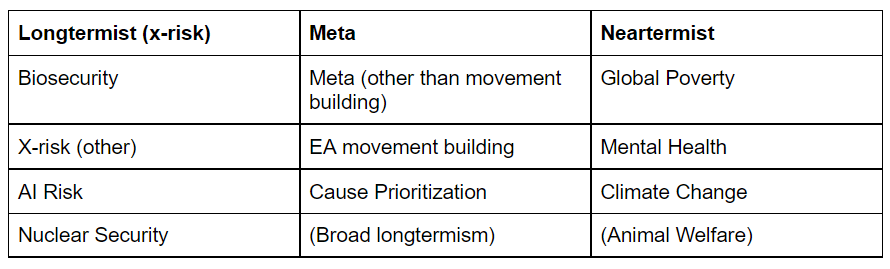
We explored relationships between ratings of different causes by conducting an exploratory factor analysis. This procedure aims to identify latent factors underlying the data (for example, support for longtermism might be related to support for a number of different longtermist causes).
Across a series of different models, we identified three factors underlying the data, with the same causes associated with them to similar degrees. These were:
Note: Broad longtermism and Animal Welfare only very weakly loaded onto their respective factors.
Exactly how to interpret each factor is, of course, somewhat open to debate, but we think that responses to the causes in each of these different groupings can, to a significant degree, be thought of as reflecting common factors, such as support for existential risk reduction causes or neartermist causes.
Predictors of cause ratings
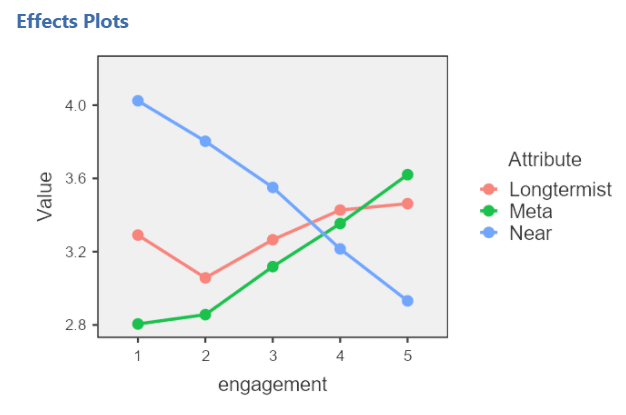
To simplify analysis, we reduced the ratings of the individual causes above into the three groupings identified by our EFA above (‘longtermist’ ‘meta’ and ‘neartermist), by averaging the scores for each of those categories. As before, we used a linear mixed model to account for the fact that respondents each rated multiple causes. We provide the raw average ratings for each individual cause in the tables in Appendix 2.
Another decision we took to simplify the model was to only examine the influence of people’s level of self-reported engagement with EA and gender.
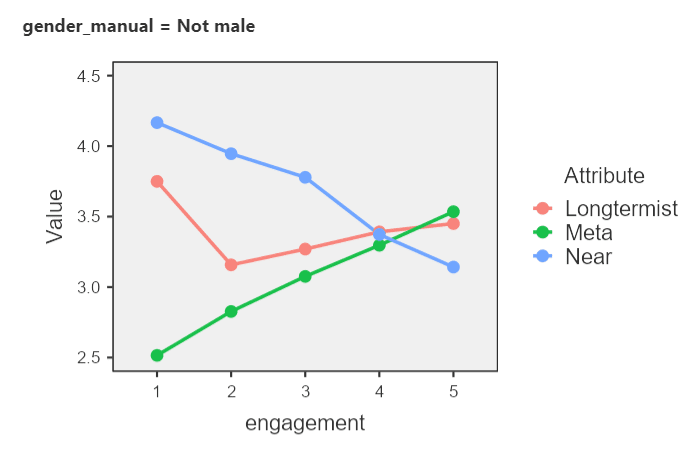
The first plot below simply shows the mean ratings for each of the three broad cause areas across engagement levels. As we can see, average support for Near-termist causes declines with increases in engagement, while support for Longtermist and Meta causes increases.
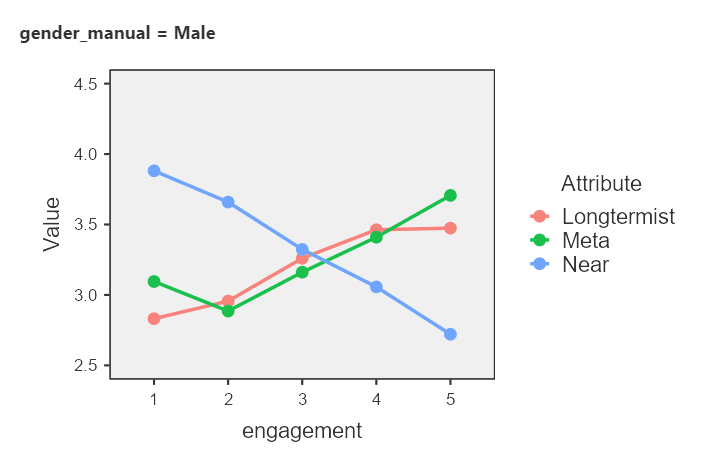
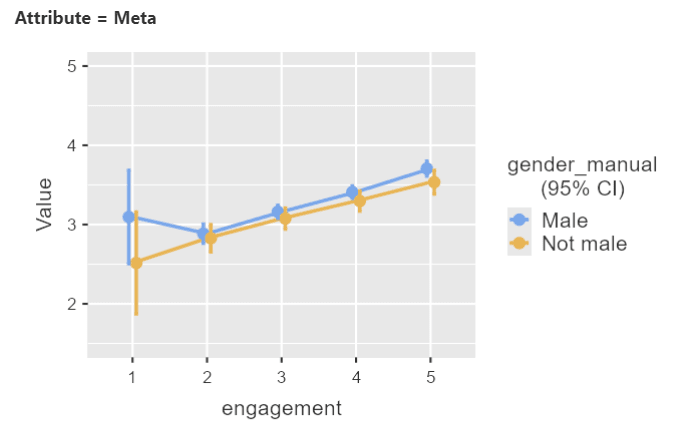
The next two plots show the same relationship between engagement and cause ratings split by gender (male and non-male respectively). We observed a significant interaction effect between gender, engagement and cause, suggesting that the relationship between engagement and cause ratings varies by gender, though the overall pattern is quite similar.
We have previously observed that non-male respondents seem relatively more supportive of near-termist causes than male respondents, and plotting the male and non-male ratings across engagement levels for each cause separately, we can observe that while the average cause ratings of male and non-male respondents at higher engagement levels are quite similar for longtermism and meta, non-male respondents consistently give higher neartermism ratings across engagement levels.
Cause preferences over time
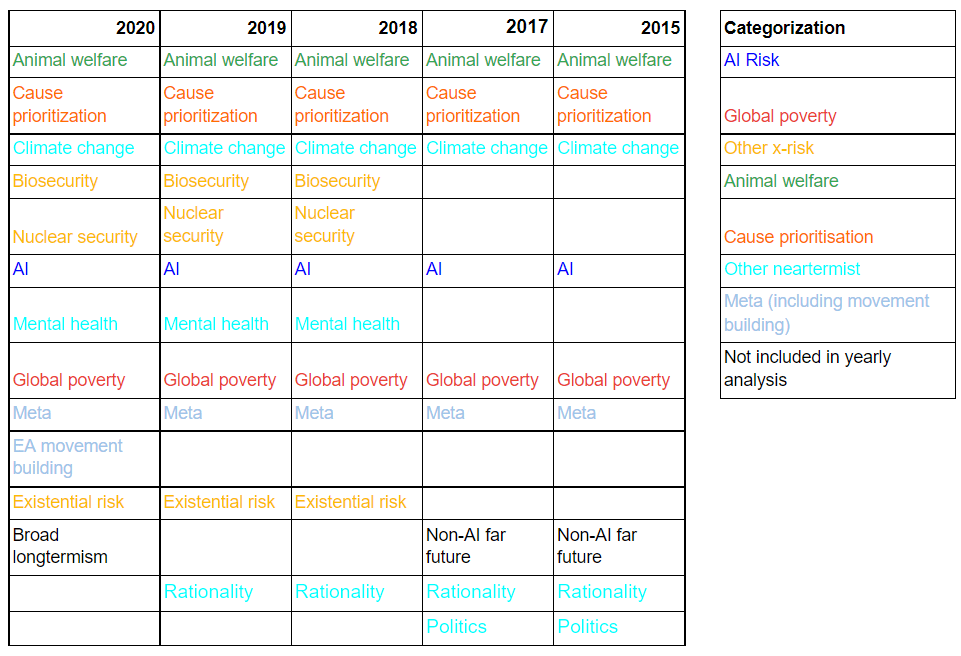
Comparing cause ratings from year to year[4] is difficult since the cause list has changed over time. Although we have tried to keep categories as similar as possible across years, precisely to facilitate comparisons, we have sometimes added, removed or changed categories, as circumstances changed. The classification we have used for each cause is shown in a chart in the Appendix.[5]
This analysis shows the average cause rating across years, based on the responses in each year’s EA Survey. This is in contrast to showing average ratings across cohorts, i.e. EAs who reported joining EA in a given year. It is important to note that this could still reflect a change in the composition of the EA population or sample, rather than a change in views (i.e. it could be that neartermist EAs who responded in earlier years have dropped out, while longtermist EAs have joined).
Note: there was no EA Survey run in 2016.
The clearest change in average cause ranking since 2015 is a steady decrease for global poverty and increases for AI risk and animal welfare. Cause prioritization, other neartermist, and meta appear to have remained fairly constant. The individual causes under other x-risk were only included from 2018 onward, but have shown a slight increase in rating since it was added to the survey.
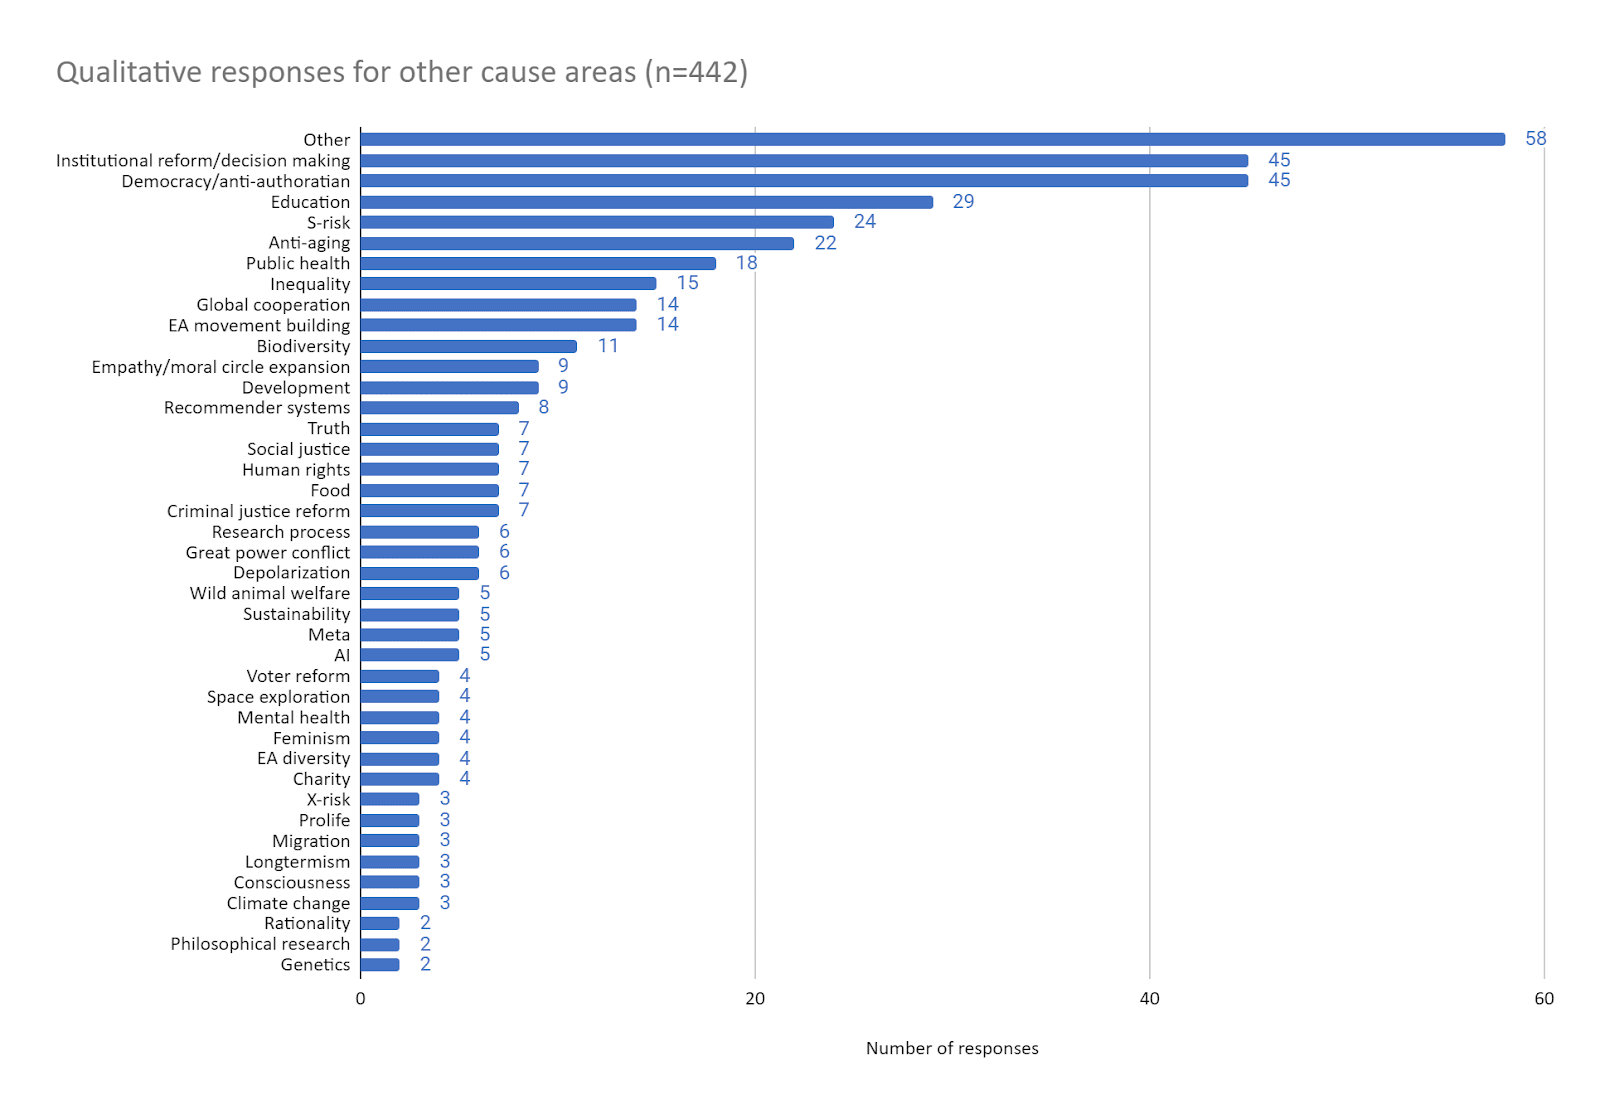
Other Cause Areas (open comment)
We also asked respondents, “Are there any other causes you feel should be priorities for the EA community?” After removing 25 unclassifiable responses, we categorized the remaining 442 replies into 41 categories. The category with the most responses is Other which comprises cause areas with only one response, as well as replies that mentioned multiple causes. After Other, the most commonly mentioned causes are safeguarding democracy/preventing authoritarianism and improving decision making/institutional reform. Other commonly mentioned potential causes include improving education, identifying/preventing S-risk, anti-aging research, public health, and reducing inequality. A full size version of the graph can be seen by opening it in a new tab.
Appendix 1
Appendix 2
Credits
The annual EA Survey is a project of Rethink Priorities. This post was written by David Moss, and Jacob Schmiess. Thanks to Peter Wildeford and David Reinstein for comments.
We would also like to express our appreciation to theCentre for Effective Altruismfor supporting our work. Thanks also to everyone who took and shared the survey.
The full cause labels included in the survey were: Global poverty, Reducing risks from artificial intelligence, Climate change, Cause prioritization, EA movement building, Existential risk (other than AI, biosecurity, or nuclear security), Animal welfare/rights, Broad longtermism (other than existential risks), Biosecurity and pandemic preparedness, Nuclear security, Mental health, Meta (other than EA movement building). ↩︎
The ratings levels were: (1) I do not think any resources should be devoted to this cause, (2) I do not think this is a priority, but should receive some resources, (3) This cause deserves significant resources, but less than the top priorities, (4) This cause should be a near-top priority, (5) This cause should be the top priority. ↩︎
p=0.045 in a Bonferroni adjusted post-hoc pairwise comparison. ↩︎
The 2014 EA Survey also asked about cause prioritisation, but only presented respondents with binary response options, rather than the rating scale we have used since 2015. ↩︎
Causes which have appeared in all surveys are animal welfare, cause prioritization, climate change, AI, global poverty, and meta (albeit with some variation e.g. climate change was included as "environmentalism" in 2015-2017) . Surveys in 2015 and 2017 included non-AI far future and politics as causes. In 2018, we added more fine-grained longtermist/existential risk categories (biosecurity, nuclear security, and existential risk (other). Increasing rationality and decision making was included as a cause for all years prior to 2020. The 2020 EA survey added EA movement building, separate from EA meta, and broad longtermism. ↩︎
This is the third in a sequence of posts taken from my recent report: Why Did Environmentalism Become Partisan?
Summary
Rising partisanship did not make environmentalism more popular or politically effective. Instead, it saw flat or falling overall public opinion, fewer major legislative achievements, and fluctuating executive actions.
Public Opinion...
I think right now EAs might be making a significant mistake by paying insufficient attention to the political realm. As EAs we tend to figure out what’s most impactful for us to work on and focus hard. That’s great! But there are various actions that are ‘non-delegatable’ - the extent to which an individual can do the action is limited (like voting, going to a protest, making hard money contributions to particular campaigns). It might be useful if we were all more in the habit of doing variou...
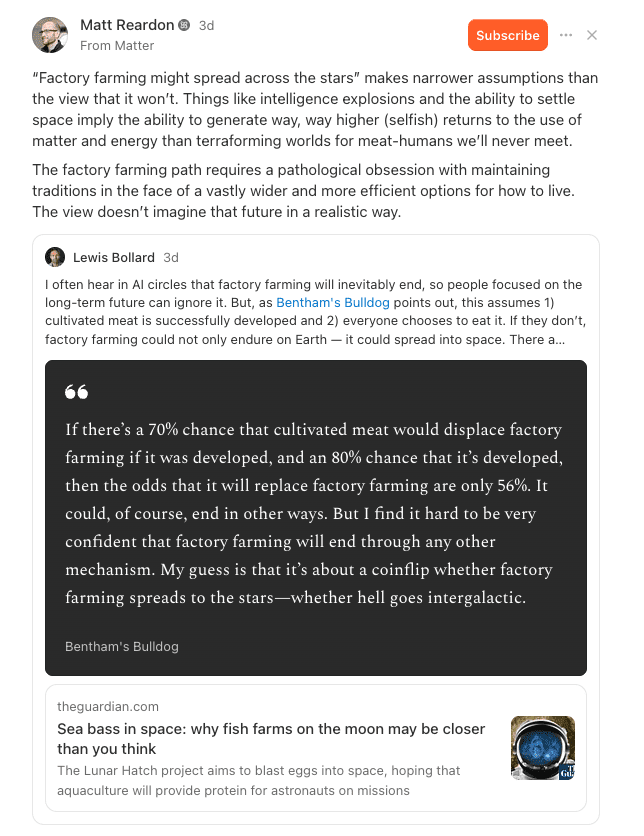
Bentham’s Bulldog recently argued that AI won’t definitely make factory farms obsolete. I agree, but I’d go further and argue that by default AI won’t make factory farms obsolete. However, I think it’s possible (though not guaranteed) that AI could make factory farms a lot more humane.
He throws out an 80% chance of cultivated meat being developed, and a 70% chance of it displacing factory far...


I would love to see research into the direction of causality here. I think it's very easy to assume engagement drives the realisation of belief in longtermism, and much EA messaging supports this - eg Will's(?) statement that longtermism might be the biggest breakthrough of the EA movement. But I know many people for whom it seemed to run the other way - they lost interest over time in part because of the movement's obsession with replacing concrete short term value with (as they see it) motivated speculation.
I agree it's quite possible that part of this observed positive association between engagement and longtermism (and meta) and negative association with neartermism is driven by people who are less sympathetic to longtermism leaving the community. There is some evidence that this is a factor in general. In our 2019 Community Information post, we reported that differing cause preferences were the second most commonly cited reason for respondents' level of interest in EA decreasing over the last 12 months. This was also among the most commonly cited factors in our, as yet unpublished, 2020 data. There is also some evidence from that, as yet unpublished [EDIT: this is now published here], post that support for longtermism is associated with higher satisfaction with the EA community, though I think that relationship still requires more research.
Dealing with differential attrition (i.e. different groups dropping out of the survey/community at different rates) is a perennial problem. We may be able to tackle this more as we get more data tracked across years (anything to do with engagement is very limited right now, as we only have two years of engagement data). One possible route is that, in 2019, we asked respondents about whether they had changed cause prioritisation since they joined the community and if so which causes they switched from. A majority of those that had switched did so from Global Poverty (57%) and most seem to be switching into prioritising the Long Term Future.
It may be possible to estimate what proportion of neartermist respondents should be expected to switch to longtermism across time (assuming no dropout), then compare that with actual changes in the percentage of neartermists across time and see whether we observe fewer neartermists within cohorts across time (i.e. across surveys) than we'd expect given the estimated conversion rate. But there are lots of complexities here, some of which we discuss in more detail in later posts on satisfaction and engagement.
A couple of perhaps weakly suggestive observations are that, within 2020 data, i) engagement is more clearly associated with cause prioritisation than time in EA and ii) we also observe more engaged EAs to be more longtermist (or meta) and less neartermist even within cohorts (i.e. EAs who reported joining within the same year). Looking within different engagement levels, below, the relationship cause prioritisation across time in EA is comparatively flat (an interesting exception being neartermism among those reporting highest engagement, where it drops dramatically among the most recent cohorts (2016-2020), i.e. those who have been in EA a longer are visibly less neartermist, which is roughly the pattern I would expect to see were neartermists dropping out [though it would be odd if that was only occurring among the most engaged]).