Hide table of contents

Cross-posted to my website. I have tried to make all the formatting work on the EA Forum, but if anything doesn't look right, try reading on my website instead.

Last updated 2020-05-17.

Summary

Philanthropic investors probably have greater risk tolerance than self-interested ones. Altruists can use leverage—borrowing money to invest—to increase the expected utility of their portfolios. They may wish to lever their portfolios at much higher ratios than self-interested investors—likely 2:1 to 3:1, and perhaps much higher (practical concerns notwithstanding).

Unlike normal investors, altruists care about reducing their correlations with other investors, so they should heavily tilt their portfolios toward uncorrelated assets.

This essay will discuss:

  1. Traditional vs. altruistic investing
  2. Basic arguments for using leverage
  3. Appropriate levels of risk for altruists
  4. The importance of uncorrelated assets, and where investors might be able to find them
  5. Potential changes for philanthropic behavior

Disclaimer: I am not an investment advisor and this should not be taken as investment advice. This content is for informational purposes only. Please do your own research or seek professional advice and otherwise take reasonable precautions before making any significant investment decisions. Any given portfolio results are hypothetical and do not represent returns achieved by an actual investor.

Glossary

This essay uses a number of terms that may appear unfamiliar. I define most terms when I first use them, but this section provides an easy reference.

(eta): A numeric value for relative risk aversion that determines the shape of an agent's utility function.

  • implies a linear utility function, that is, no diminishing marginal utility.
  • implies logarithmic utility, which is the value most often used in theoretical models.
  • implies sub-logarithmic utility, which empirically describes most individuals' preferences.

Cash: For our purposes, cash does not refer to currency, but to an investment that’s considered safe, such as short-term US Treasury bills. See "Risk-free rate."

Isoelastic utility function: A utility function that exhibits constant relative risk aversion. If someone has an isoelastic utility function, their risk aversion does not change based on how much money they have.

The isoelastic utility function is defined by

where is consumption and is a shape parameter.

Leverage: The process of borrowing money in order to invest more than 100% of one's assets.

Marginal utility: Utility gained when someone gains a new good or service. For our purposes, we care about the marginal utility of money: how much utility a person gains from an extra dollar.

Relative risk aversion (RRA): The extent to which an agent favors safe bets over risky ones. See the definition of .

Risk-free rate: The interest rate investors can earn without taking on any risk, such as the rate earned by short-term US Treasury bills.

Samuelson share (S): The proportion of someone's portfolio they invest in a risky asset.

  • If , they invest their entire portfolio in the asset.
  • If , they invest of their portfolio in the asset and the rest in cash.
  • If , they use leverage to invest more than 100% of their portfolio in the asset.

Utility function: A function that assigns a real number to how much an agent values each possible outcome. In our case, a utility function takes in an amount of money and returns the utility of having that much money.

Introduction

What makes altruistic investing different from traditional investing?

For the most part, altruists and traditional investors have the same incentives regarding how they should invest—they want to invest in the portfolio with the best return for an acceptable level of risk. Altruists and self-interested investors differ in two key ways:

  • Charitable causes probably have slower-diminishing marginal utility of money than individuals, so altruists should seek greater risk.
  • Self-interested people only care about how much money they have, while altruists care about how much money all other (value-aligned) altruists have.

And arguably a third way (more on this later):

  • Traditional individuals avoid certain market-beating factors like value and momentum for reasons that aren't captured by a standard utility function, and altruists do not share these reasons.

Regarding the first two differences between altruists and other investors:

  1. The first difference means altruists should be willing to use more leverage than individuals, to the extent that their marginal utility diminishes more slowly.
  2. The second difference implies that altruists who are thoughtful about investing should not proportionally invest their money in the optimal portfolio; instead, they should attempt to push the overall pool of value-aligned philanthropic money in the direction of optimal.

Improving on conventional investing wisdom

In Common Investing Mistakes in the Effective Altruism Community, Ben Todd describes some ways people can improve their investment decisions over the status quo. Before considering leverage, investors should understand and implement these suggestions.

My essay will assume that readers agree with Todd's section 3, "Not being diversified enough." Quoting the most relevant portion:

Many people I've spoken to are almost fully invested in US equities. I think the rationale for this is that equities have been the best returning asset historically, so there’s no reason to own anything else. Another rationale is that since you can’t beat the market, you should put everything into equities.

But US stocks do not equal "the market". If you try to tally up all global financial assets, you get something like this:

18% US stocks
13% Foreign developed stocks
5% Foreign emerging stocks
20% Global corporate bonds
14% 30 year bonds
14% 10 year foreign bonds
2% TIPs
5% REITs
5% commodities
5% gold

This represents the truly agnostic portfolio. If you think you have no ability the beat the market, then this is the portfolio with the best risk-return. 100% US equities is a huge bet on just one asset.

From 1973 to 2013, a portfolio like this returned 9.9% per year. In comparison, stocks returned 10.2%. So you only gave up a tiny 0.3% to switch to this portfolio.

In return, you had far lower risk. The volatility of the 100% equity portfolio was 15.6%, whereas this diversified portfolio had a volatility of only 8%. The maximum drawdown was also only -27% compared to -51% with equities. The wide diversification also makes you less vulnerable to unforeseen tail risks.

The much lower volatility means you could have levered up 2x and ended up with the same amount of volatility and same drawdowns as equities, but returns that were twice as high, at 20% per year.

Additionally, I would recommend readers review Todd's section 6, "Not beating the market":

Most people I speak to are sold on the "expert common sense" view that amateur investors shouldn't try to beat the market, and should instead invest in index funds. I basically agree with this view. However, if you've got a little more time to put into investing, I think it’s worth considering the idea of tilting your investments towards assets that have value (are cheap based on metrics like P/E and P/B), high momentum (have gone up in the last 12 months, are above their 200-day moving average) and low volatility. If you do this within equities, I think it’s possible to beat the market by a couple of percentage points.

Most people are skeptical when I claim that value and momentum investing beat the market, as I believe they ought to be. Justifying this claim against the efficient market hypothesis requires a high burden of proof. I cannot meet this burden in only a few paragraphs, so I will refer to some longer writings on the subject for anyone still curious.

Asness et al. (2013) Value and Momentum Everywhere examines eight asset classes (US stocks, UK stocks, continental European stocks, Japanese stocks, country equity index futures, government bonds, currencies, and commodity futures) and finds that value and momentum work in all eight.

Two additional papers: Fact, Fiction and Momentum Investing; and Fact, Fiction and Value Investing. Targeted at skeptics, these articles offer high-level summaries and refer to other academic papers that provide evidence for the efficacy of momentum and value.

The books Quantitative Value and Quantitative Momentum, the first by Wesley Gray and Tobias Carlisle, and the second by Wesley Gray and Jack Vogel, discuss value and momentum, respectively. These books discuss why value and momentum work and how the authors believe the strategies can best be implemented. For readers specifically interested in whether or how it is possible to beat the market, I believe Quantitative Momentum gives a more concise and better-reasoned explanation, particularly in the first two chapters.

One could argue that individuals should not avoid value and momentum and behave irrationally by doing so. I mostly agree with this, but individuals do have valid reasons for wanting to avoid value and momentum—they can underperform the broad market for long stretches of time, which many people may find undesirable for various reasons:

  • They care about maintaining social status, and thus are risk averse not only with respect to losing money, but also with respect to losing money relative to their peers.
  • For professional investors, relative (but not absolute) underperformance can cause them to lose clients.

Altruists should not consider these compelling reasons to avoid market-beating strategies and should make efforts to sidestep the behavioral biases that lead people to avoid them.

Risk and leverage for traditional investors

According to standard economic theory, individuals have some level of risk tolerance that dictates how much risk they are willing to take on their investments. For our purposes, we can assume that individuals have some isoelastic utility function, which means there exists a constant > 0 describing someone's relative risk aversion (RRA), and their utility function is given by:

An of 0 corresponds to linear marginal utility of money (that is, no diminishing marginal utility). = 1 indicates logarithmic utility, while > 1 gives sub-logarithmic utility. Different individuals report substantially different RRAs, and different methods of empirically determining give different results; but most people appear to have values ranging from 1 to 4[1].

can be used to determine how much risk someone is willing to take on an investment. For simplicity, suppose only two investments exist: a risk-free investment and a risky one. (The risky investment might not be a single asset, but a diversified combination of stocks and bonds.) Let be the rate of return of the risk-free investment, and let the risky investment follow a log-normal distribution parameterized by and : that is, the logarithm of the distribution is a normal distribution with mean and standard deviation .

Let Alice be an investor with RRA equal to . Alice can invest some proportion of her portfolio into her risky asset; Ayres and Nalebuff in their book Lifecycle Investing refer to this proportion as the Samuelson share.

Under traditional model assumptions, the optimal Samuelson share is given by . If S < 1, Alice should put the rest of her money into the risk-free asset; if S > 1, she should use leverage to invest more than 100% of her portfolio.[2][3]

For most reasonable assumptions about future stock returns and for typical values of , S < 1. That is, most people do not want to invest more than 100% into stocks.

However, Ayres and Nalebuff argue in Lifecycle Investing that people should treat their future income as an asset in their portfolio. Because young people will have much more money in the future than they do today, they should use leverage to diversify their investments across time. If you expect that 90% of your investable earnings lie in the future and you have all your current investments in stocks, your portfolio is effectively 10% stocks/90% future-earnings. If instead you get 2:1 leverage, you now have 20% in stocks and 80% in future earnings, which is more reasonable than 10%/90%. (Arguably you should have something like 5:1 leverage so that your portfolio contains half stocks and half future earnings; but that much leverage brings additional complications, so Ayres and Nalebuff only recommend going up to 2:1.)

Risk aversion for altruistic causes

What RRA () should we use for charitable causes and how does it compare to individuals' RRAs? This is a complex question and I cannot offer a complete answer within the scope of this essay. People often assume that altruists' utility functions lie somewhere between logarithmic and linear (); e.g., Paul Christiano wrote, "I think logarithmic returns are fairly conservative for altruistic projects [...], and that for most causes the payoffs are much more risk-neutral than that." I consider this a reasonable assumption, but the question deserves more investigation. A full analysis is out of scope, but I will briefly model how utility might diminish for three of the most popular cause areas in effective altruism: global poverty, farm animal welfare, and existential risk.

Global poverty

In the long run, marginal utility for philanthropists cannot diminish any faster than the rate of the self-interested individual with the slowest-diminishing utility curve. If some person has a lower than everyone else, once everyone's welfare has been improved to the point where that person has the greatest marginal utility of money, (which might take a long time, but in theory will happen eventually), philanthropists cannot do worse than to simply give their money directly to that person.

But the person with the steepest utility curve might not currently have the highest marginal utility of money, because there probably exist many other worse-off people who need money more. We care about how philanthropists should invest their money right now, which means we want to know what the utility curve of global poverty interventions currently looks like.

GiveWell rates GiveDirectly as one of the top charities working on global poverty. GiveDirectly simply gives cash directly to the world’s poorest people. GiveWell believes cash transfers do not represent the most cost-effective global poverty intervention, but that they probably aren't much worse than the best interventions. And we can analyze GiveDirectly's marginal utility easily because we can model its value in terms of the utility curves of the people receiving the cash. So for now, let's assume GiveDirectly represents the pinnacle of global poverty charities.

For simplicity, let’s assume GiveDirectly has no overhead costs and give the world’s poorest people money without encountering any obstacles. GiveDirectly's goal is to provide as much utility to as many people as possible by increasing their wealth and thus allowing them to buy more stuff that makes their lives better—that is, GiveDirectly wants to maximize the aggregated individual consumption utility function:

where represents the person, is the consumption level of the person, and gives the utility function over consumption for the person. (Note that this aggregate utility function is almost certainly not isoelastic, which means we cannot assign it a relative risk aversion parameter .)

GiveDirectly's mathematically-optimal strategy—assuming all individuals have the same value of (which is false, but a common simplifying assumption in development economics)—is to give cash to the world's poorest person until they have as much money as the second-poorest person; then give cash to the bottom two poorest people until they reach the level of the third-poorest person, and so on.

The world's poorest person and the world's millionth-poorest person have almost the same amount of money, so giving a dollar to the latter does almost as much good as giving a dollar to the former. The world contains many more poor people than GiveDirectly can afford to help, so (given our simplifying assumptions) cash transfers have nearly linear marginal utility of money, at least for donors with less than a few hundred billion dollars[4].

We had to make several simplifying assumptions to reach this conclusion. I cannot say with confidence that the conclusion holds in the real world, but it does seem plausible that this simplified model roughly describes how the global poverty cause operates in terms of its diminishing marginal utility:

  • In practice, GiveDirectly can give money only to people it can reach; but it can reach such a large set of people that this does not substantially affect its rate of diminishing utility.
  • GiveDirectly's overhead costs scale sub-linearly with money donated[5], so they don't cause the utility curve to fall off more rapidly.

Interventions that GiveWell considers more cost-effective than cash transfers, such as deworming, probably experience more rapidly diminishing marginal utility. Or, as GiveWell might say, these interventions have less funding capacity than cash transfers do. Let’s call these "superior" interventions, in the sense that they are superior to cash transfers. We can determine the rate of diminishing by answering three questions:

  1. How much better are superior global poverty interventions than cash transfers?
  2. How much philanthropic money has already gone into superior global poverty interventions?
  3. How much money would need to flow into global poverty before all superior interventions became fully funded?

I don't know the answers to any of these questions, but let's make up some on-the-face plausible answers and see what we get.

  1. GiveWell's cost-effectiveness analysis gives an answer for the first question: GiveWell estimates that its top charities do between 5 and 60 times as much good as GiveDirectly.[6] The 60x charity is an outlier and GiveWell's estimate might not be accurate, so let's suppose the current best charity is 10x as cost-effective as cash transfers.
  2. The USAID budget is $40 billion. We can extrapolate this to perhaps $200 billion per year in global spending, and maybe $10 trillion in the past few decades. Prior to a few decades ago, GDPs were low enough and global poverty spending was unpopular enough that, for the sake of this rough estimate, we can assume prior spending was $0. Of this $10 trillion, maybe $1 trillion is spent effectively. (One could probably come up with a much better estimate with a few hours of research.)
  3. In 2018, GiveWell moved $111 million to top charities other than GiveDirectly (see GiveWell Metrics Report) and moved similar amounts in 2015–2017. GiveWell probably can keep moving money for a while, and its top charities only represent a fraction of better-than-cash-transfers giving opportunities—we should include effectively-utilized money from other philanthropic organizations such as the Gates Foundation. So philanthropists can spend perhaps $100 billion before running out of such opportunities.

Assign the answers to these questions to symbols , , and , respectively. The value of is given by[7]

For the given values of = 10, = $1 trillion, and = $100 billion, we get = 24, which indicates remarkably high risk aversion (most individuals have an RRA between 1 and 4[1:1]). This implies that the 100 billionth dollar spent on global poverty did times as much good as the trillionth dollar, which seems highly implausible.

If instead we assume that global poverty interventions can absorb a full $1 trillion, we get a relative risk aversion of 3.3. Perhaps we also believe that few organizations spent their money ineffectively, and only $100 billion went to effective causes, which means over 90% of the value of superior global poverty interventions has yet to be captured; giving = 1.

Alternatively, we could ask what proportion of superior giving opportunities philanthropists have funded already. This proportion equals , so in the first set of numbers given, this would equal $1 trillion / $1.1 trillion = 0.91.

My intuition suggests that philanthropists have used up most of the superior opportunities, yet they still need much more funding to exhaust them—I would guess we are substantially less than 90% of the way there. (Some people who reviewed this essay had the opposite intuition—that the majority of superior opportunities have yet to be filled.) I do not have any particular expertise on this issue and find a wide range of answers plausible, which means could plausibly take on many values. But it does seem unlikely that cash transfers would have a much smaller than self-interested people's, while other global poverty interventions would have a much larger .

To view from another angle, and pump intuitions in a different way: How much money do we believe superior interventions can absorb relative to cash transfers? I would guess that superior interventions can absorb close to as much funding as cash transfers (to within a factor of two), which suggests that the two s cannot differ by much.

It might make more sense to model superior giving opportunities using a non-isoelastic utility curve (i.e., the value of is not fixed). This would violate many of the assumptions in this section, requiring much more analysis.

Ultimately, my weakly-informed guess is that superior global poverty interventions experience diminishing marginal utility at a slightly but not much higher rate than cash transfers.

Farm animal welfare

If we wish to fund interventions that attempt to reduce the incidence of factory farming or improve farm animals' well-being, what diminishing marginal utility might we expect these interventions to experience?

We can think about farm animal welfare as an extension of global poverty in at least two different ways, each of which results in a different model and a different answer for .

The first way: We can consider factory farming interventions in the same way we examined superior global poverty interventions. Some amount of money has been spent on preventing factory farming; and some additional amount of money can be spent before efforts on farm animal welfare are no more cost-effective than cash transfers. We can answer the same three questions we raised in the previous section and find the value of for factory farming interventions.

We probably believe that the best farm animal interventions are more cost-effective than the top global poverty interventions, meaning we assign a greater value to . All else equal, a larger results in a larger —that is, greater risk aversion.

Pushing in the other direction, probably only a small fraction of value in the anti-factory-farming space has been captured already, which means the proportion is small.

Some example values:

  • if and , then
  • if and , then
  • if and , then
  • if and , then

The second way: When considering cash transfers, we looked at how much money it would take to improve the station of the N worst-off people so that they become as well off as the (N+1)<sup>th</sup>-worst off person. We can extend this model by looking at a set of sentient beings including both humans and factory-farmed animals (and naturally we could extend this to include other beings as well, but for now let's just consider those two categories). As a weird but useful and sort-of-correct abstraction, assume factory-farmed animals consume money in the same way that humans do, but that they're really, really poor, so they have extremely high marginal utility of money. Then philanthropists should give money to help animals until all the animals are as well off as globally poor humans. According to this model, donations to farmed animal welfare have nearly linear marginal utility.

This model seems plausible in some respects, but the first model requires unreasonably small values of and/or to produce a similar answer. Both of these models have several obvious shortcomings. They are only meant to be a rough start, not a definitive answer.

Existential risk

Work on existential risk reduction often involves doing research: exploring ways of neutralizing engineered super-viruses, studying how to create stable AI systems, etc. Other types of work can be done, but I will focus on research for now.

Effective researchers begin by focusing on the most promising potential directions. As funding for a field increases, researchers begin pursuing less promising avenues. How quickly does the value of research diminish?

Owen Cotton-Barratt claims in an article, The Law of Logarithmic Returns, that the returns to research grow logarithmically with resources invested. He refers to Nicholas Rescher's book Scientific Progress: "starting with the observation that progress (counted in terms of the number of "first rate" discoveries) goes linearly with time while resources increase exponentially, [Rescher] deduces that the underlying behaviour is a logarithmic return to resources." Cotton-Barratt presents some additional empirical evidence suggesting that returns to research scale logarithmically. His follow-up article, Theory Behind Logarithmic Returns, provides theoretical justification for this observation.

Additionally, I spoke with some people involved in existential risk research, and they (independently) agreed that research probably produces logarithmic returns.

Logarithmic returns entail . Investors with logarithmic utility have greater risk tolerance than most individual investors by a factor of perhaps 1.5 to 4, but still much less risk tolerance than someone with near-linear utility (such as a donor to GiveDirectly).

Note that this applies to any research-based cause, which could include potential existential risks such as AI safety, biosecurity, and climate change, but also can include other cause areas such as disease prevention, macroeconomic policy, and anti-aging.

Risk aversion for altruists

Uncorrelated small donors are nearly risk-neutral

Suppose you are a philanthropist with a relatively small amount of money, and your investments have no correlation with other philanthropists'. (This second assumption rarely holds true in practice, but let's take it as a given for now.) If you want to donate to a cause that already has much more money than you do, you have nearly linear marginal utility of money, which means you should behave nearly risk-neutrally.

As a numerical example, let's say your preferred cause area has $1 billion in funding and you currently have $1 million. Further suppose that this cause has logarithmic utility of money, which means $1 billion produces log(1 billion) = 20.723 utils (where a util is an abstract measurement of utility). If you add your $1 million, your cause now gets log(1,001,000,000) = 20.724 utils, giving (approximately) an extra .001 utils.

If the cause as a whole doubles its funding to $2 billion, the utility will increase from 20.723 to 21.416—so the first $1 billion is worth far more than the second billion. If you double your $1 million to $2 million, the utility of the cause increases to 20.725. Your first million provides .001 utils, and your second million provides an additional .001 utils. The second million does provide less value, but only slightly less—if we use more significant figures, we can see that the first million gives .00999 utils and the second million gives .00998.

To look at it another way, suppose you have the choice between getting either (A) $X with certainty, or (B) 50% chance of getting $2 million and 50% of getting nothing. At what value of X are you indifferent between A and B? Most self-interested people would probably say something in the range of $50,000 to $300,000, with some people going somewhat higher or lower.[8] But in this example, your value of X would be $999,500.

How risk-averse are large donors?

While uncorrelated small donors experience nearly linear marginal utility of money, large donors do not. For our purposes, a large donor is one who can fund a significant fraction of their preferred cause area. A donor who is the sole funder of a cause experiences diminishing marginal utility at the same rate as the cause itself, as discussed in Risk aversion for altruistic causes.

Correlated small donors look like large donors

Unlike individual investors, small donors do not care only about how their own portfolios perform. Altruists who want their causes to receive more funding also want fellow donors' investments to perform well.

Quoting Paul Christiano:

[T]he fact that I am a small piece of the charitable donations to a cause shouldn’t matter. My risk is well-correlated with the risk of other investors, and if I lose 10% of my money in a year, other investors will also lose 10% of their money, and less money will be available for charitable giving. This holds regardless of whether a cause has a million donors or just one.

In effect, many small donors with highly correlated investments have similar risk preferences to a single large investor.

Time diversification

The book Lifecycle Investing explains the concept of time diversification (an excerpt from the first chapter, which introduces the concept, is available online). The basic idea: Treat your future income as an asset in your investment portfolio. Suppose you have $10,000 in investments and expect to invest an additional $90,000 of your earnings over the next 20 years. In that case, you have invested only 10% of your lifetime savings. If you invest in a standard 60% stocks/40% bonds portfolio, you will have $6,000 in stocks today but $60,000 by the time you retire (adjusted for inflation and market returns). That means you have much more exposure to market fluctuations in 2040 than in 2020. You can solve this by diversifying across time: applying leverage to your current $10,000 portfolio while holding more bonds or cash in 2040.

The principle of time diversification applies to philanthropists as well, in two different ways:

  1. You should consider the donations you can make with your future income.
  2. The future might contain more value-aligned altruists who will increase the size of the philanthropic money pool.

Lifecycle Investing provides information on how to determine optimal leverage at each point in time given various assumptions, particularly in chapters 3 and 4.

According to Lifecycle Investing, investors should calculate their optimal Samuelson share. Then they should consider the discounted present value of their future income as an asset in their portfolio, and hold stocks in the correct proportion of their lifetime portfolio. For example, an investor with $10,000 in stocks and $90,000 in discounted future earnings[9], and with a Samuelson share of 0.6, should ideally hold 60% in stocks. Therefore, they should theoretically invest with 6:1 leverage to get their stock holding up to $60,000. Their overall portfolio would then look like this:

 $60,000 stocks
-$50,000 debt
 $90,000 future cash

which can be simplified to

 $60,000 stocks
 $40,000 cash

giving the investor their desired portfolio.

Similarly, if you are the sole funder of a cause, you currently have $10 million, and you expect the cause's funding in the future to increase to $30 million in present-value dollars, then you can treat that extra $20 million as cash in your portfolio, and increase your current portfolio's risk by 3x. If you have a Samuelson share of 1, increase your risky holdings from 100% to 300% (that is, 3:1 leverage); at a Samuelson share of 0.5, increase risky holdings from 50% to 150%.

For already-popular causes such as global poverty, we might expect future funding to continue increasing at the historical rate. If global poverty donations grow with GDP, we should treat this as a bond in the global poverty investment portfolio that pays the GDP growth rate in interest. Assuming $20 billion in annual effectively-directed global poverty donations (from the rough estimate given above) and 1% real GDP growth, we can treat global poverty donations as a $2 trillion asset that grows at 1% real per year and has the same risk level as GDP growth. If we look only at the GiveWell money moved of ~$100 million and assume it will grow with GDP (historically it has grown faster than that), this suggests we treat future GiveWell donations as an asset worth $10 billion.

Many causes that effective altruists prioritize do not see much mainstream interest, but might expect to get much more interest in the future. For example, a few years ago, AI safety had hardly any funding, but recently has been growing in popularity. For such causes, philanthropic investors may wish to substantially lever up their portfolios to create time diversification. But also consider that if future funding looks uncertain, investors may wish to take on less risk.

Adjusting for other altruists' investing behavior

Suppose there exist two risky assets A and B. Almost all investors invest in A, and hardly anyone invests in B, but both provide similar risk-adjusted return. An ordinary investor should maximally diversify by splitting their assets into approximately half A, half B.

Altruists care how much money other value-aligned altruists have. As discussed above, they wish to reduce their assets' correlation with other altruists', not just with their own. Therefore, the optimal allocation would not be 50% A/50% B, but perhaps 100% B. If most people heavily overweight asset A, then an investment-minded philanthropist can move the "altruistic portfolio" closer to optimal by investing only in B.

Additionally, the pool of philanthropic money has some optimal Samuelson share. If the aggregate altruistic portfolio does not reach that risk target, then thoughtful investors can compensate by over-leveraging to make up for others' insufficient leverage. (If most altruists take on too much risk, one can compensate by holding extra cash, but this seems unlikely in practice.)

These considerations matter a great deal. If your portfolio only makes up a small part of the altruistic portfolio, this suggests that you should hold no conventional assets and instead invest your entire portfolio in something weird-looking in order to maximize uncorrelated return. It also might mean you should take on a huge amount of leverage and incur a near-certain probability of bankrupting the altruistic portion of your portfolio in order to increase the overall risk and return of the altruistic money pool.

Ideally, altruists would agree about optimal investment choices. Suppose Alice invests in 100% US equities while Bob goes 100% short on US equities. If they share values, they have a mutual interest in ensuring that the other invests optimally. One of them must be making a mistake, so they should come to an agreement about how they both should invest. Insofar as it is possible, rather than unilaterally attempting to shift the altruistic money pool, we should cooperate with other philanthropists and come to a consensus on how to invest.

Although most altruists do not diversify well or take on enough risk, it is plausible that large philanthropists—who hold a disproportionate share of the altruistic money—invest better. Investment-minded altruists should particularly care about how large donors invest. If they already invest optimally, that means small donors have less of a reason to try to shift the overall investment pool.

What if RRA varies over time?

If a philanthropist's utility curve does not follow the isoelastic utility function defined above, they do not have a single fixed value of . If increases or decreases over time, we cannot simply look at the optimal amount of investment risk to use at a particular point in time and then maintain it forever. Furthermore, we do not necessarily want to vary leverage over time based on the value of .

First, some simplifying assumptions:

  1. You will invest your money until time , at which point you will donate it. Let be your RRA at this time. You will donate all your money at once, rather than donating over time according to some schedule.
  2. You do not have enough money to meaningfully shift the utility curve, so the value of does not change as a result of your donation.
  3. You know the optimal time to donate. (In actuality, the optimal value of depends on the shape of the utility curve, so we cannot know it without first knowing .)

Under these assumptions, the marginal utility of your donation depends only on , not on the value of at any other time. determines the relative risk aversion of your donation, which means it tells you how much risk you should take on. The desired level of risk is given by the Samuelson share formula:

(Recall that = expected return of investment, = standard deviation, and = risk-free rate.)

Donors can decrease correlation

Because most donors' investments are correlated, their utility curves fall off more rapidly than if they were independent. But it is not destined to be this way.

If correlated donors experience logarithmic (or worse) marginal utility and uncorrelated (small) donors experience nearly linear marginal utility, donors should care a lot about finding uncorrelated sources of income.

What sorts of uncorrelated assets can we find, and what rate of return can we expect from them? In this section, I will survey a few asset classes worth considering. This is not meant to be an exhaustive list, nor will I describe in detail the pros and cons of each; this list is just meant as a starting point. For more on some of these diversifiers, see AQR (2018), It Was the Worst of Times: Diversification During a Century of Drawdowns.

Note that if all altruists started investing in these diversifying asset classes, they would no longer provide as substantial diversification benefits. But I don’t expect that to happen in the near future.

(Individual investors should care just as much about decreasing correlation by diversifying. The difference is that ordinary investors can simply hold an optimal portfolio; but altruists care about other altruists’ money, so they may want to overweight diversifiers relative to what an individual investor would do.)

Bonds

Historically, bonds have had near-zero correlation to stocks (even anti-correlation at times). Most investors already hold bonds as well as stocks, however, so adding bonds to our portfolio does not do much to reduce our correlation to other donors.

Commodities

Fewer donors invest in commodities. Commodities provide low correlations to stocks (but usually still positive), and by carefully selecting good investment vehicles, they can provide positive (but probably not great) return. For more, see Levine et al. (2016), Commodities for the Long Run.

Managed futures (trendfollowing)

A better idea than bonds or commodities might be managed futures. These are actively-managed long/short strategies that intend to provide uncorrelated returns. Managed futures funds usually use trendfollowing: going long on assets that have been trending upward over a certain time horizon, and going short on assets that have been trending downward. When I discuss managed futures in this essay, I am talking specifically about ones that use trendfollowing strategies.

Hurst et al. found promising results in Demystifying Managed Futures (2013). According to a backtest described in the paper, a diversified managed futures strategy (investing across stocks, bonds, commodities, and currencies) produced a return of 19.4% with a standard deviation of 10.8%, and an alpha over stock, bond, and commodity indexes of 17.4% (figure 2, page 49). That is, the managed futures strategy produced a 17.4% return that was not explained by the return of stocks, bonds, or commodities. This suggests that managed futures provide a strong uncorrelated source of returns not captured by most investors.

I highly doubt that actual investors can realize a risk-adjusted return as high as what the Hurst paper found in its backtest, but I do expect managed futures strategies to be worth pursuing in some circumstances. For more on how managed futures strategies behave and why they might provide alpha, see the paper. And for further evidence, see Hurst et al. (2014), A Century of Evidence on Trend-Following Investing, which tests managed futures trendfollowing strategies going back to 1880.

Going forward, I expect managed futures to perform worse for three primary reasons:

  1. The 19.4% figure does not include fund fees or transaction costs.
  2. Managed futures strategies depend on interest rates, which are much lower now than they were over the studied period.
  3. More investors today use managed futures strategies than did in the 80's, 90's, or early 00's. (But note that managed futures strategies have gotten less popular over the past decade.)

At the same time, Hurst et al. offer some reasons to be optimistic about future performance:

  1. Transaction costs have been decreasing over time as markets become more liquid.
  2. Investors have access to markets that were not previously investable, such as emerging market equities and emerging market currencies.
  3. Even assuming muted future returns, trendfollowing still provides valuable diversification.

The paper provides some quantitative analysis on how managed futures benefit a portfolio even if they produce much worse returns than they did historically.

Why do managed futures strategies provide alpha? Why have they not been arbitraged away? The answer is not known for certain, but the most reasonable hypothesis is that the majority of investors avoid it because it can underperform their benchmark for long periods of time. I cannot do this hypothesis justice, but in brief, consider this performance chart of a managed futures mutual fund (EQCHX) compared against the S&P 500 over the five-year period from 2014 to 2019 (the dark blue line is EQCHX and the light blue line is the S&P):

<img src="http://mdickens.me/assets/images/eqchx-sp500.png" />

As discussed above, most investors benchmark their returns against an index like the S&P 500, and would be unwilling to suffer five years of dramatic underperformance.

For more on this hypothesis, see AlphaArchitect (2015), The Sustainable Active Investing Framework: Simple, But Not Easy.

Will managed futures continue to work? AQR (2018), Trend Following in Focus, discusses this question and concludes that they probably will. In short, managed futures strategies do not appear over-subscribed, and although they have performed poorly over the past few years, similar stretches of poor performance have occurred many times in the past.

Eventually, of course, managed futures strategies will no longer provide uncorrelated returns. (Even if only a small percentage of investors ever adopts such strategies, over time those investors will become richer until they have enough money to eliminate the market inefficiency.) But until then, it appears that small donors with the ability to invest in managed futures can get nearly linear marginal utility of money by doing so.

Buy-and-hold long/short strategies

Altruists might consider pursuing buy-and-hold long/short strategies (as opposed to managed futures, which are actively-traded long/shorts). That is, buy some asset that has moderate but not perfect correlation to what you believe most philanthropists own and short-sell the standard philanthropists' portfolio. Say you believe all philanthropists put all their money in the S&P 500[10]. You could buy a global excluding-US stock market index, which has high but not perfect correlation with the S&P 500, and then short the S&P. As a result, you can get a return stream that's uncorrelated with other altruistic investors. For example, if the S&P and the global ex-US market are correlated with r=0.8, you could put 500% of your money in the global ex-US market (that is, 5:1 leverage) and short 400% of the S&P 500, for a net 100% market exposure with zero correlation to the S&P. (That is not actually how the math works, but for the purposes of this example, it doesn't matter.)

At first glance, this seems wasteful: you are shorting an asset that other altruists hold, so your investments cancel each other. But this is still a good idea given the assumption that the S&P-buyers are making a mistake. By using a long/short strategy, you can increase the combined return of all philanthropic money without increasing risk. In other words, you are moving the pool of philanthropic money closer to an optimally-diversified portfolio, and you are doing so more effectively than if you just bought the global ex-US index. Of course, it would be even better to convince other altruists to improve their portfolio holdings.

I suspect (although do not have much evidence) that philanthropists under-weight quite a few asset classes, such as global stocks (especially emerging-market stocks), gold, commodities, and emerging-market bonds. A philanthropic investor might want to buy some of these assets while shorting overweighted ones. An investor might particularly want to do this if they do not believe that managed futures perform as well as I suggested in the previous section.

Note that individual investors would never want to use this sort of strategy. The only reason this type of long/short might make sense is because you believe some investors' money brings as much value to your utility function as your own money does, but those other investors are under-diversified, so you want to make up for that lack of diversification.

Long/short factor premia

AQR (2018) identified long/short factor premia as the best diversifier according to its backtests. In brief, a long/short factors strategy invests in market-beating factors (such as value and momentum, discussed above) by going long on "good" assets while going short on "bad" assets (according to the factors), producing a market neutral position. For a detailed analysis of this strategy, see Ilmanen et al. (2019), How Do Factor Premia Vary Over Time? A Century of Evidence.

AQR has a Style Premia Alternative Fund (QSPNX) that appears to attempt to follow the strategies identified in Ilmanen et al., although I have only briefly read the fund literature. However, this fund has a $1 million investment minimum, and I am not aware of any similar funds that retail investors can access. The AQR and Ilmanen papers suggest that sufficiently-wealthy altruistic investors may want to invest in a long/short factor fund as a diversifier, and QSPNX might be a reasonable way to do that.

Startups

Another low-correlation investment opportunity, suggested by Paul Christiano:

[I]f you start or invest in a small company, your payoff will depend on that company’s performance (which is typically quite risky but only weakly correlated with the market). [...] This special case is only possible because the entrepreneur or investor is putting in their own effort, and moral hazard makes it hard to smooth out all of the risk across a larger pool (though VC funds will invest in many startups). You shouldn’t expect to find a similar situation in investments, except when you are providing insight which you trust but the rest of the market does not (thereby preventing you from insuring against your risk).

Mission hedging

Some altruists have discussed the concept of mission hedging:

How should a foundation whose only mission is to prevent dangerous climate change invest its endowment? Surprisingly, in order to maximize expected utility, it might use ‘mission hedging’ investment principles and invest in fossil fuel stocks. When oil companies perform well (which means they are contributing more to climate change), the anti-climate change foundation will have more money. When more fossil fuels are burned, fossil fuel stocks go up, thus giving the foundation more money. When fewer fossil fuels are burnt and fossil fuels stocks go down, the foundation will have less money, but it does not need the money as much anymore.

A philanthropist could mission hedge and obtain low correlation with other altruistic investors by buying a mission-hedge investment (such as fossil fuel stocks) while simultaneously shorting the broad market. This would not provide ideal diversification because altruists who invest in index funds will still have some exposure to the same risk factors as the long/short mission hedge strategy, but it will reduce correlation.

My impression is that altruistic investors should prioritize maximizing risk-adjusted return, then focus on reducing correlation with other altruists. Mission hedging provides only tertiary value and should be avoided insofar as it impedes the first two goals. But I have not studied mission hedging, and I could be wrong.

What if everyone did this?

If you invest in a particular source of return that's uncorrelated to the broad market, and many other philanthropists do, too, you have formed a pool of correlated investors, which means your utility curve behaves as if everyone in that pool is a single large donor. Naturally, you would prefer to invest in an asset that's not correlated with any other altruist's investments. But an uncorrelated asset with, say, $10 million in philanthropic money still provides much greater marginal utility than the S&P 500, in which orders of magnitude more value-aligned philanthropists already invest.

I doubt that huge sums of philanthropic money will flow into unusual investments like managed futures in the near future, which means those people who do make such investments might experience nearly linear marginal utility of money. That said, most of the arguments in this essay rely on the assumption that the overwhelming majority of altruistic investors will not change their behavior. For the most part, the proposals in this essay eventually will stop being a good idea if enough value-aligned philanthropists adopt them.

Return expectations

The Samuelson share formula requires four parameters: , , , and . We have discussed in some depth, but have not addressed the values of the other three parameters. What might we expect?

Investment firm Research Affiliates (RAFI) publishes an estimate of return expectations based on solid methodology. RAFI updates its predictions regularly based on changing market conditions, but as of this writing, it predicts a 0.4% return after inflation with 14.4% standard deviation for US large-cap stocks over the next 10 years (with a 95% confidence interval of -3.4% to 4.1% return). But of course, investors should diversify beyond US stocks. RAFI estimates that the optimally-diversified portfolio will provide 1.6% real return with 4.0% standard deviation. Investors who hold this portfolio may want to use much more leverage than investors in US stocks, if only because it has a much lower standard deviation. Alternatively, RAFI's optimal (un-levered) portfolio at the 12% volatility level has 4.5% expected real return; this portfolio has slightly worse return-to-risk ratio (0.375 instead of 0.4), but requires less leverage.

We care about , not just . We subtract the risk-free rate because (1) if we hold cash, that cash can earn the risk-free rate; and (2) borrowing money to use leverage requires paying the risk-free rate in interest (at least in theory, see Cost of leverage). Investors can earn without taking on any risk, so in some sense it doesn't count, and we should subtract it out. The current risk-free rate after inflation nearly equals zero, so we can assume without losing much precision.

As discussed above, investors probably can outperform a fully diversified portfolio by tilting toward value and momentum. Most implementations of value and momentum (such as the Vanguard Value ETF) track a broad market index and only use a weak value or momentum tilt—they have low active share.

What kind of returns might we expect from a high-active-share value/momentum fund? Investment firm AlphaArchitect maintains an index it calls the Global Value Momentum Trend Index, investable through the ETF VMOT.[11] This index only invests in the top ~5% of stocks matching its criteria. Comparing AlphaArchitect's backtest from 1992 to 2017 against index returns from the Ken French data library, VMOT would have returned 17.4% with a 13.6% standard deviation (before subtracting fees and inflation), versus 9.3%/15.0% for the US + Europe stock markets (which makes for a reasonable benchmark).

For a longer backtest, I attempted to approximate VMOT's methodology using the Ken French Data Library entries on momentum and value (earnings-to-price), which go back to 1952[12]. These data only include US stocks, and we have theoretical reasons to expect the simplified investment strategy represented by these data to (slightly) underperform VMOT[13]. Over the full sample back to 1952, it returned 18.3% with a standard deviation of 16.2%—performing better than in the more recent period. We do not have data on how VMOT might have performed before 1992, but based on results from the Ken French data, it probably would have performed about as well or possibly better than it did in the 1992 to 2017 backtest.

Going forward, we cannot necessarily expect the same returns from a strategy like VMOT. RAFI predicts an average 2.8% return for the global stock market index over the next 10 years. This suggests a differential of 9.3% - 2.8% = 6.5% between historical nominal return and future real return.[14] If we subtract 6.5% from the historical VMOT return, and subtract an additional 2% for fees and costs (which is the figure AlphaArchitect uses), we get an 8.9% expected real return for high-conviction value and momentum strategies like VMOT. This is a rough estimate, not an accurate figure. Arguably we should assume value and momentum will not perform as well in the future as they have in the past, and apply an additional discount to this 8.9%. If we discount the excess return by half, we get a 5.9% expected return for VMOT. I will not apply this discount in my calculations, but we should be aware that doing so would change our ultimate estimate of how much leverage to use.

As something of a corroboration, RAFI provides estimates of forward-looking five-year return for various long/short factors. At the time of this writing, it makes the following predictions for its long/short value and momentum factors (net of transaction costs):

  • 5.7% for US large-cap value
  • 1.1% for US large-cap momentum
  • 8.0% for US small-cap value
  • 6.4% for US small-cap momentum

(RAFI's projections for foreign developed market factors are similar but generally a bit higher.)

A concentrated long-only portfolio on a particular factor would have approximately the same expected return as the long/short factor plus the broad market (although that's not quite how the math works).

The underlying indexes used by VMOT make some improvements on RAFI's simple factor model (see Quantitative Value and Quantitative Momentum for details[15]), so it might be reasonable to assume a higher expected return for VMOT. If we then subtract fees, we get something close to the original estimate I gave for VMOT (probably a bit higher[16]).

RAFI believes the value and momentum premia will work as well in the future as they have in the past, and some of the papers I linked above make similar claims. They offer good support for this claim, but in the interest of conservatism, we could justifiably subtract a couple of percentage points from expected return to account for premium degradation.

Note that RAFI's estimates use factor timing—attempting to guess how well factors will perform based on the current market environment, rather than just looking at historical behavior. This practice is not widely accepted; for example, see Asness et al.'s Factor Timing is Deceptively Difficult (2017). Also note that these numbers only give expected mean return. Even if these estimates are accurate, we could still see much higher or lower returns due to market volatility.

Uncorrelated returns

As discussed above, altruists have a few options for seeking uncorrelated (or weakly-correlated) returns. Of the (investable) options discussed, managed futures appear best.

The previously-discussed paper A Century of Evidence on Trend-Following Investing found that a diversified managed futures strategy returned 11.2% (nominal) with 9.7% standard deviation over the period 1880 to 2013, after adjusting for estimated fees and transaction costs. As I said above, I do not expect investors to realize returns this high in practice; I would expect a managed futures fund to underperform VMOT after fees and costs, but probably outperform the US stock market on a risk-adjusted basis over the next 10 years. I don't know much about managed futures—I've read a few papers and done some analysis based on AQR's published data, and that's my guess based on what I know.

Chesapeake Capital's managed futures fund (EQCHX), discussed previously, has published performance data (net of fees) going back to 1988. From 1988 to 2020, it returned 9.8% (nominal) with a 19.2% standard deviation. If we subtract inflation and de-leverage to match the risk level of the AQR managed futures strategy, we come up with about a 4% real return with 11% standard deviation.

As discussed in Trend Following in Focus (referenced previously), we have reason to expect managed futures to perform about as well going forward as they did in the past. We don't know if the 31-year sample for EQCHX is representative of more long-term performance, but it gives a more conservative estimate than the AQR data, so we can use this as a rough projection of future performance. Performance could look dramatically different in the future, but this estimate makes about as much sense as any.

Long-run market return

Market-beating strategies such as value and momentum, and low-correlation, positive-return strategies such as managed futures, almost certainly will perform worse as time goes on. At present, it appears that only a small percentage of investors has high enough tolerance for tracking error to invest in these sorts of strategies. But over time, these investors will become richer and eventually eliminate the market inefficiency.

The Ramsey equation gives the long-run rate of return in an efficient market:

where:

  • = investment rate of return
  • = pure time preference
  • = relative risk aversion
  • = economic growth rate

This equation holds because individuals discount future money at rate , so they will require that investments return at least this much; and investments that return more than this will experience inflows until the expected return drops to .

(If historical market returns roughly continue, we can probably expect equities markets to return 3-5% after inflation in the long run.)

An investor maximizes long-run expected utility by, at each point in time, maximizing expected utility for the next point in time[17]; and maximizes expected utility at each time step by investing at the level given by the Samuelson share formula based on the expected return and standard deviation at each time . Therefore, the long-run expected return does not affect what risk level investors should adopt today.

Caveats

Markets do not behave the way standard theoretical models suggest they do. This section discusses some deviations from theory and how that affects leverage.

Behavior of leveraged investments in practice

Before using leverage, investors should understand how different implementations of leverage can behave in practice. Brian Tomasik’s Should Altruists Leverage Investments? discusses this in detail, with extensive simulations; Colby Davis’s The Line Between Aggressive and Crazy provides a more concise discussion of the most important points. Note that Davis’s article, although it does not say so explicitly, assumes investors have a logarithmic utility function; so some of its conclusions do not apply in the same way for other utility functions. For example, the formula he gives for optimal leverage is a special case of the Samuelson share formula with .

Mean reversion

If asset prices follow a random walk, increasing leverage proportionally increases expected value. Unfortunately, prices probably do not (entirely) follow a random walk.

In the short run (on the timescale of days to weeks), stock prices tend to overreact and then mean revert[18]. This essentially means that median outcomes happen more often, while high-variance outcomes (where the market goes up and then up again, or down and then down again) occur less often.

As explained by Brian Tomasik, when asset returns are independent across time, leverage proportionally increases mean return, but less-than-proportionally increases (and possibly decreases) median return. Because short-term mean reversion increases the probability of median outcomes, it makes leverage look less appealing.

Additionally, markets exhibit long-run mean reversion over the timescale of years: assets that have gone up (or down) a lot over the past three to five years tend to go down (or up) over the following year. Fortunately, we can adapt to this phenomenon by adjusting our return expectations based on asset valuations, which Research Affiliates does in its estimates that I quoted previously. (Perhaps we could adapt to short-term mean reversion as well, but it would require updating return expectations on a frequent, e.g., daily, basis.)

Assets exhibit medium-term momentum: price trends over the past 6-12 months tend to continue over the next 1-3 months. This works in favor of leverage by increasing the probability of high-variance outcomes while decreasing the frequency of median outcomes.

In summary, there exist three well-established types of price trend: short-term mean reversion, medium-term momentum, and long-term mean reversion. The latter two can work to our advantage (or at least they don’t hurt us), while short-term mean reversion makes leverage look worse. How this affects the value of leverage overall warrants further investigation.

Left skew of investment returns

So far, I have assumed that asset returns follow a log-normal distribution. Asset pricing models traditionally assume log-normal returns, so this assumption has well-established precedent. Unfortunately, it is false.

In practice, asset returns skew to the left: highly negative returns occur more frequently than a log-normal model predicts. Any investor with a concave utility function (i.e., any reasonable investor) dislikes left skew: people disprefer bad outcomes more strongly than they prefer good outcomes. That means investors should take on less risk than log-normal models suggest.

Unpredictability of future return

The Samuelson share formula assumes we know the exact values of forward-looking expected return and volatility. But obviously we don’t. Getting too much leverage generally hurts more than not getting enough, so the more uncertain we are about these parameter values, the less leverage we should want to use (to avoid risking accidentally taking too much risk).

We could account for this by treating mean return and standard deviation as distributions rather than point estimates, and calculating utility-maximizing leverage across the distribution instead of at a single point. This raises a further concern that we don’t even know what distribution the mean and standard deviation have, but at least this gets us closer to an accurate model.

For more, see Chopra, V. K. and W. T. Ziemba (1993). "The effect of errors in mean, variance and co-variance estimates on optimal portfolio choice."

Cost of leverage

In theory, borrowing money for leverage costs only the risk-free rate. In practice, leverage costs more than that under most circumstances.

Lifecycle Investing recommends buying deep-in-the-money call options. Such options on highly liquid securities tend to cost about the risk-free rate, but options on less-traded securities will carry much higher implicit interest rates.

Investing with margin allows for more flexibility. Interactive Brokers charges the risk free rate plus between 0.3% and 1.5%, depending on the amount of margin used, with higher margin costing lower rates. Investors can use margin to buy any investable asset. Large institutions can potentially negotiate cheaper rates.

Brian Tomasik gives a more thorough survey of types of leverage, along with their advantages and disadvantages.

Higher costs make leverage look somewhat less attractive. We can roughly approximate the impact of a 1% cost over the risk-free rate by subtracting 1% from the expected return of an investment.[19]

Taxes

Investors who hold their money in taxable accounts should pay special attention to minimizing taxes. A portfolio that makes frequent trades will incur substantial performance drag due to taxes. (This applies to any investment, not just investment with leverage.)

Taxes reduce expected return, but they also reduce volatility by the same amount. If investors can borrow money for free, they can increase leverage in proportion to the tax rate, which will increase the expected return and standard deviation of their assets by exactly enough to cancel out the tax burden. Unfortunately, investors cannot get free leverage, so taxes will hurt their risk-adjusted return.

Ideally, altruists should invest in tax-sheltered accounts. Foundations can invest however they want, but small donors have more limited options. Donor-advised funds (DAFs) typically only allow a small set of investments. But some funds offer more flexibility in some cases: for example, Fidelity Charitable allows donors with at least $5 million to manage their own investments. It also permits donors with $250,000 to nominate an investment advisor to manage their money. DAFs typically charge 0.6% per year, which substantially hurts your return if you keep money in them for a long time, but this might be preferable to paying taxes every year.

Tax-sensitive investors should prefer ETFs over mutual funds because they do not distribute taxable gains as often. In the long run, an ETF in a taxable account may incur lower costs than a DAF.

This subject deserves much more discussion, and much has been written elsewhere on the subject. Altruists should consider other ways to minimize taxes or, if possible, to invest in tax-sheltered accounts.

Additional caveats

Edward Thorp, The Kelly Criterion in Blackjack Sports Betting, and the Stock Market (p. 32), lists some additional false assumptions of this model:

Stock prices do not change continuously; portfolios can’t be adjusted continuously; transactions are not costless; the borrowing rate is greater than the T-bill rate; the after tax return, if different, needs to be used[.]

How should this change philanthropists' behavior?

Reasonable leverage ratios (under the theoretical model)

This section ignores all the caveats presented above.

So far, we have arrived at the following conclusions about altruists' risk preferences:

  • Uncorrelated small donors experience nearly linear marginal utility of money, regardless of their preferred cause.
  • Interventions that straightforwardly benefit their recipients, including typical global poverty and farm animal welfare interventions, probably have nearly linear marginal utility; but marginal utility might diminish more rapidly if the best interventions dry up quickly.
  • Research-based cause areas, including existential risk, probably experience roughly logarithmic marginal utility.

Philanthropists with near-zero risk aversion theoretically maximize the utility of their investments by taking on as much leverage as they feasibly can.

For philanthropists with logarithmic utility—likely including large donors and correlated small donors—the optimal Samuelson share depends on investment return expectations. This table gives Samuelson shares for various investment portfolios, given the return expectations laid out previously. The fourth column gives desired leverage according to the Samuelson share formula, and the fifth column gives expected return after applying leverage. This assumes the real risk-free rate equals 0% (which is approximately true as of this writing).[20]

Be aware that these estimates depend on assumptions about return expectations that may be false. Furthermore, the estimated optimal leverage only holds under the theoretical model described previously. Although this model is commonly used to approximate investment behavior, it does not accurately reflect real-world trading, for reasons listed in Caveats as well as other reasons.

Investment
diversified global index, low-vol 1.6% 4% 10.2 16%
diversified global index, high-vol 4.5% 12% 3.4 15%
value/momentum/trend (VMOT) 9% 13% 6.1 55%
managed futures (MF) 4% 11% 3.5 14%
VMOT + MF 7% 10% 7.8 54%

These estimates assume logarithmic utility. If altruists have higher or lower , they should prefer lower or higher amounts of leverage (respectively).

Deviations from the theoretical model

On the other hand, a number of caveats reduce how much leverage altruists may want to use. These include market behaviors such as mean reversion, left skew of investment returns, and the unpredictability of future return; as well as practical considerations such as the cost of leverage and taxes.

After accounting for these caveats, large philanthropists or correlated small donors should probably take on more leverage than most individual investors, but substantially less than the numbers given in the previous section. Some have proposed using "half Kelly" instead of the Kelly criterion,[21] where for our purposes, the Kelly criterion corresponds to and half Kelly means . This might roughly account for the various factors that make leverage look less appealing. Or we could look at how historically successful investors have calibrated their risk. For example, Warren Buffett appears to use something similar to the full Kelly criterion, as do many other successful investors.[22]

Doubling results in halving according to the Samuelson share formula. Using the same return estimates as before, this gives for the diversified global index (high-vol) and for VMOT + MF.

Pushing in the other direction, recall that we made two arguments for increasing leverage even further:

  1. Most altruists probably do not take on enough risk, so investment-minded philanthropists should increase leverage to compensate.
  2. According to the principle of time diversification, philanthropists should increase leverage now if they expect their preferred cause area(s) to have greater access to funding in the future.

The first factor weighs overwhelmingly in favor of using leverage for small donors, although not necessarily for large donors (because large donors' choices more heavily affect the overall altruistic investment pool). The significance of the second factor depends on one's expectations about future movement growth.

We can never definitively determine the correct amount of leverage to take, and any attempt to model the expected utility of an investment will have many shortcomings. But investors still need to pick a number, even if that number is 1:1 (i.e., no leverage). I do not claim that the leverage ratios offered in this section are optimal—they're just reasonable guesses based on what I laid out in the previous sections of this essay. Taking too much leverage is worse than not taking enough, so I personally would probably not use this much leverage in practice.

Good Ventures / Open Philanthropy Project

According to many effective altruists' value systems, most value-aligned money resides with Good Ventures, the foundation that funds the Open Philanthropy Project. Donors should care about how Good Ventures invests its money and about how to adapt their own investments to diversify against Good Ventures. Unfortunately, I do not know how Good Ventures invests, so I have nothing to say about this other than that it matters a lot.

If Good Ventures invests a large portion of its assets in Facebook and does not hedge this investment (which it may or may not do, I don't know), other philanthropists should pay particular attention to diversifying against Facebook.

Implementation details

I am not an investment professional and do not have sufficient expertise to make a recommendation about how to invest. For informational purposes, I will propose what I believe to be a reasonable and achievable investment plan based on the reasoning laid out in this essay, but with the caveat that a thoughtful investor could likely find a better implementation. This should be considered a best guess, not an endorsement.

First, invest with Interactive Brokers because it offers the cheapest margin rates (at least in the United States[23]). Create an altruistic investment account that's separate from your personal account, because personal accounts should take much less risk.

Second, invest all your altruistic funds into a managed futures fund. As discussed above, philanthropists should care greatly about reducing correlation with other investors; and managed futures look like a particularly promising way of doing that.

I spoke to an investment advisor with knowledge of managed futures, and he suggested AQR Managed Futures Strategy HV Fund (QMHIX) as a good choice. This fund targets high (15%) volatility, which has the dual benefit that (1) investors with high risk tolerance can get higher return with less leverage and (2) the fund produces greater expected return relative to fees. QMHIX is not available to all investors; as an alternative, AXS Chesapeake Strategy Fund (EQCHX)[11:1] has similar methodology, as well as relatively low fees for a managed futures fund.

Third, use as much margin as Interactive Brokers will allow without substantially risking a margin call. Investors using Reg T margin cannot get anywhere close to as much leverage as is theoretically optimal according to the analysis above, so they should get as much as they can. (At least small donors should, to compensate for other donors' lack of leverage; large philanthropists may want to take less than 2:1 leverage (but perhaps should take more than 2:1; I am uncertain about this).)

Alternative investment strategies

Another similar investment idea: Instead of buying a managed futures fund, buy value and momentum funds while shorting the broad market to produce net zero stock exposure, and then apply lots of leverage. This probably requires portfolio margin rather than Reg T margin, which has certain qualification requirements, so not as many investors will be able to implement this strategy. Some examples of high-conviction value ETFs: IVAL, QVAL, GVAL, SYLD, FYLD, EYLD. And some momentum ETFs: IMOM, QMOM, GMOM.

As a third option, philanthropists could invest in more liquid assets (which would have worse risk-adjusted return) and then use options to get much more leverage. I am inclined to believe that this does not make as much sense. For philanthropists with logarithmic risk aversion, this strategy may result in lower expected utility. Even for those with near-linear marginal utility, using high leverage (say, 10:1 or higher) may impose sufficiently high costs that the resulting investment portfolio will have negative expected return.

Investor psychology

Philanthropists with theoretically high risk tolerance should consider their psychological reaction to pursuing risky and uncorrelated strategies. How will you react if:

  1. you invest your philanthropic money in a risky strategy and lose 90% or more of your money?
  2. you invest in an uncorrelated strategy, and slowly lose money over the course of 5-10 years while most people you know are making money?

Whether a strategy is optimal in theory doesn't matter if investors can't follow through with it in practice. I personally do not invest in the manner I described in the previous section; I use something like a combination of that strategy and a more traditional investment portfolio.

Large investors

Sufficiently large investors can non-trivially shift the altruistic money pool by themselves. Rather than investing exclusively in assets with low correlation to other altruists, they should build a well-diversified portfolio with a tilt toward under-weighted asset classes.

Large institutions or ultra high-net-worth individuals most likely can implement a portfolio more effectively than individual investors. They might be able to:

  1. access some types of investments that individual investors cannot (such as long/short factor funds);
  2. hire investment firms to create customized products;
  3. negotiate better margin rates;
  4. use higher leverage ratios.

Wealthy philanthropists or institutions with relatively long time horizons should consider how best to use these advantages.

I would suggest that investors who want additional guidance speak to AlphaArchitect. It is an investment management firm that produces high-quality research and investment products (hence why I have cited it repeatedly), and offers custom solutions for large investors. Perhaps more importantly, I believe the owners of the firm genuinely want to help people invest well—an all-too-rare trait among investment managers. The people at AlphaArchitect know far more than I do about investing, and likely have better ideas about how to invest in unusual situations.

Conclusion

Confidences

I will conclude by restating the main claims of this essay, with corresponding confidence levels.

On risk and leverage

Highly likely: More altruists should use leverage.

Highly likely: Altruists should consider their own psychology when deciding how to invest.

Likely: Most altruists should have higher risk tolerance than typical self-interested investors.

Likely: The best way to get leverage for most investors is with an Interactive Brokers margin account.

Possible: Many altruists should use as much leverage as they can reasonably manage.

Possible: For most altruists, .

On asset allocation

Highly likely: More altruists should tilt their investments toward value and momentum.

Highly likely: Altruists should pay particular attention to reducing correlation with other altruists' investments.

Highly likely: There exists a better investment strategy than the one I proposed in Implementation details.

Likely: Altruists should overwhelmingly favor assets with low correlation.

Likely: Altruists should specifically invest in managed futures as a way of reducing correlation.

Possible: Altruists should invest their entire (altruistic) portfolios into managed futures.

Possible: Altruists should specifically invest in any of the funds that I named.

Questions for future consideration

  • Can we build better models for the utility functions of various causes?
  • What if we use a utility function with non-constant RRA?
  • How do effective altruists as a whole currently allocate their investments across asset classes? Which asset classes do altruists under-weight most severely?
  • How exactly do deviations from the asset pricing model (including left skew and short-term mean reversion) affect desired leverage?
  • How should one invest if their investment correlation to other altruists lies between 0 and 1?
  • How should future donations be treated with respect to time diversification? How does the answer vary by cause area?
  • Should historical donations factor into the utility function? It seems to me that we should count historical good done as part of total utility, but the literature I have read on utility of consumption generally does not do this. Why not?

Acknowledgements

Thanks to Brian Tomasik, Jake McKinnon, Kit Harris, Linda Neavel Dickens, and Michael St. Jules for providing me with valuable feedback. Reviewers do not necessarily endorse any of the claims made in this essay.

Changelog

2020-05-17:

  • Update managed futures return expectations to incorporate actual historical performance data from managed futures fund EQCHX.
  • Add a backtest going back to 1952 of a strategy similar to VMOT.

2020-04-29:

  • Add additional disclaimers.

2020-04-18:

  • Provide more details and references on managed futures.
  • Add section on long/short factor strategies.
  • Miscellaneous small improvements.

2020-01-08:

  • Add more references to papers on value and momentum that provide further evidence that they work.

Notes

  • gives the amount of starting capital.

    We wish to maximize expected utility with respect to :

    is normally defined as . Utility functions are equivalent up to affine transformations, so we can simplify this to (or in the case that = 1). For the same reason, we can omit the term. Furthermore, this means the maximum of does not depend on past return, only on the expected distribution of future return.

    First, consider the case with only two time steps. Call the leverage-adjusted return in each time step and .

    Thus we have:

    Using the rule determined in the case, as well as the fact that when and are independent, we can modify the expected value formula as follows:

    This product is maximized with respect to by maximizing each term of the product.

    In the case, . By linearity of expected value, this equals . This sum is maximized with respect to by maximizing each integral.

    Thus, for any value of , we maximize long-run expected utility by independently maximizing expected utility at each time step.

    Thanks to Michael St. Jules for providing feedback on how to substantially simplify this proof.


  1. For a short summary of empirical research on people's risk preferences, see Estimating the Coefficient of Relative Risk Aversion for Consumption. ↩︎ ↩︎

  2. Domian, Racine, and Wilson (2003). Leveraged Stock Portfolios over Long Holding Periods: A Continuous Time Model. ↩︎

  3. Merton (1969). Lifetime Portfolio Selection Under Uncertainty: The Continuous-Time Case. ↩︎

  4. Aside: I attempted to write a Python program to determine the marginal utility of cash transfers and at what point risk aversion starts to meaningfully increase. But the program didn't work very well because, given the way I wrote it, NumPy had to struggle to compute triple-nested integrals far out on the tails of fat-tailed probability distributions. But I only spent a couple of hours on it, so I think such a program should be writable given a more careful approach. ↩︎

  5. I did not look deeply into this, but GiveDirectly's staff has not expanded as rapidly as its increase in donations over the past few years, so this statement appears to be true. ↩︎

  6. GiveWell gave substantially lower numbers in 2018, ranging from 4.2 to 12.2. I have not investigated the reasons for the difference. ↩︎

  7. Derivation: Marginal utility of the dollar is times greater than the marginal utility of the dollar. The standard isoelastic utility function is defined as

    and its derivative is . The ratio of marginal utilities between and should equal :

    Solving this equation for gives the desired result. ↩︎

  8. I estimated this based on a range of typical net worths and relative risk aversions. ↩︎

  9. This assumes that individuals can treat their future earnings as risk-free. This might not be the case, depending how much volatility one expects in their future career. Lifecycle Investing discusses this more, as well as Milevsky (2012), Are You a Stock or a Bond? ↩︎

  10. Philanthropists are over-represented in the US, and people in every country over-represent their own country, so it is almost certainly the case that philanthropists over-represent the S&P 500, although obviously they don't all put all their money in it.

    I did a small informal Facebook poll that supports this claim. ↩︎

  11. Disclaimer: At the time of this writing, I have money invested in this fund. ↩︎ ↩︎

  12. Methodology:

    1. Take the top decile by momentum and the top decile by E/P.
    2. Create a portfolio weighted 50/50 between these two, rebalanced monthly.
    3. Use a combination of the 12-month simple moving average and 12-month time series momentum to risk manage the portfolio, as described by AlphaArchitect.
    ↩︎
  13. For comparison, the strategy I tested returned 14.4% with standard deviation 16.0% from 1992 to 2017, hypothetically underperforming VMOT by 5 percentage points on a risk-adjusted basis. VMOT makes a number of methodological improvements over the basic strategy I tested, the biggest differences being (1) diversifying internationally, (2) using a value metric that better captures company valuation, and (3) using a more robust risk management methodology. ↩︎

  14. Does it make sense to treat market factors as additive like this? Yes. The academic literature on finance generally treats factors as additive: see Fama and French (1992), The Cross-Section of Expected Stock Returns. ↩︎

  15. Any deviations from a well-established investing strategy should raise concerns about data mining. The two books explain why they believe their improvements are not data-mined. They also discuss and reject some alternative potential improvements because they suspect the strategies are data-mined. ↩︎

  16. Based on my coarse estimate that VMOT has two percentage points higher expected return than the average of RAFI's eight US+developed large+small value+momentum factors plus market beta, and subtracting VMOT's fee, we get a 10-11% expected real return. ↩︎

  17. Proof:

    • Characterize investing as a discrete series of time steps from 0 to , after which the investor stops investing.
    • Each time step has an investment return random variable following a normal distribution parameterized by and .
    • is the isoelastic utility function, parameterized by some constant .
    • gives Samuelson share at time (>1 indicates leverage).
    ↩︎
  18. De Bondt and Thaler (1985). Does the Stock Market Overreact? ↩︎

  19. This underestimates the cost of leverage because on a left-skewed distribution, subtracting a constant across multiple time periods reduces the mean by more than that constant. And it overestimates the cost of leverage because fees reduce the volatility of an investment. Whether it under- or over-estimates on net depends on the specific properties of the investment. ↩︎

  20. Correction 2020-01-20: Originally, I calculated as , but technically this is not correct.

    Let and be the mean and standard deviation of the asset, and let and be the parameters used in the Samuelson share formula.

    The parameter in the Samuelson share formula should be the log of the mean, and the parameter should be the standard deviation of the log of the return (where the log of the return is normally distributed). That is:

    and appproximately equal and , so simply using and is not a bad approximation, but it's not quite accurate.

    Thanks to Gordon Irlam for providing this correction. ↩︎

  21. MacLean, Thorp, and Ziemba (2010). Good and bad properties of the Kelly criterion. ↩︎

  22. MacLean, Thorp, and Ziemba (2010). The Kelly Capital Growth Investment Criterion: Theory and Practice. Part VI: Evidence of the Use of Kelly Type Strategies by the Great Investors and Others. ↩︎

  23. Interactive Brokers operates in other countries, but I do not know if other countries have better brokerage firms. ↩︎

Comments64
Sorted by Click to highlight new comments since: Today at 11:38 PM

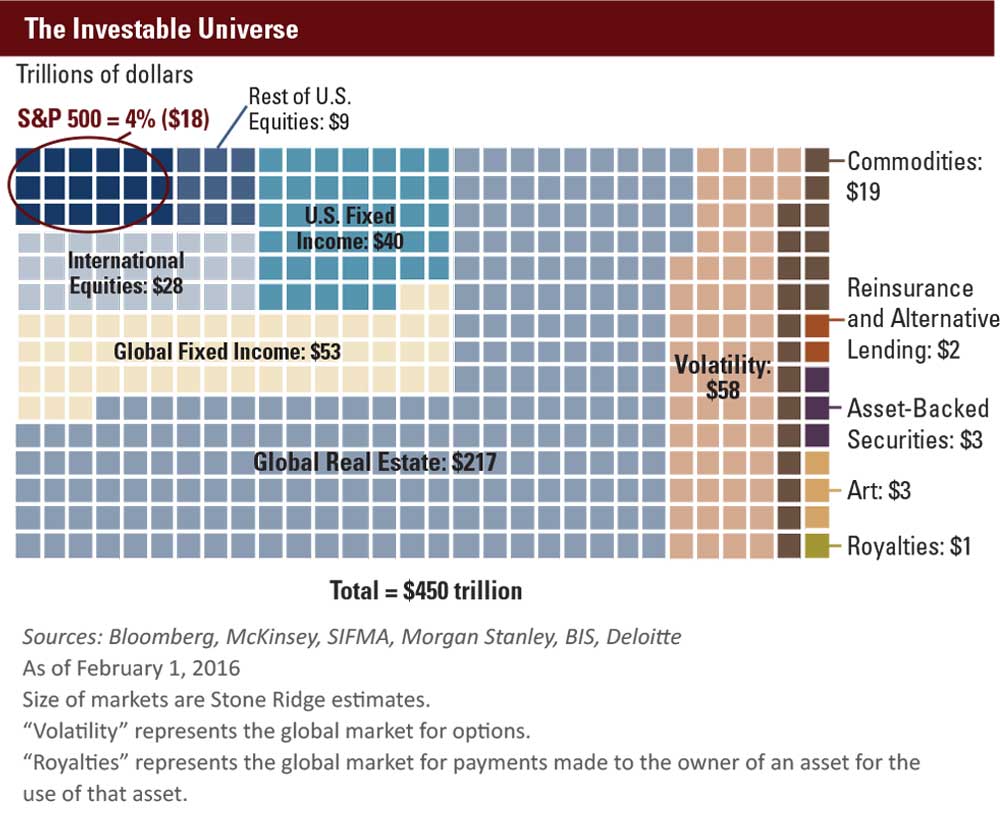
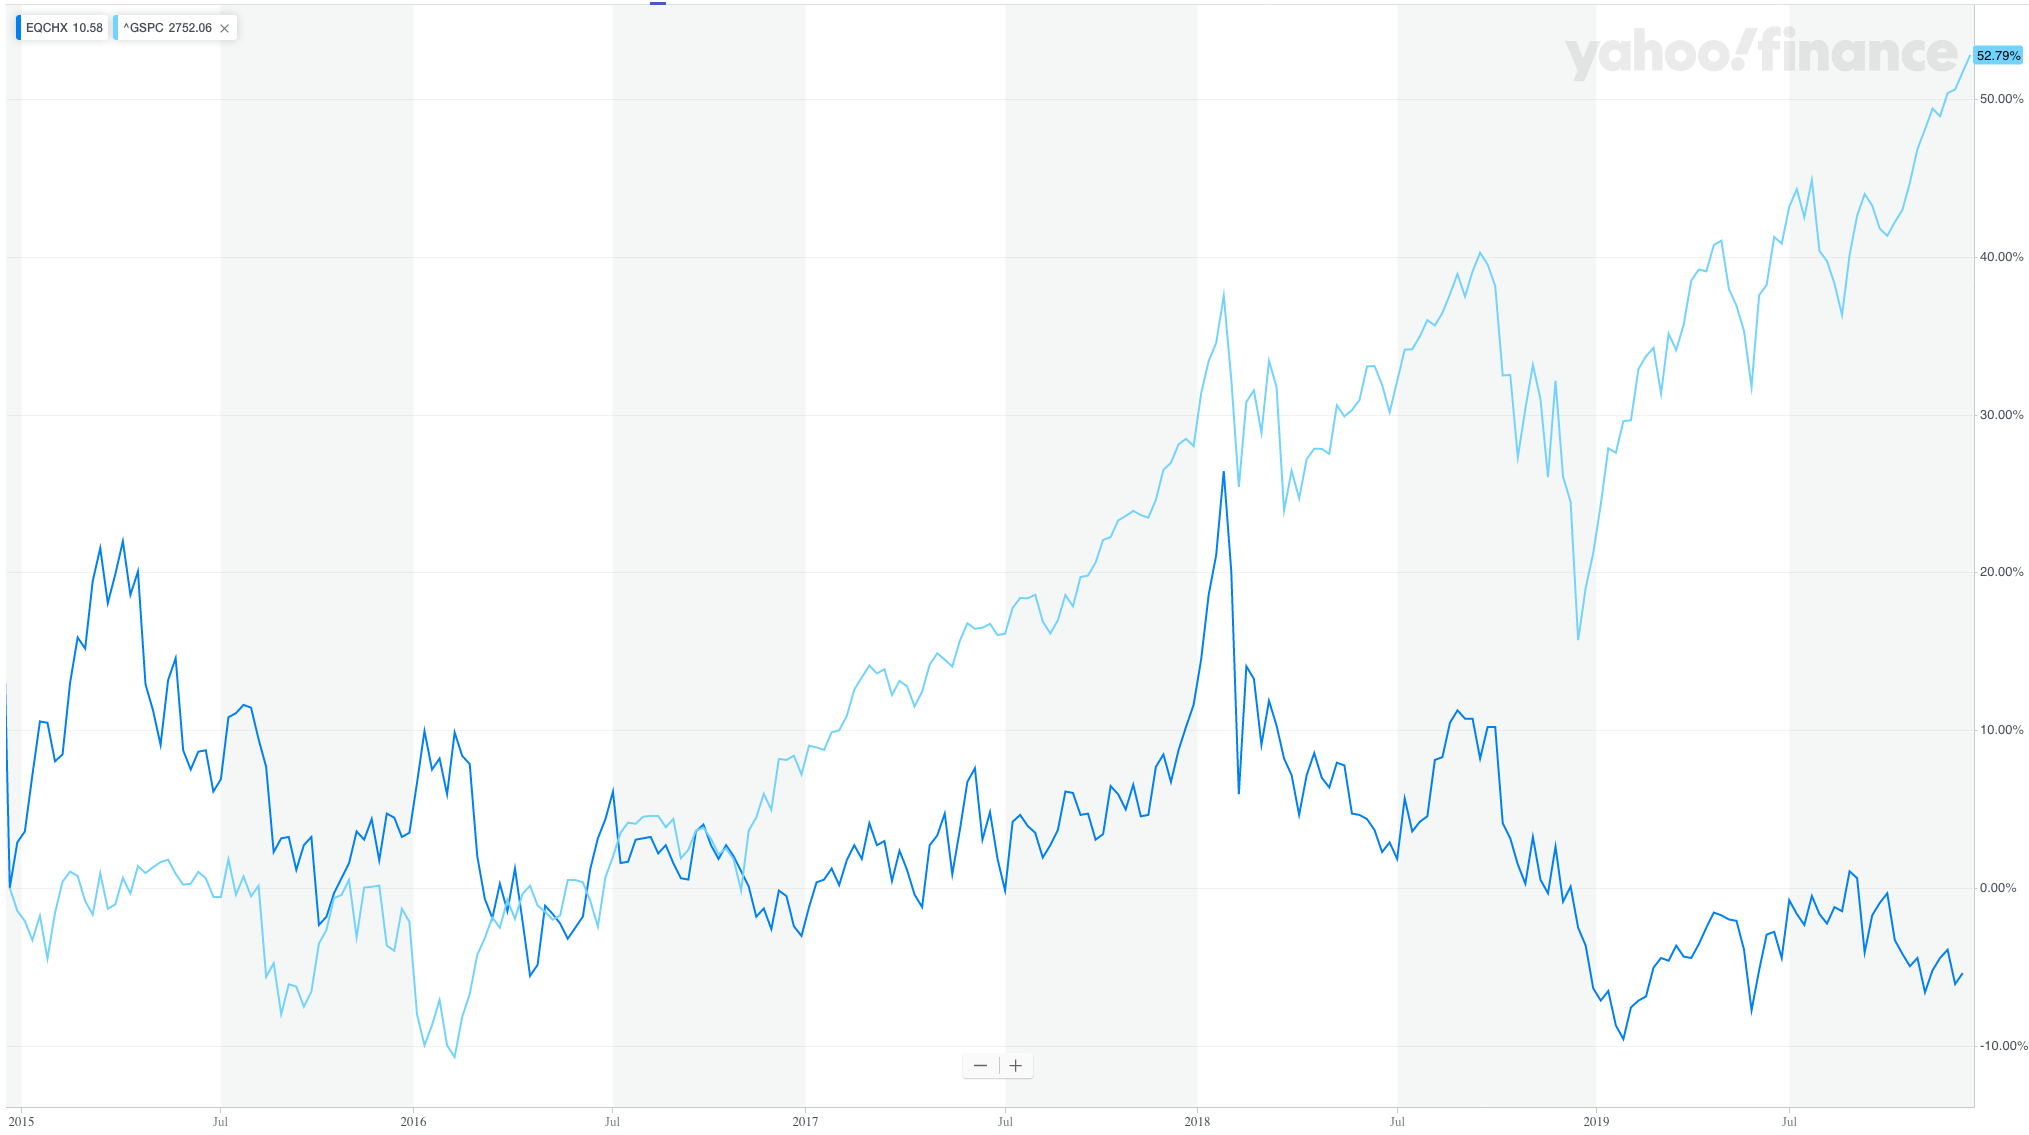
I appreciate many important points in this essay about the additional considerations for altruistic investing, including taking more risk for return than normal because of lower philanthropic risk aversion, attending to correlations with other donors (current and future), and the variations in diminishing returns curve for different causes and interventions popular in effective altruism. I think there are very large gains that could be attained by effective altruists better making use of these considerations.

But at the same time I am quite disconcerted by the strong forward-looking EMH violating claims about massively outsized returns to the specific investment strategies, despite the limited disclaimers (and the factor literature). Concern for relative performance only goes so far as an explanation for predicting such strong inefficiencies going forward: the analysis would seem to predict that, e.g. very wealthy individuals investing on their own accounts will pile into such strategies if their advantage is discernible. I would be much less willing to share the article because of the inclusion of those elements.

I would also add some of the special anti-risk considerations for altruists and financial writing directed at them, e.g.

  • Investment blowups that cause personal financial difficulties attributed to effective altruism having fallout on others
  • Investment writings taken as advice damaging especially valuable assets that would otherwise be used for altruism (just the flip side of the value of improvements)
  • Relative underperformance (especially blame-drawing) of the broad EA portfolio contributing to weaker reputation for effective altruism, interacting negatively with the very valuable asset (much of the EA portfolio) of entry of new altruists

On net, it still looks like EA should be taking much more risk than is commonly recommended for individual retirement investments, and I'd like to see active development of this sort of thinking, but want to emphasize the importance of caution and rigor in doing so.


I'm not surprised that this is a sticking point. I think people should be highly skeptical of claims about EMH violations, and I didn't present a lot of evidence, because that would have dramatically increased the length of this essay. I would refer to the sources I linked in the relevant section.

If you assume EMH is broadly true, almost all of the rest of the essay still applies. When I presented some rough estimates for target leverage under full Kelly and half Kelly, I gave estimates for the global market portfolio, as well as for value/momentum/managed futures. The main exception is if EMH is fully true, you might not want to invest in zero-correlation assets because there aren't really any with positive expected real return (AFAIK), but you'd still want to seek out low correlation to the extent that it's possible.

Regarding the claims I made about potential future performance:

  1. The claims on value and momentum are consistent with academic factor literature and estimates from evidence-focused investing firms like Research Affiliates.
  2. I didn't make any strong claims about managed futures performance, but the made-up numbers I gave are far lower than the theoretical backtest performance from the AQR paper I cited, as well as actual performance from practitioners such as Richard Dennis.

Investment writings taken as advice damaging especially valuable assets that would otherwise be used for altruism (just the flip side of the value of improvements)

I don't understand what this means, could you explain?

EDIT: I did a little more looking and found these two papers that might be persuasive to value and momentum skeptics:

https://www.aqr.com/Insights/Research/Journal-Article/Fact-Fiction-and-Momentum-Investing https://www.aqr.com/Insights/Research/Journal-Article/Fact-Fiction-and-Value-Investing

The papers themselves are fairly short, but they summarize a lot of evidence from other sources.

I agree that the EMH-consistent version of this still suggests the collective EA portfolio should be more leveraged, and more managing correlations across donors now and over time, and that there is a large factor literature in support of these factors (although in general academic finance suffers from datamining/backtesting and EMH dissipation of real factors that become known).

Re the text you quoted, I just mean that if EAs damage their portfolios (e.g. by taking large amounts of leverage and not properly monitoring it so that leverage ratios explode, taking out the portfolio) that's fewer EA dollars donated (aside from the reputational effects), and I would want to do more to ensure readers don't go half-cocked and blow up their portfolios without really knowing what they are doing.


Leveraged ETFs are one way to keep your leverage ratio from blowing up, without any investor effort.

Keeping all the considerations in this post in mind seems very difficult, so perhaps the ideal solution would be if there were an institution to do it for individuals, such as EA Funds or something like it. You could donate to the fund and let them adjust leverage, correlation with other donors to the same cause, and everything else on your behalf.

I like this idea—a centrally-managed fund would be a lot easier than a bunch of people separately doing their own thing. But it creates a problem where the investors/donors in the fund might have unrealistic expectations about performance and could become really unhappy if the fund underperforms the S&P for several consecutive years—which is bound to happen sometimes if the fund is aiming for low correlation. This would be particularly bad from an optics perspective. So there are pros and cons to this idea.

Good point. I think such a fund would want to be very clear that it's not for the faint of heart and that it's done in the spirit of trying new risky things. If that message was front and center, I expect the backlash would be less.

I agree that carefully-vetted institutional solutions are probably where one would like to end up.

See Colby Davis on the problems with leveraged ETFs.

Thanks! From my reading of the post, that critique is not really specific to leveraged ETFs? Volatility drag is inherent to leverage in general (and even to non-leveraged investing to a smaller degree).

He says: "In my next post, I’m going to dive into more detail on what is to distinguish between good and bad uses of leverage." So I found his next post on leverage, which coincidentally is one mentioned in the OP: "The Line Between Aggressive and Crazy". There he clarifies why he doesn't like leveraged ETFs:

From this we start to see the problem with levered ETFs as they are currently constructed: they generally use too much leverage applied to too volatile of assets. Even with the plain vanilla S&P 500 3x leverage is too much. And after accounting for the hefty transactions costs and management fees these ETFs charge, even 2x might be suboptimal (especially if you believe returns will be lower in the future than they have in recent decades). And the S&P 500 is one of the most conservative targets for these products. Take a look at the websites of levered ETF providers and you will see ways to make levered bets on particular industries like biotech or the energy sector, or on commodities like oil and gold, or for more esoteric instruments yet, almost all of which are more volatile than a broadly diversified index like the S&P 500, and thus supporting much lower Kelly leverage ratios, probably less than 2x.

So unless transaction costs are a dealbreaker, it seems like he's mainly opposed to the fact that most leveraged ETFs use too much leverage for their level of volatility (relative to the Kelly Criterion, which assumes logarithmic utility of wealth), not that the instrument itself is flawed? Of course, leveraged ETFs implement a "constant leverage" strategy, and later in that post, Davis proposes adjusting the leverage ratio dynamically (which I agree is better, though it requires more work).

Hmm. Maybe you're right. I guess I was thinking there was an important difference between "constant leverage" and infrequent rebalancing. But I guess that's a more complicated subject.

That seems to be a common view, but I haven't yet been able to find any reason why that would be the case, except insofar as rebalancing frequency affects how leveraged you are. I discussed the topic a bit here. Maybe someone who knows more about the issue can correct me.

Can you clarify what exactly your concern is? Which of these best describes your position?

  1. Factor premia basically don't exist.
  2. Factor premia are much smaller than this essay claims.
  3. Factor premia are substantial, but this essay does not do enough to justify that claim, so it's not a good reference.

Initially I thought you were saying #1, but from your reply below, it sounds like you at least believe that factor premia exist, so now I'm not sure.

Edit: Or I guess a fourth option: factor premia exist, but generally should not be promoted (possibly because most readers will run into the same behavioral biases that cause the premia to exist).

Or something else entirely.

I just updated the essay to include some more justification for (1) the claim that it's possible to beat the market and (2) the specific return estimates given. I added the new material to the sections "Improving on conventional wisdom" and "Return expectations", and have reproduced the latter below.

-------

As something of a corroboration, RAFI provides estimates of forward-looking five-year return for various long/short factors. At the time of this writing, it makes the following predictions for its long/short value and momentum factors (net of transaction costs):

  • 5.7% for US large-cap value
  • 1.1% for US large-cap momentum
  • 8.0% for US small-cap value
  • 6.4% for US small-cap momentum

(RAFI's projections for foreign developed market factors are similar but generally a bit higher.)

A concentrated long-only portfolio on a particular factor would have approximately the same expected return as the long/short factor plus the broad market (although that's not quite how the math works).

The underlying indexes used by VMOT make some improvements on RAFI's simple factor model (see Quantitative Value and Quantitative Momentum for details[^26]), so it might be reasonable to assume a higher expected return for VMOT. If we then subtract fees, we get something close to the original estimate I gave for VMOT (probably a bit higher[^27]).

RAFI believes the value and momentum premia will work as well in the future as they have in the past, and AQR makes the same claim in some of the papers I linked above. They offer good support for this claim, but in the interest of conservatism, we could justifiably subtract a couple of percentage points from expected return to account for premium degradation.

Note that RAFI's estimates use factor timing—attempting to guess how well factors will perform based on the current market environment, rather than just looking at historical behavior. This practice is not widely accepted; for example, see AQR's Factor Timing is Deceptively Difficult.

Also note that these numbers only give expected mean return. Even if these estimates are accurate, we could still see much higher or lower returns due to market volatility.

(Dashing this off quickly, so some of this may be inelegantly stated.)

I appreciate this response, and I think that elements of it apply to many other risks an EA could take, including business ventures and work on charitable causes that may be high-return but carry a significant risk of major public backlash or other bad consequences. 

Even if we have a collective reason to seek very good results even at the cost of taking on risk (slowly diminishing marginal utility, as noted in the post), and even if the community can internally tolerate a few individual disasters (because we have collective resources to fall back on), we get a lot of value from having a reputation for wisdom, caution, and common sense (especially given the natural weirdness of so many core EA ideas). 

This doesn't mean we should necessarily avoid any particular risk, but it seems important for would-be risk-takers to consider, even if they are personally open to bearing a lot of risk for the sake of EA goals.

I like the basic point about leverage and think it's quite robust.

But I think the projected returns for VMOT+MF are insane. And as a result the 8x leverage recommendation is insane, someone who does that is definitely just going to go broke. (This is similar to Carl's complaint.)

My biggest problem with this estimate is that it kind of sounds crazy and I don't know very good evidence in favor. But it seems like these claimed returns are so high that you can also basically falsify them by looking at the data between when VMOT was founded and when you wrote this post.

VMOT is down 20% in the last 3 years. This estimate would expect returns of 27% +- 20% over that period, so you're like 2.4 standard deviations down.

When you wrote this post, before the crisis, VMOT was only like 1.4 standard deviations below your expectations. so maybe we should be more charitable?

But that's just because it was a period of surprisingly high market returns. VMOT lagged VT by more than 35% between its inception and when you wrote this post, whereas this methodology expects it to outperform by more than 12% over that period. VMOT/VT are positively correlated, and based on your numbers it looks like the stdev of excess performance should be <10%. So that's like 4-5 standard deviations of surprising bad performance already.

Is something wrong with this analysis?

If that's right, I definitely object to the methodology "take an absurd backtest that we've already falsified out of sample, then cut a few percentage points off and call it conservative." In this case it looks like even the "conservative" estimate is basically falsified.

This is a totally reasonable objection, and I will try my best to respond. Sorry if this reply is a little disjointed/hard to follow.

And as a result the 8x leverage recommendation is insane

To be clear, 8x leverage is not a recommendation; it is the result of a particular analysis with many limitations—I tried to cover the important ones in Caveats. In light of these caveats, 8x leverage does not seem reasonable.

That said, I disagree that the projected returns are insane. I agree that they look insane, and when I was writing this, I had some tension between trying to sound sane and representing my true beliefs, and I decided that the latter was more important.

I don't overly trust backtests, but I trust the process behind VMOT, which is (part of the) reason to believe the cited backtest is reflective of the strategy's long-term performance.[2] VMOT projected returns were based on a 20-year backtest, but you can find similar numbers by looking at much longer data series (e.g., Value and Momentum Everywhere). VMOT backtest gives higher expected returns than generic value/momentum backtests[1], and I believe this is not due to data-mining, but I don't think there's really an efficient way for me to justify this belief other than to say read the books (Quantitative Momentum and Quantitative Value), which explain why the authors believe their particular implementations of momentum and value have (slightly) better expected return. If you assume VMOT will have returns commensurate with a generic value/momentum strategy, you might get a lower expected return than 9%, but note that Research Affiliates' estimates for generic value/momentum are still on par with my assumption for VMOT's return (I think RAFI is about 1-2% too optimistic, and VMOT's improved methodology adds about an extra 1-2% expected return).

I admit that I kind of made up the returns for managed futures, but it is worth noting that the paper I cited (with a 100-year backtest, not 20-year) found a historical performance for managed futures far higher than my made-up forward-looking return estimate.

Explaining why we should expect these strategies to outperform the market is much harder, and I can't really present a convincing argument in this comment, but the OP linked to a lot of sources that provide their own arguments.

This is not directly relevant to the investment strategies I talked about above, but if you use the really simple (and well-supported) expected return model of earnings growth plus dividends plus P/E mean reversion and plug in the current numbers for emerging markets, you get 9-11% real return (Research Affiliates gives 9%, I've seen other sources give 11%). This is not a highly concentrated investment of 50 stocks—it's an entire asset class. So I don't think expecting a 9% return is insane.

VMOT is down 20% in the last 3 years. This estimate would expect returns of 27% +- 20% over that period, so you're like 2.4 standard deviations down.

This is only 2.4 standard deviations assuming returns follow a normal distribution, which they don't. By the same argument, you could look at the S&P's recent 30% decline over a one-month period (the historical monthly standard deviation is about 5%) and conclude that our 95% confidence interval for the S&P's monthly return is [-40%, -20%].

I am not disputing that VMOT has performed particularly badly in the recent past, and that this sucks if you're investing in it (which I am)—value and trendfollowing have both performed poorly over the past three years, which explains VMOT's underperformance. Value, momentum, and trendfollowing have each had many historical periods of long underperformance (often much longer than three years), which is probably part of the reason why they're all still unpopular.

[1] In brief:

  • Quantitative Value uses EBIT/EV instead of more commonly used value metrics like P/E or P/B, and there are theoretical and empirical reasons to expect EBIT/EV to work better
  • Quantitative Value screens companies on quality as well as value, I'm not really convinced this helps but I doubt it hurts. The literature on the quality factor is promising but not as robust as on value or momentum
  • Quantitative Momentum looks for smooth returns as well as strong momentum, and there are theoretical and empirical reasons to expect smooth-return momentum to work better than "sharp" momentum

[2] This actually raises some interesting epistemological questions about when backtests (or limited empirical data in general) should be trusted, it's something I need to think about more.

(Edited to clean up a bit and add footnote)

This is only 2.4 standard deviations assuming returns follow a normal distribution, which they don't.

No, 2.4 standard deviations is 2.4 standard deviations.

It's possible to have distributions for which what's more or less surprising.

For a normal distribution, this happens about one every 200 periods. I totally agree that this isn't a factor of 200 evidence against your view. So maybe saying "falsifies" was too strong.

But no distribution is 2.35 standard deviations below its mean with probability more than 18%. That's literally impossible. And no distribution is 4 standard deviations below its mean with probability >6%. (I'm just adopting your variance estimates here, so I don't think you can really object.)

This is not directly relevant to the investment strategies I talked about above, but if you use the really simple (and well-supported) expected return model of earnings growth plus dividends plus P/E mean reversion and plug in the current numbers for emerging markets, you get 9-11% real return (Research Affiliates gives 9%, I've seen other sources give 11%). This is not a highly concentrated investment of 50 stocks—it's an entire asset class. So I don't think expecting a 9% return is insane.

Have you looked at backtests of this kind of reasoning for emerging markets? Not of total return, I agree that is super noisy, but just the basic return model? I was briefly very optimistic about EM when I started investing, based on arguments like this one, but then when I looked at the data it just seems like it doesn't work out, and there are tons of ways that emerging market companies could be less appealing for investors that could explain a failure of the model. So I ended up just following the market portfolio, and using much more pessimistic returns estimates.

I didn't look into it super deeply. Here's some even more superficial discussion using numbers I pulled while writing this comment.

Over the decade before this crisis, it seems like EM earnings yields were roughly flat around 8%. Dividend yield was <2%. Real dividends were basically flat. Real price return was slightly negative. And I think on top of all of that the volatility was significantly higher than US markets.

Why expect P/E mean reversion to rescue future returns in this case? It seems like EM companies have lots of on-paper earnings, but they neither distribute those to investors (whether as buybacks or dividends) nor use them to grow future earnings. So their current P/E ratios seem justified, and expecting +5%/year returns from P/E mean reversion seems pretty optimistic.

Like I said, I haven't looked into this deeply, so I'm totally open to someone pointing out that actually the naive return model has worked OK in emerging markets after correcting for some important non-obvious stuff (or even just walking through the above analysis more carefully), and so we should just take the last 10 years of underperformance as evidence that now is a particularly good time to get in. But right now that's not my best guess, much less strongly supported enough that I want to take a big anti-EMH position on it (not to mention that betting against beta is one of the factors that seems most plausible to me and seems best documented, and EM is on the other side of that trade).

which explain why the authors believe their particular implementations of momentum and value have (slightly) better expected return.

I'm willing to believe that, though I'm skeptical that they get enough to pay for their +2% fees.

I don't overly trust backtests, but I trust the process behind VMOT, which is (part of the) reason to believe the cited backtest is reflective of the strategy's long-term performance.[2] VMOT projected returns were based on a 20-year backtest, but you can find similar numbers by looking at much longer data series

The markets today are a lot different from the markets 20 years ago. The problem isn't just that the backtests are typically underpowered, it's that markets become more sophisticated, and everyone gets to see that data. You write:

RAFI believes the value and momentum premia will work as well in the future as they have in the past, and some of the papers I linked above make similar claims. They offer good support for this claim, but in the interest of conservatism, we could justifiably subtract a couple of percentage points from expected return to account for premium degradation.

Having a good argument is one thing---I haven't seen one but also haven't looked that hard, and I'm totally willing to believe that one exists and I think it's reasonable to invest on the basis of such arguments. I also believe that premia won't completely dry up because smart investors won't want the extra volatility if the returns aren't there (and lots of people chasing a premium will add premium-specific volatility).

But without a good argument, subtracting a few percentage points from backtested return isn't conservative. That's probably what you should do with a good argument.

Following up on this. Since May 2020 when these comments were written:

  • VT is up 13.5%/year.
  • VWO (emerging markets ETF) is up 3.6%/year.
  • VMOT is up 7%/year.

Comparing to your predictions:

  • You expected VMOT to outperform by about 6%, and suggesting cut that in half to 3% to be conservative, but it underperformed by 6.5%. So that's another 1.5-3 standard deviations of underperformance.
  • You expected VWO to significantly outperform, but it underperformed by about 10%/year.

Your recent comment got me thinking more about this. Basically, I didn't think the last few years of underperformance was good evidence against factor investing, but I wasn't sure how to explain why. After thinking for a while, I think I have a better handle on it. You're (probably) smarter than me and you're better at statistics than I am, so I was kind of bothered at myself for not being able to convince you earlier, and I think your argument was better than mine. I want to try to come up with something more coherent.

Most of this comment is about estimating future expected returns, but one thing I will say first: you are right that my original estimate of standard deviation, where I took the historical standard deviation was too optimistic. Originally I looked at vol over the last ~25 years and assumed it would stay the same. But I just looked at the performance of value and momentum back to 1926 and I noticed the last few decades have had a standard deviation 2–3 percentage points lower than through most of history. Higher standard deviation decreases optimal leverage. You were correct that I was relying too much on a short sample. (The return for a value/momentum/trend strategy back to 1926 is about the same as the return 1991–2017.)

(I believe in my head I was thinking, "historical volatility is a good predictor of future volatility, so I can just take this sample and use that to predict future volatility." Which is somewhat true but not good enough because volatility isn't that stable over time.)

Regarding future returns:

Between "nothing beats the market" on one side and "it's reasonable to expect a median +X% return over the market for this particular fund or similar funds" on the other side, I can see a few intermediate steps:

  1. do value and momentum work at all?
  2. will value and momentum work close to as well as they did historically (to within 50%)?
  3. am I right about how well value and momentum worked historically?
  4. does VMOT in particular do a good job of capturing the value and momentum premia?

This comment focuses on #2, and touches on #4. I'm going to focus on value investing and not momentum because it's much easier to reason about. My argument for momentum investing could be summarized as, "if momentum investing didn't work for reason X, then reason X would also be visible in the value factor, but no such reason shows up in the value factor data." Basically I can't see any reason why the momentum factor would stop working but not the value factor.

So, value has performed poorly recently. What is that evidence of? That depends on why it performed poorly.

There are basically two hypotheses about why value might stop working:

  1. It becomes too popular, and the valuation spread between cheap and expensive stocks gets too narrow.
  2. Value metrics (like P/E) become much stronger predictors of future fundamentals growth.

For now let's define 'value' as buying stocks with low P/E ratios and shorting stocks with high P/Es.

It is useful to break down a stock's price as

and a stock's price return as

Call the multiple expansion and the structural return (and roll the dividend yield into the structural return).[5]

(Note: When the P/E multiples for value and growth converge, that's multiple contraction for the value factor, and is good for value. When they diverge, that's multiple expansion, and is good for growth.)

Then we can divide the stock market into a value stock bucket vs. a growth stock bucket and look at the differential structural return and multiple contraction between the two buckets.

(This is basically the same methodology as Research Affiliates' Reports of Value's Death May Be Greatly Exaggerated.[6][7])

If value became too popular, we should see the value spread narrowing as money floods out of growth and into value (and value probably outperforming while that's happening) and then sitting at a narrow spread for a long time. That's empirically not what happened—the recent underperformance is driven by a widening spread (I will give some numbers below). So I think this hypothesis is almost certainly false.

If value stops working because high-P/E companies start systematically outperforming low P/E companies[4], we should see a negative structural return. I find this hypothesis much more plausible.

If value underperforms because of a negative structural return, that suggests something is going on with value companies that's making them less successful, and it provides evidence that value investing won't work in the future.

I looked at some numbers using the Ken French data library. Value investing has had a poor streak since about 2007, so let's look at the data from before and after 2007. From 1952 to 2006, the value factor (= long low P/E, short high P/E) had a return of 5.7% = <0.5% multiple contraction + 6.2% structural return. It's had lots of multiple expansions and contractions over that period, but they all pretty much canceled out, so most of the long-run return was structural.

From 2007 to 2022, the value factor returned –1.2% = –5.3% multiple contraction + 4.1% structural return. This shows that the poor return was driven by multiple expansion—if the multiple hadn't changed, value would have beaten growth by 4 percentage points. My biggest concern here is that the structural return dropped by over 2 percentage points relative to history, which means value companies' fundamentals did worse 2007–2022, although the value factor still had a positive structural return. Hard to say whether the lower structural return will persist, but it's fluctuated a lot in the past and it was lower in the 1930s than it was in the 2010s, so it could be bad luck[1]. A 4.1% structural return still suggests that, if multiple expansion evens out, value should perform pretty well. There's some possible concern that the structural return will continue to go down, which I'll talk about later.

For the last few years: I can't look at the exact period since I wrote the original article, since the data only gives annual P/E updates. So I calculated value factor returns for 2019–2022 and 2020–2022:

2019–2022: –1.1% return = –12.2% multiple contraction + 11.1% structural return 2020–2022: 10.8% return = –20.1% multiple contraction + 30.8% structural return[2]

(Note: My data set treats years as ending in June, and the value factor performed badly since June 2022, which is part of why these numbers are higher the return for VMOT you quoted (the other big reason being that VMOT combines value investing with other strategies, and the way it implements value isn't the same as the way I'm testing it).)

Even though value underperformed over the last 3 years, IMO the recent few years look pretty optimistic for value investing because value had a strong structural return, and the poor performance is fully explained by historically fast multiple expansion (comparable to the 1998–1999 multiple expansion at the peak of the dot-com boom). I think the only way you could reasonably explain this much multiple expansion is by saying (1) AGI is imminent, (2) AGI is going to revolutionize the economy, but in a specific way that benefits stockholders, and (3) it's specifically going to benefit the stockholders in growth companies but not value companies. (Which is definitely in my hypothesis space, but it's a pretty conjunctive hypothesis so I don't think it's all that likely.[3])

(I repeated this analysis using Price/Cash Flow and Price/Book instead of Price/Earnings and they gave pretty similar results.)

What does all this say about the prospective expected return of the value factor? Hard to say because you could make a lot of different assumptions. Like, will the valuation multiple revert to the historical mean? How long will that take? Will it overshoot the historical mean and contract to the point of being narrower than average (like what happened in 2000–2007)? Maybe it will never fully revert? What will happen to the structural return? Will it look like the historical average? The recent average? Will it go lower? Will it be negative?

For the multiple to revert to the historical average, value would have to return about an extra 70% in total. If it takes 20 years, that's 2.7% return per year due to multiple contraction. If it only goes halfway back to the historical average in 20 years, that's 1.5% per year. (Or eg it could fully revert in only 10 years, which would be a 5% annual return.) Then for the structural return, I'd say a reasonable median estimate is somewhere around 3–6%, somewhere between the historical average and a bit below the more recent average. If we say 2% multiple contraction + 3% structural return - 2% overhead costs, that's a 3% return for the value factor. There's a wide range of numbers you could justify:

  • zero multiple reversion + 0% structural return - 2% overhead = -2% return
  • full mean reversion in 10 years + historical average 6% structural return - 2% overhead = 9% return

These both sound at least weakly plausible to me. (9% is more like the "full inside view" number...probably much too high, but there's an argument for it.)

VMOT in particular

Since we were talking about VMOT, not the academic value factor, VMOT differs in a few ways:

  • It uses the value, momentum, and trend factors, not just value.
  • Its implementation details do not perfectly match the academic definitions. Most obviously, it's (mostly) long-only instead of long/short, it's global instead of US-only, it holds only the top ~5% of stocks instead of the top 30%, it's equal-weighted instead of size-weighted, and it includes small loadings on other factors like quality, low volatility, and accruals.

The value component of VMOT should still be fairly well correlated with the value factor as I defined it above. For the momentum/trend factors, there's no way to break down the returns like I did for the value factor, so it's much harder to say anything useful. Maybe the most useful thing to look at is whether momentum appears oversubscribed, and it probably doesn't, although it's hard to say with confidence.

VMOT (or a similar fund) won't perform the same as an academic-style value/momentum/trend factor portfolio:

  • VMOT is long-only instead of long-short, which roughly cuts the excess return in half
  • VMOT invests in the top 10% equal-weighted instead of the top 30% size-weighted. Historically, this added 4 to 7 percentage points (see https://mdickens.me/2021/02/08/concentrated_stock_selection/) but also increased volatility (although still with a higher Sharpe ratio) and would increase transaction costs
  • VMOT includes some exposure to other factors, which probably decreases return a bit but increases risk-adjusted return

On net, I'd expect VMOT's implementation of value to perform about as well as the traditional value factor.

I should also mention that, while VMOT is my favorite factor ETF, the difference between VMOT and the 2nd best ETF is probably small. (Not sure what the 2nd best would be, maybe [QRPIX](https://www.etf.com/TRTY][TRTY]]? or [[https://funds.aqr.com/funds/aqr-alternative-risk-premia-fund) looks really nice but it's not an ETF.) Most "factor" ETFs don't actually have much exposure to academic-style factors (I think the biggest US value and momentum ETFs are VTV and MTUM, respectively, which both have pathetic factor loadings), but there are a few good ones out there.

On confirmation bias

Some people (like Dan Rasmussen) say that, even though value has been underperforming, the value spread is widening, so this is actually evidence that value will perform better in the future. I'm not sure I would go that far, but let's go with that claim for a minute. Is it a fair claim? I find it suspicious because, on its face, you are taking a streak of bad performance as evidence that value works. But presumably you'd take good performance as evidence that value works, right? So any outcome is treated as confirming evidence.

I thought about this a bit, and I don't think it's true that I'd always take good performance as evidence that value works. Consider four possible worlds:

  1. value outperforms due to both multiple contraction and positive structural return
  2. value experiences multiple contraction and negative structural return
  3. value experiences multiple expansion and positive structural return
  4. value underperforms due to both multiple expansion and negative structural return

(#2 and #3 could have either positive or negative performance for the value factor, depending on which force wins out.)

I would rank the forward-looking prospects of the value factor for these worlds as #3 > #1 > #4 > #2. So the best world (#3) is one where value may be underperforming due to multiple expansion (as we saw in the last decade and a half, and during the dot-com bubble), and the worst world (#2) is one where value may be outperforming due to multiple contraction (for the record, the biggest times where this happened in the US were a ~15% structural drawdown 1994–1995 and a ~45% (!) structural drawdown 2002–2004, where both times the drawdown was basically canceled out by a multiple contraction. now that I'm looking at it, the big 2002–2004 structural drawdown + contraction probably explains a good chunk of value's 2007+ underperformance).

That said, I don't think that's the whole story. I'm more pessimistic than some people because, by some measures, the value factor has had a worse structural return since 2007 than it did historically. It was still positive, and it's not unusual for the structural return to fluctuate (eg it had a big drawdown starting in 1934 and didn't recover until ~1970), and this depends on how exactly you measure it and what time period you look at, so I'm not too concerned about it, but I wouldn't rule out the possibility that value could have a still-lower structural return in the future. And I'm not super confident in the argument that the valuation spread is historically wide so it must narrow—it might get even wider. (In the 80's, Japan's market got to the highest valuation ever seen in history, and then the valuation doubled again before reaching the peak.) It can't keep getting wider forever, but you don't know how far it will go or how long it will take to revert.

On the strength of out-of-sample evidence

In a simple two-hypothesis universe, what is the odds ratio for "value/momentum/trend works" vs "doesn't work" based on out-of-sample performance?

I made the following assumptions:

  • Returns are normally distributed (for simplicity)
  • Null hypothesis (NH) is that markets are efficient, VMOT has 0.8 market beta (not 1.0 because it's hedged ~20% of the time) and has some idiosyncratic risk because it buys baskets of stocks instead of the whole market
  • Market has 5% return in excess of the risk-free rate and 17% standard deviation (which is about the historical average)
  • Under NH, VMOT has 19% standard deviation (which is around what you'd expect for a basket of 100–200 randomly-chosen stocks) and loses 2% a year to fees + transaction costs
  • Alternative hypothesis (AH) is that VMOT beats the market by +3% annualized in expectation, with a standard deviation of 13%[8] and correlation of 0.5

(I'm talking about VMOT but similar logic should work for any value/momentum/trend strategy, I just happen to like VMOT the best)

To calculate odds ratios, we need to know the mean and standard deviation of VMOT – Market. Using the above numbers, NH gives mean -2%, stdev 7%. AH gives mean +3%, stdev 15%. (Possible that I made a math error)

The lower volatility for NH means that sufficiently bad underperformance is evidence in favor of AH, which seems counterintuitive. This would follow from the fact that, under NH, VMOT has to have beta close to 1, so it's very unlikely to out- or under-perform by a lot. To avoid this counterintuitive result, we could say value and momentum are real risk factors that drive returns independently of market beta, but that they have zero (gross) expected return. So say NH is that relative return has mean -2% and stdev 15%. In that case the odds ratios over 2.5 years are: (calculated as norm.pdf(x, 3, 15 / sqrt(2.5)) / norm.pdf(x, -2, 15 / sqrt(2.5)))

At -5%, odds ratio = 0.73:1 At -10%, odds ratio = 0.56:1 At -15%, odds ratio = 0.42:1

VMOT's 6.5 percentage point underperformance May '20 to Nov '22 (using the assumptions above) is an odds update of 0.68:1. VMOT's ~8% annualized underperformance since inception vs. the MSCI World index is an odds update of 0.39:1.

FWIW I'm not well-versed in this sort of calculation, you probably know more about it than me. I know that this estimate is wrong in various obvious ways (eg it's using a normal distribution, only two hypotheses, it's not allowing for the possibility of being wrong about the volatility) but it's at least some sort of approximation.

For some more historical context, I used data from the Ken French data library to test the performance of a VMOT-like strategy[9] vs. the US market going back to 1926. The 3 biggest relative drawdowns were

69.6% -> 2010-05 to 2020-06
62.2% -> 1983-08 to 1991-01
31.1% -> 1969-02 to 1973-03

The big 69.6% drawdown gives an odds ratio of 0.074:1 which is pretty substantial. (Although this is cherry-picking the peak and doesn't correspond to the out-of-sample period.)

To explain why I still have a high credence that value will work in the future, I would change this two-hypothesis model into a multiple-hypothesis model that includes (at least)

  1. value investing still works
  2. value investing is oversubscribed (clearly false)
  3. the structural return of value investing is negative (clearly false)
  4. the structural return of value investing is going down and will likely be negative in the future (could be true)

(There are other hypotheses too, those are the main ones I can think of.) The poor streak is an update against #1 and in favor of #4. To get a better comparison, I'd specifically look at the odds ratio for the structural return component of the value factor. The odds ratio depends on the null hypothesis. If NH is that structural return = 0%, then the recent structural return is still high enough that it's an update against NH. If NH is that structural return = 4.1% (which is what it was 2007–2022 using the way I defined the value factor) and AH is structural return = 6.2% (the historical average), the odds update is 0.64:1. Although the measured structural return varies a lot depending on how exactly you implement the value factor.

Anyway, I don't have a mathematical justification for this[11] but my general sense is that "big" odds ratios in investment performance don't matter much:

  • For the VMOT-like strategy, the earlier period includes a 62.2% drawdown which is a 0.12:1 odds ratio, and it went on to perform really well after that.
  • And for US stocks, if your NH is 0% return and AH is 10% return, the biggest drawdown in the Great Depression (84% from 1929 to 1932) has an odds ratio of 0.012:1. (Although this is overstating things because I'm assuming a normal distribution.) And a whole generation of people did stop investing in stocks after the Great Depression because they over-updated, and those people turned out to be wrong.
  • Or, to interpret evidence in a different way, both US stocks and bonds declined in 2022, which is only the third time that's happened in the last century (and the 3rd worst year for a 60/40 portfolio), so you could call that a 0.03:1 odds update, but I wouldn't write off a stock/bond portfolio because of that.
  • Or look at Japan in 1989, which had a market-wide P/E of around 100. A lot of people thought P/E was broken and no longer relevant. But then Japan experienced a 78% drawdown from 1989 to 2009 and it still today hasn't gotten back to its 1989 peak. Value investing has a long history of not working for a while and then working again. Maybe this is the time when it finally stops working, but not enough seems different about this time.

I am not sure about the apparent conflict between (a) you can get pretty big odds updates by looking at periods of bad performance and (b) the consensus among smart investors I follow (eg Ken French[10]), and the apparent conclusion from history, is that periods of bad performance don't matter much, and most investors way over-update on losing streaks—institutional investors tend to take money out of funds/strategies right before they outperform and move them into funds/strategies that are about to underperform (https://papers.ssrn.com/sol3/papers.cfm?abstract_id=1523736), such as CalPERS scrapping their tail hedging strategy in Jan 2020 when it would have made a killing in March.

(There's also a question of how to deal with in-sample vs. out-of-sample evidence. If you treat them the same (which I don't think you should), then you'd have a very high credence that factor investing works, and it would take something like a century of contrary evidence to change your mind—see https://blog.thinknewfound.com/2018/06/factor-fimbulwinter/.)

There's an anthropic argument for expecting future returns to be much worse than historical returns. You should expect to invest in a strategy when it's becoming the most popular, because that's when most people are investing. And if a strategy becomes more popular, that should bid up prices and squash future returns. But for something like value investing, we can refute this by looking at valuation spreads and seeing that they've widened, not narrowed.

The other way value investing can fail is if the economy fundamentally changes in a way that makes it not work (irrespective of how popular it is). I don't think the anthropic argument is as strong here, so there's more of a need to explain why value stopped working right now rather than at some other time, so this hypothesis demands more evidence than the "it's too popular" hypothesis which you can easily justify with anthropics.

Methodology details

  • I used the data series "Portfolios formed on E/P" and "E/P Breakpoints".
  • Standard academic definition of the value factor is the top 30% of stocks minus the bottom 30%. The Ken French files don't tell me the historical P/Es of those portfolios, but they do give the P/Es of ventile breakpoints, so instead I used the P/E of the 15th and 85th percentile breakpoints. I also estimated the average P/E of the top and bottom 30% by adding up the estimated average for every ventile, which gave a nearly identical result. Results reported above use the latter method.
  • The Ken French P/E data excludes companies with negative earnings, which in some years is quite a lot of companies. I treated growth stocks as those with high P/Es, which requires positive earnings, whereas the standard value factor would treat companies with negative earnings as growth stocks. This changes the results somewhat, I don't think it has a huge impact because I also looked at P/B (price to book) and saw similar results, and very few companies have negative book value. And a priori I wouldn't expect it to matter much as long as we're looking at the spread between cheaper stocks vs. more expensive stocks, except that including stocks with negative earnings would make all the differences look bigger.
  • Each portfolio starts July 1 and ends June 30, using price and fundamentals from the previous year. This is actually suboptimal (see The Devil in HML's Details) but it's standard academic practice and it's probably fine for our purposes.

Footnotes

[1] It's not really luck, it's probably driven by economic forces—for example, modern tech companies established strong moats which helped them keep persistent earnings growth more so than most companies did historically. This is debatable, but I'm inclined to say that the high profit margins on companies like Alphabet and Microsoft are temporary and competition will eventually drive margins back down. I have a moderately strong prior that markets are competitive and companies can't maintain moats indefinitely.

[2] The numbers for 2020–2022 are kind of insane...my interpretation of what's going on here is by starting in July '20, this data range is effectively picking the bottom of the COVID crash. Value companies' profits got hammered by the economic shutdown, and then the stimulus rebounded the earnings of companies in general but especially value companies, and meanwhile the market was kind of manic about growth companies in 2021-ish (see eg ARKK having a massive return and then crash, meme stocks, Matt Levine's "bored market hypothesis"). For my particular definitions of growth and value, the growth basket experienced -10% earnings growth July '19 to June '20 while value experienced -39%, and then July '20 to June '22, growth rebounded with +8% annualized and value earned +38% annualized. But growth P/Es increased while value P/Es decreased.

[3] A quick probability estimate: I don't have any special insight on AI timelines, I'll just say 25% chance of transformative AI in the next 10 years, which is roughly the "EA consensus forecast". 30% chance that it specifically benefits stockholders, and 50% chance that it differentially benefits growth stocks over value stocks by enough to explain the current spread. This isn't well-considered, just a gut estimate. Result = ~4% probability that AI can explain the current valuation spread. I expect you would put a higher probability on #2 because a slow-takeoff world is more favorable to stockholders and I lean more toward Eliezer on the slow/fast debate.

And even given a thesis like this one, IMO it would probably make more sense to invest in value stocks + a handful of strategically-chosen AI-relevant growth stocks, rather than to invest in growth stocks indiscriminately. I'm considering doing something like this but I want to investigate more first.

[4] I should clarify that growth companies actually do systematically outperform value companies in terms of earnings growth, but not usually by enough to justify the higher P/Es. So what I really mean is that growth companies would have to outperform by a significantly wider margin than they did historically.

[5] The P/E * earnings formula makes sense for individual stocks but it's not the whole picture for baskets of stocks because stocks can enter and leave the basket, so the basket's return is not equal to the return of any fixed set of stocks. The return for a basket is really the return due to multiple expansion plus the return due to earnings growth plus the return due to stocks migrating in and out of the basket. The Research Affiliates paper explains this in more detail.

[6] FWIW I would take Research Affiliates' research with a grain of salt because I don't think they have great epistemics in general, but I think this particular paper is pretty good. They do totally gloss over their finding that the structural return has gone down recently, which I think is a pretty important result that deserves to be addressed.

[7] Laursen & Richardson have a similar paper Is (Systematic) Value Investing Dead? which I think uses a better methodology—it looks at the predictive power of value metrics at the individual stock level—but I can't replicate it because I don't have individual stock data up to 2022.

[8] Like I stated before, I now believe 13% is too low. I wrote this part before writing the earlier part. A higher volatility would make the odds ratios closer to 1.

[9] The simulated strategy puts half in the top value decile (measured by B/M) and half in the top momentum decile, and shorts the market any time the market's 12-month SMA is below 0. I added a -2% annual cost.

[10] A quote from Ken French: "[P]eople are crazy when they try to draw the inferences that they do from 3 or 5 years or even 10 years of performance on an asset class or any actively managed fund or a non-index fund. [...] They see five-year track record and say, "Aha, I know I have a great manager here," when in fact you'll learn almost nothing about a manager's skill from five years of performance." From the Rational Reminder podcast, episode 100.

[11] I haven't really looked into this, but one mathematical justification that comes to mind, and intuitively seems to match the data: rather than drawing from some fixed underlying distribution, markets experience "regimes" where the length of the regime follows something like an exponential distribution. That could explain things like the 1994–1999 tech bubble, where instead of 5 out of 6 years independently experiencing rapid market growth with a widening valuation spread, these years were all correlated because they were part of a particular regime, which we can say in retrospect lasted 6 years but at the time it had indeterminate length. This "regime" perspective matches the way people talk about investing, although I wouldn't put too much credence in it because people might just be finding coincidental clusters in independent data.

What is the easiest, most efficient way to buy the global "agnostic" portfolio? Can you suggest some combination of ETFs (or other vehicles) that would do it? Should FDIC-insured savings accounts and/or CDs also be part of the portfolio? (It seems to be a good deal because the federal government is essentially subsidizing them by providing an implicit guarantee that you won't lose money even if the FDIC exhausts its reserves.)

14% 30 year bonds 14% 10 year foreign bonds

There was some recent relevant discussion under one of Paul Christiano's FB posts, which suggests that buying government bonds may not be a good idea unless one needs the unique features they offer (and I think most of us probably don't?):

This paper and its references seem relevant: https://www.nber.org/papers/w12881.pdf

At a broad level, our evidence is consistent with theories that ascribe a unique value to government debt. Bansal and Coleman (1996) present a theory in which debt, but not equity claims, are money-like and carry a convenience value. They argue that the theory can account for the high average equity premium and low average risk-free rate in the US.4 Our finding of a unique value provided by government debt relative to private debt support theories such as Woodford (1990), Holmstrom and Tirole (1998), and Caballero and Krishnamurthy (2006). In these papers, the government’s credibility gives its securities unique collateral and liquidity features relative to private assets and thereby induces a premium on government assets.

Finally, how would this discussion change if say about every 10 years there was an opportunity to 10x your investment at the cost of .5 probability of it going to 0? (For context see this and this.)

There are a few ways to get something close to the global market portfolio, although they all require making small compromises. Betterment and Wealthfront will give you something like the global market, but each have skews that push them somewhat away from it. The ETF GAA holds the global market portfolio with small tilts toward value and momentum—I happen to think these tilts are a good idea, but it does move it somewhat away from a truly agnostic portfolio.

You could also buy a combination of VT, BND, and BNDX, which will give you the total market in stocks and bonds, although this does exclude smaller asset classes like gold.

Out of these options, I personally would probably invest in GAA, but which is best depends on which compromises you're most willing to make. (I personally don't invest in the global market portfolio, I just invest in VMOT and EQCHX, as discussed in OP.)

RE government bonds: in theory, if you want to increase risk, you should hold equities and bonds in proportion to the global market portfolio and then apply leverage as desired. But this theory assumes you can borrow money at the risk-free rate, which is false. To use leverage, you will probably end up having to pay about 1% on top of short-term interest rates, and given how small the spread is between short- and long-term rates, holding bonds with leverage guarantees you a negative long-run return. For that reason, I personally do not hold any bonds.

But note that it's still possible to make positive return with bonds in the short run. For example, bonds have returned >10% over the past few months, so holding stocks+bonds with leverage would have worked out better than just holding stocks.

RE your last point on special opportunities: I think that's a really important question, and I don't know how to answer it. I don't know how to reconcile the general observation that almost everybody fails to beat the market with certain special cases, e.g., bitcoin like you mentioned. You invested in bitcoin in 2011; I considered investing around the same time, but didn't, in short because I didn't expect to be able to beat the market. Clearly I should have invested in bitcoin, but I don't know of any general strategy that would have led to me investing in bitcoin but wouldn't have led to me making a bunch of other stupid investing decisions. How do you think it is that you have invested in 2-3 money-making special opportunities? What distinguishes those from other, similar-looking opportunities that failed? Have you made any special investments that didn't pan out?

Thanks for your answers! I think I'll probably stick with broad indexes, since as you said investing in factors and managed futures can dramatically underperform the broader market in short time horizons and it will be hard to convince myself that it's a good idea to hold onto them. (This actually happened to me recently. I found a small factor-based investment in my portfolio, saw that it underperformed and couldn't remember the original reason for buying it, so I sold it. Oh, it was also because I needed to raise cash to buy puts and that investment had the lowest or negative capital gains.)

Some discussions I've had on Facebook recently (after writing my question here) that you may find interesting: international equities, cheap leverage, dynamic leverage, bonds, bankruptcy risk

My biggest question currently is about international equities. Looking at historical data it seems that international equities have underperformed (had worse Sharpe ratio than) the US while being strongly correlated with it in recent decades (which made me want to have 9:1 ratio of US to international exposure, as I said in the above FB thread), but a source you cited is predicting much better performance in the future, to the extent that they're recommending 0% exposure to US equities(!) and mostly EM exposure which is super surprising to me. Can you summarize or link to a summary of why they think that?

What distinguishes those from other, similar-looking opportunities that failed?

I don't have a good answer for this. Basically those opportunities just kind of came to me, and I haven't really had to do much to try to filter out other, similar-looking but actually less promising opportunities. I think I just thought about each opportunity for a few days and invested after still thinking it was a good idea.

Have you made any special investments that didn’t pan out?

During the dot-com bubble I tried stock picking, which didn't work out. Recently I put some time/reputation (but no money) into a cryptocurrency startup which didn't go anywhere. I can't recall anything else. But there was another investment that did work out in the 10-100x range that I haven't mention yet, which is that shortly after college I took a year off from work to write a piece of software (Windows SSH server, which didn't exist on the market when I started), then handed it to a partner to develop/sell/manage (while I went back to work for another company) and within about 5 years it started throwing off enough income that I could "retire".

ETA: Oh, I also worked at a couple of startups that compensated partly in stock options that later became worthless.

RE international equities, I wrote about this here to explain why I think most people should underweight US equities.

Looking at historical data it seems that international equities have underperformed

First, if EMH is true, there is no reason to expect US equities to have a higher Sharpe ratio than international equities.

Second, US outperformance is only a recent phenomenon (see this tweet and its replies), and the outperformance is pretty marginal if you look over a long time horizon.

Third, the recent US outperformance is the exact reason why Research Affiliates (RAFI) projects worse returns in the future. The US stock market has outpaced its economic growth, so RAFI is counting on valuations to revert to the mean. There's a lot of historical evidence that markets tend to mean revert like this over sufficiently long time horizons (3-5 years or longer). I haven't read any of the primary research on long-term mean reversion, but apparently the original source was Jegadeesh and Titman (1993), and data is available from the Ken French Data Library (see "6 Portfolios Formed on Size and Long-Term Reversal").

(I cited RAFI for expected return projections, but the analysis is pretty easy to replicate. Just use the discounted dividend model and add in an assumption that P/E ratios will partially mean revert.)

I don't see where RAFI recommends holding 0% exposure to US equities?

RE international equities, I wrote about this here to explain why I think most people should underweight US equities.

A large part of your argument is that one's salaries come from a US source, which doesn't apply to me (the company that provides most of my income has a pretty international revenue source). Also, as I mentioned in the FB thread linked above, US and international equities have become highly correlated in recent decades so using international equities to provide diversification against US economy tanking will not have much effect.

First, if EMH is true, there is no reason to expect US equities to have a higher Sharpe ratio than international equities.

EMH probably isn't true across national boundaries, due to "equity home bias". The US could have a higher Sharpe ratio because of that in combination with things like lower savings rate (higher time preference), better monetary policies (or more cost-effective policies due to reserve currency status), better governance (it seems terrible to me but perhaps still better than most other countries?), sole superpower status (allowing its companies to extract rent across the global with fewer political consequences), etc.

Second, US outperformance is only a recent phenomenon (see this tweet and its replies), and the outperformance is pretty marginal if you look over a long time horizon.

The tweet says outperformance was after 2009, so I asked Portfolio Visualizer to maximize Sharpe ratio based on pre-2009 data, and it says to allocate 8.31% to "Global ex-US Stock Market", but that drops to 0% if I allow it to include "Total US Bond Market" (in which case it says 11% US stocks 89% US bonds). If I also add "Global Bonds (Unhedged)" it says to include 4.38% of that but still 0% of international equities.

add in an assumption that P/E ratios will partially mean revert

From https://www.institutionalinvestor.com/article/b1j0mvcy9792vt/Why-Value-Investing-Sucks:

“This expensing of intangibles, leading to their absence from book values, started to have a major effect on financial data (book values, earnings) from the late 1980s, due to the growth of corporate investment in intangibles,” they wrote. Speaking to II, Lev explains that this “madness of accounting” has dragged down the performance of value investors ever since.

“All the important investments like R&D and IT are immediately expensed, and people are left with highly misleading ideas about profitability and about value,” he says. “Especially with respect to small companies and medium companies that are not followed by a lot of financial analysts and not written up by the media, people rely on the financial reports. And they are terrible.”

I don’t see where RAFI recommends holding 0% exposure to US equities?

On https://interactive.researchaffiliates.com/asset-allocation#!/?category=Efficient&currency=USD&model=ER&scale=LINEAR&selected=160&terms=REAL&type=Portfolios, on the left side-bar click on "Efficient" to expand it, click on "14.0% Volatility" or any other one there, on the right side-bar click on "Equities" to expand it, and it says 0.0% for "US Large" and "US Small".

I think it's pretty dangerous to reason "asset X has outperformed recently, so I expect it to outperform in the future." An asset can outperform because it's becoming more expensive, which I think is partly the case here.

This is most obvious in the case of bonds---if 30-year bonds from A are yielding 2%/year and then fall to 1.5%/year over a decade, while 30-year bonds from B are yielding 2%/year and stay at 2%/year, then it will look like the bonds from A are performing about twice as well over the decade. But this is a very bad reason to invest in A. It's anti-inductive not only because of EMH but for the very simple reason that return chasing leads you to buy high and sell low.

This is less straightforward with equities because earnings accounting is (much) less transparent than bond yields, but I think it's a reasonable first pass guess about what's going on (combined with some legitimate update about people becoming more pessimistic about corporate performance/governance/accounting outside of the US). Would be interested in any data contradicting this picture.

I do think that international equities will do worse than US equities after controlling for on-paper earnings. But they have significantly higher on-paper earnings, and I don't really see how to take a bet about which of these effects is larger without getting into way more nitty gritty about exactly what mistake we think which investors are making. If I had to guess I'd bet that US markets are salient to investors in many countries and their recent outperformance has made many people overweight them, so that they will very slightly underperform. But I'd be super interested in good empirical evidence on this front too.

(The RAFI estimates generally look a bit unreasonable to me, and I don't know of an empirical track record or convincing analysis that would make me like them more.)

I personally just hold the market portfolio. So I'm guaranteed to outperform the average of you and Michael Dickens, though I'm not sure which one of you is going to do better than me and which one is going to do worse.

Thanks for engaging on this. I've been having trouble making up my mind about international equities, which is delaying my plan to leverage up (while hedging due to current market conditions), and it really helps to have someone argue the other side to make sure I'm not missing something.

This is most obvious in the case of bonds—if 30-year bonds from A are yielding 2%/year and then fall to 1.5%/year over a decade, while 30-year bonds from B are yielding 2%/year and stay at 2%/year, then it will look like the bonds from A are performing about twice as well over the decade. But this is a very bad reason to invest in A. It’s anti-inductive not only because of EMH but for the very simple reason that return chasing leads you to buy high and sell low.

Assuming EMH, A's yield would only have fallen if it has become less risky, so buying A isn't actually bad, unless also buying B provides diversification benefits. Applying this to stocks, we can say that under EMH buying only US stocks has no downsides unless international equities provide diversification benefits, and since they have been highly correlated in recent decades (after about 1990) we lose very little by buying only US stocks.

Of course in the long run this high correlation between US and international equities can't last forever, but it seems to change slowly enough over time that I can just diversify into international equities when it looks like they've started to decorrelate.

If I had to guess I’d bet that US markets are salient to investors in many countries and their recent outperformance has made many people overweight them, so that they will very slightly underperform. But I’d be super interested in good empirical evidence on this front too.

US stock is 35% owned by non-US investors as of 2018 and had been going up recently. Meantime non-US stock is probably >90% owned by non-US investors (not sure how to find the data directly, but US investors only have 10% international equities in their stock portfolio). My interpretation is that non-US investors are still under-weighing US stocks but have reduced their bias recently and this contributed to US outperformance, and the trend can continue for a while longer before petering out.

A lot of my thinking here comes from observing that people in places like China have much higher savings rates, but it's a big hassle at best for them to invest in US stocks (due to anti-money laundering and tax laws) and many have just never even thought in that direction, so international investment opportunities have been exhausted to a greater degree than US ones, and the data seems consistent with this.

Let me know if the above convinces you to move in my direction. If not, I might move to a 4:1 ratio of US to international equities exposure instead of 9:1.

I personally just hold the market portfolio.

BTW while looking for data, I came across this article which seems relevant here, although I'm not totally sure their reasoning is correct. I'm confused about how to reason about "market portfolio" or "properly balanced portfolio" in a world with strong "home bias" and "controlling shareholders".

But in Corporate Governance and the Home Bias (NBER Working Paper No. 8680), authors Lee Pinkowitz, Rene Stulz, and Rohan Williamson assert that at least some of the oft-noted tilt is not a bias at all but simply a reflection of the fact that a sizeable number of shares worldwide are not for sale to the average investor. They find that comparisons of U.S. portfolios to the world market for equities have failed to consider that the "controlling shareholders" who dominate many a foreign corporation do not make their substantial holdings available for normal trading.

Take this into account, the authors argue, and as much as half of the home bias disappears. A more accurate assessment of globally available shares, they say, would show that about 67 percent of a properly balanced U.S. portfolio would be invested in U.S. companies.

I'm surprised by (and suspicious of) the claim about so many more international shares being non-tradeable, but it would change my view.

I would guess the savings rate thing is relatively small compared to the fact that a much larger fraction of US GDP is inevestable in the stock market---the US is 20-25% of GDP, but the US is 40% of total stock market capitalization and I think US corporate profits are also ballpark 40% of all publicly traded corporate profits. So if everyone saved the same amount and invested in their home country, US equities would be too cheap.

I agree that under EMH the two bonds A and B are basically the same, so it's neutral. But it's a prima facie reason that A is going to perform worse (not a prima facie reason it will perform better) and it's now pretty murky whether the market is going to err one way or the other.

I'm still pretty skeptical of US equities outperforming, but I'll think about it more.

I haven't thought about the diversification point that much. I don't think that you can just use the empirical daily correlations for the purpose of estimating this, but maybe you can (until you observe them coming apart). It's hard to see how you can be so uncertain about the relative performance of A and B, but still think they are virtually perfectly correlated (but again, that may just be a misleading intuition). I'm going to spend a bit of time with historical data to get a feel for this sometime and will postpone judgment until after doing that.

The Institutional Investor hyperlink is broken. Here's one that works: https://www.institutionalinvestor.com/article/b1j0mvcy9792vt/Why-Value-Investing-Sucks

To use leverage, you will probably end up having to pay about 1% on top of short-term interest rates

Not a huge deal, but it seems like the typical overhead is about 0.3%:

  • This seems to be the implicit rate I pay if I buy equity futures rather than holding physical equities (a historical survey: http://cdar.berkeley.edu/wp-content/uploads/2016/12/futures-gunther-etal-111616.pdf , though you can also check yourself for a particular future you are considering buying, the main complication is factoring in dividend prices)
  • Wei Dai has recently been looking into box spread financing which were around 0.55% for 3 years, 0.3% above the short-term treasury rate.
  • If you have a large account, interactive brokers charges benchmark+0.3% interest.

I suspect risk-free + 0.3% is basically the going rate, though I also wouldn't be too surprised if a leveraged ETF could get a slightly better rate.

If you are leveraging as much as described in this post, it seems reasonably important to get at least an OK rate. 1% overhead is large enough that it claws back a significant fraction of the value from leverage (at least if you use more realistic return estimates).

Side note on tax considerations of financing methods (for investing in taxable accounts):

  • With futures you are forced to realize capital gains or losses at the end of every year even if you hold the futures longer than that.
  • With either box spread financing or margin loans, if you buy and hold investments that rise in value, you don't have to realize capital gains and can avoid paying capital gains taxes on them altogether if you donate those investments later.
  • With box spread financing, the interest you pay appears in the form of capital losses (upon expiration of the box spread options, in other words the loan), which you can use to offset your capital gains if you have any, but can't reduce your other taxable income such as dividend or interest income (except by a small fixed amount each year).
  • With margin loans, your interest expense is tax deductible but you have to itemize deductions (which means you give up your standard deductions).
  • With futures, the interest you "pay" is baked into the amount of capital gains/losses you end up with.

I think (assuming the same implicit/explicit interest rates for all 3 financing methods) for altruists investing in taxable accounts, this means almost certainly avoiding futures, and considering going with margin loans over box spread financing if you have significant interest expenses and don't have a lot of realized capital gains each year that you can offset. (Note that currently, possibly for a limited time, it's possible to lock in a 2.7-year interest rate using box options, around .6%, that is lower than IB's minimum interest rate, .75%, so the stated assumption doesn't hold.)

I haven't done a deep dive on this but I think futures are better than this analysis makes them look.

Suppose that I'm in the top bracket and pay 23% taxes on futures, and that my ideal position is 2x SPY.

In a tax-free account I could buy SPY and 1x SPY futures, to get (2x SPY - 1x interest).

In a taxable account I can buy 1x SPY and 1.3x SPY futures. Then my after-tax expected return is again (2x SPY - 1x interest).

The catch is that if I lose money, some of my wealth will take the form of taxable losses that I can use to offset gains in future years. This has a small problem and a bigger problem:

  • Small problem: it may be some years before I can use up those taxable losses. So I'll effectively pay interest on the money over those years. If real rates were 2% and I had to wait 5 years on average to return to my high-water mark, then this would be an effective tax rate of (2% * 5 years) * (23%) ~ 2.3%. I think that's conservative, and this is mostly negligible.
  • Large problem: if the market goes down enough, I could be left totally broke, and my taxable losses won't do me any good. In particular, if the market went down 52%, then my 2x leveraged portfolio should be down to around 23% of my original net worth, but that will entirely be in the form of taxable losses (losing $100 is like getting a $23 grant, to be redeemed only once I've made enough taxable gains).

So I can't just treat my taxable losses as wealth for the purpose of computing leverage. I don't know exactly what the right strategy is, it's probably quite complicated.

The simplest solution is to just ignore them when setting my desired level of leverage. If you do that, and are careful about rebalancing, it seems like you shouldn't lose very much to taxes in log-expectation (e.g. if the market is down 50%, I think you'd end up with about half of your desired leverage, which is similar to a 25% tax rate). But I'd like to work it out, since other than this futures seem appealing.

In a taxable account I can buy 1x SPY and 1.3x SPY futures. Then my after-tax expected return is again (2x SPY − 1x interest).

The catch is that if I lose money, some of my wealth will take the form of taxable losses that I can use to offset gains in future years.

This is a really interesting and counterintuitive idea, that I really like, but after thinking about it a lot, decided probably does not work. Here's my argument. For simplicity let's assume that I know for sure I'm going to die in 30 years[1] and I'm planning to donate my investment to a tax-exempt org at that point, and ignore dividends[2]. First, the reason I'm able to get a better expected return buying stocks instead of a 30-year government bond is that the market is compensating me for the risk that stocks will be worth less than the 30-year government bond at the end of 30 years. If that happens, I'm left with 0.3x more losses by buying 1.3x futures instead of 1x stock, but the tax offset I incurred is worth nothing because they go away when I die so they don't compensate me for the extra losses. (I don't think there's a way to transfer them to another person or entity?) So (compared to leveraged buy-and-hold) the futures strategy gives you equal gains if stocks do better than risk free return, but is 0.3x worse if stocks do worse than risk free return. Therefore leveraged buy-and-hold does seem to represent a significant free lunch (ultimately coming out of government pockets) compared to futures.

ETA: The situation is actually worse than this because there's a significant risk that during the 30 years the market first rises and then falls, so I end up paying taxes on capital gains during the rise, that later become taxable losses that become worthless when I die.

ETA2: To summarize/restate this in a perhaps more intuitive way, comparing 1x stocks with 1x futures, over the whole investment period stocks give you .3x more upside potential and the same or lower downside risk.

[1] Are you perhaps assuming that you'll almost certainly live much longer than that?

[2] Re: dividends, my understanding is that equity futures are a pure bet on stock prices and ignore dividends, but buying ETFs obviously does give you dividends, so (aside from taxes) equity futures actually represent a different risk/return profile compared to buying index ETFs. I'm not sure how to think about this, e.g., can we still treat SPY and SPX futures as nearly identical (aside from taxes), and which is a better idea overall if we do take both dividends and taxes into account?

What is the easiest, most efficient way to buy the global "agnostic" portfolio?

Coincidentally, I asked this question here a couple of months before your comment and got some useful answers.

My understanding is that the sharpe ratio of the global portfolio is quite similar to the equity portfolio (e.g. see here for data on the period from 1960-2017, finding 0.36 for the global market and 0.37 for equities).

I still do expect the broad market to outperform equities alone, but I don't know where the super-high estimates for the benefits of diversification are coming from, and I expect the effect to be much more modest then the one described in the linked post by Ben Todd. Do you know what's up with the discrepancy? It could be about choice of time periods or some technical detail, but it's kind fo a big discrepancy. (My best guess is an error in the linked post.)

My estimates came from the book Global Asset Allocation by Meb Faber. I expect it's less rigorous than the paper you link to, so I suppose we should trust the paper more.

I did find the results of the paper pretty surprising though. It just makes a lot of intuitive sense that bonds with anticorrelate with equities during recessions and real assets will anticorrelate during inflation shocks, which should reduce the risk quite a bit.

Also, all the other estimates I seen show that adding bonds to an all equity portfolio significantly increases sharpe (usually from ~0.3 to ~0.4). (And also that adding real assets helps too, though these estimates are less common.)

I'm wondering if the period used in paper might have been an unusually good time for equities. Meb Faber uses the period 1973-2013. The paper uses 1960 to 2017. 2017 was near a high for the equity market, whereas 2013 was more mid-cycle, which will favour equities. The 60s were a good time for equities, while the 70s were bad, so adding the 60s into the range will boost equities.

Ideally I'd also compare the percentages in each asset. One difference is that Faber's 'GAA' allocation includes 5% gold, which usually seems to improve sharpe quite a bit, since gold was one of the only assets that did well in the 70s*. Faber also gets similar results with what he calls the 'Arnott Portfolio' which doesn't include gold and is fairly in line with my estimate of the global capital portfolio, except using TIPs+REITs+commodities instead of private real estate.

I'd also trust the GMP a lot more out of sample due to the theoretical underpinning.

*My theory for why gold helps sharpe (even though it's only 1% of total wealth) is that the global capital portfolio includes a lot of private real estate that is not in the global portfolio of listed assets. This means most 'global market portfolios' are light on real assets, and adding some gold/TIPs/commodities balances this out, getting you closer to the true global capital portfolio.

I also like GMP, and find the paper kind of surprising. I checked the endpoints stuff a bit and it seems like it can explain a small effect but not a huge one. My best guess is that going from equities to GMP is worth like +1-2% risk-free returns.

My estimates came from the book Global Asset Allocation by Meb Faber. I expect it's less rigorous than the paper you link to, so I suppose we should trust the paper more.

The data in /Global Asset Allocation/ came from Global Financial Data. I don't know the details of how GFD's data is constructed, but I've seen it used by quite a few papers and a lot of institutions use it, so I assume it's pretty reliable. Without having read it, I don't expect the Doeswijk paper is unreliable either—they probably get different results because (1) they use different time horizons and (2) they don't include the same countries in their samples (I think Doeswijk includes more).

While I don't doubt the specific historical results in the paper, in general I would expect the global market portfolio to outperform every individual asset class (on a risk-adjusted basis) in the long run, although it's expected that some asset classes will outperform GMP for multiple decades in a row. (Faber actually discusses this in Global Asset Allocation!) I agree it's plausible that the paper happened to pick a good time for equities.

I'm currently helping put together the investment strategy for a DAF and my tentative conclusion is that (contrary to what it says in most EA investment-related articles) it doesn't make sense to use a leveraged global market portfolio instead of (leveraged) global stocks. Perhaps much of the theory doesn't apply in practice because it doesn't take fees and the cost of leverage into account:

Bonds:

  • Buying bonds/TIPS with a ~0% return at a 0.75% margin loan cost seems like a certain loss. (Perhaps this was different before quantitative easing, so it might make more sense again at some point in the future.) (EDIT: The currently cheapest source of leverage appears to be box spread financing at ~0.55% p.a. for 3 years. The 3y US govt bond yield is 0.2% p.a. So even with cheap sources of leverage, it's not worth it.)
  • Bonds (weighted BND + BNDX) slightly underperformed cash in the recent crisis, so perhaps aren't very anticorrelated with stocks.

Commodities: Commodity ETFs have high TERs of ≥0.58%; buying and rolling individual futures costs time. (EDIT: Even gold (GLD) has a TER of 0.4%.)

(REITs: Already included in stock ETFs.)

(Added some edits in parentheses to the first paragraph.)

Yeah I think it probably makes sense not to hold bonds if you're using leverage and you can't get leverage at close to the risk-free rate. I personally don't hold any long-only bonds. But the argument for holding bonds is that they might be negatively correlated with stocks, in which case a negative expected return might still be worth it. Historically they've had close to 0 correlation, not a negative correlation, so I don't find this argument that persuasive.

For commodities, their returns are much harder to project than bonds (where you can just look at the yield), so it's hard to say whether they're worth it. I personally don't hold any long-only commodities.

What are your thoughts on high-yield corporate bonds or emerging markets bonds? This kind of bond offers non-zero interest rates but of course also entail higher risk. Also, these markets aren't (to my knowledge) distorted by the Fed buying huge amounts of bonds.

Theoretically, there should be some diversification benefit from adding this kind of bond, though it's all positively correlated. But unfortunately, ETFs on these kinds of bonds have much higher fees.

[disclosure: not an economist or investment professional]

emerging market bonds ... aren't (to my knowledge) distorted by the Fed buying huge amounts of bonds

This seems wrong — the spillover effects of 2008–13 QE on EM capital markets are fairly well-established (cf the 'Taper Tantrum' of 2013).

see e.g. Effects of US Quantitative Easing on Emerging Market Economies

"We find that an expansionary US QE shock has significant effects on financial variables in EMEs. It leads to an exchange rate appreciation, a reduction in long-term bond yields, a stock market boom, and an increase in capital inflows to these countries."

I don't know much about emerging market bonds so I can't make any confident claims, but I can say how I am thinking out it for my personal portfolio. I considered holding emerging market bonds because the yield spread between them and and developed-market bonds is unusually high. I decided not to hold them because I don't think they provide enough diversification benefit in the tails. Since I invest with leverage, it doesn't necessarily make sense for me to maximally diversify, I only hold assets if I think the benefit overcomes the extra cost of leverage. But I do believe it might make sense to hold emerging bonds for someone with a less leveraged, more diversified portfolio. That said, I would consider them a "risky" asset, not a "safe" asset, and plan accordingly.

The drawdowns of major ETFs on this (e.g. EMB / JNK) during the corona crash or 2008 are roughly 2/3 to 3/4 of how much stocks (the S&P 500) went down. So I agree the diversification benefit is limited. The question, bracketing the point on leverage extra cost, is whether the positive EV of emerging markets bonds / high yield bonds is more or less than 2/3 to 3/4 of the positive EV of stocks. That's pretty hard to say - there's a lot of uncertainty on both sides. But if that is the case and one can borrow at very good rates (e.g. through futures or box spread financing) then the best portfolio should be a levered up combination of bonds & stocks rather than just stocks.

FWIW, I'm in a similar position regarding my personal portfolio; I've so far not invested in these asset classes but am actively considering it.

(moved up)

[This comment is no longer endorsed by its author]Reply

I like this post a good deal.

However, I think you overstate the benefits.

I like the idea of shorting the S&P and buying global ex-US stocks, but beware that past correlations between markets only provide a rough guess about future correlations.

I'm skeptical that managed futures will continue to do as well as backtesting suggests. Futures are new enough that there's likely been a moderate amount of learning among institutional investors that has been going on over the past couple of decades, so those markets are likely more efficient now than history suggests. Returns also depend on recognizing good managers, which tends to be harder than most people expect.

Startups might be good for some people, but it's generally hard to tell. Are you able to find startups before they apply to Y Combinator? Or do startups only come to you if they've been rejected by Y Combinator? Those are likely to have large effects on your expected returns. I've invested in about 10 early-stage startups over a period of 20 years, and I still have little idea of what returns to expect from my future startup investments.

I'm skeptical that momentum funds work well. Momentum strategies work if implemented really well, but a fund that tries to automate the strategy via simple rules is likely to lose the benefits to transaction costs and to other traders who anticipate the fund's trades. Or if it does without simple rules, most investors won't be able to tell whether it's a good fund. And if the strategy becomes too popular, that can easily cause returns to become significantly negative (whereas with value strategies, popularity will more likely drive returns to approximately the same as the overall market).

Thanks for the comments, Peter!

I'm skeptical that managed futures will continue to do as well as backtesting suggests.

Me too, I did adjust the return estimate way down from the backtest I quoted, but I can see an argument that managed futures will provide zero excess return in the future.

Regarding momentum, see AQR's Fact, Fiction and Momentum Investing—specifically, "Myth No. 4: Momentum Does Not Survive, Or Is Seriously Limited By, Trading Costs."

I was reviewing my notes and I found this paper on managed futures: https://www.aqr.com/Insights/Research/White-Papers/Trend-Following-in-Focus

The paper has a section on why they don't think managed futures (a.k.a. trendfollowing) will stop working in the near future. Here's the summary I wrote in my notes (of the relevant section):

  • Assets invested in trendfollowing peaked in mid-2008 at $210B, and have declined to $120B
  • All systematic hedge fund strategies have $500B AUM, or 17% of all hedge fund assets
  • Futures market has grown since 2008, so trendfollowing as a % of futures markets has decreased by more than half

I don't find this super convincing, it's definitely still conceivable that trendfollowing strategies could basically stop working, but it's evidence that trendfollowing is not over-subscribed.

I'm the founder of Antigravity Investments, an EA social enterprise and SEC-registered investment advisor with the mission of donating millions of dollars to high-impact causes by increasing returns on charitable capital held by donors, nonprofits, foundations, etc. We've advised over $20 million in charitable capital and been supported by CEA's EA Grants program, the Berkeley SkyDeck accelerator, American Express, and Ashoka.

If anyone would like implementation assistance, I think we're a good alternative to Alpha Architect—we also operate in the evidence-based investing space, and we provide free advising to EAs along with lower-cost investment management. We're an advisor on the Interactive Brokers platform and also support other brokerage firms like Vanguard.

I like the breadth of content covered in this post. Regarding implementation details, if a small donor is going to fund things that are different than what other EAs would typically fund—an approach that various EAs have advocated for and one that I personally support—then I think there's a strong argument to not "invest all your altruistic funds into a managed futures fund." Separately, I think there's a high likelihood that this approach (i.e. 100% in QMHIX or EQCHX) will underperform a balanced portfolio, GAA, and a lot of other approaches over a short-term, medium-term, and long-term timeframe.

If someone is taking the approach of diversifying into other assets that most of the money in EA is not invested in, I'm more enthusiastic about speculating in asset classes that have historically experienced good returns (venture capital or even gold), or perhaps more promising, investing in a market that isn't that efficient or that the investor believes they might have an edge in (cryptocurrencies, prediction markets, angel investing, etc).

I believe that Good Ventures' investment data may be available on their Form 990. I am writing an upcoming article on how EAs can use Form 990 data to increase funding for charitable causes, potentially by millions of dollars with only a few hours of effort. I will try to update this comment when my article is out.

Regarding implementation details, if a small donor is going to fund things that are different than what other EAs would typically fund—an approach that various EAs have advocated for and one that I personally support—then I think there's a strong argument to not "invest all your altruistic funds into a managed futures fund."

I don't really understand what you're saying here.

Separately, I think there's a high likelihood that this approach (i.e. 100% in QMHIX or EQCHX) will underperform a balanced portfolio, GAA

That's true, I said that in the post. QMHIX/EQCHX might also have a worse ex-ante Sharpe ratio than GAA. The argument for investing in managed futures is that it has positive expected return (not guaranteed) and has basically zero correlation with stocks and bonds.

I'm more enthusiastic about speculating in asset classes that have historically experienced good returns (venture capital or even gold)

  1. VC is highly correlated with equities, and as an asset class, historically it has performed worse than the S&P 500. Only the top ~quarter of VC firms have outperformed the S&P 500. Investing in, say, Sequoia seems like a good idea, in the same way that investing in the Renaissance Medallion Fund seems like a good idea, but I don't believe any funds like that are open to new investors. If I could invest in the Medallion Fund, I totally would.
  2. Gold has only performed well relatively recently. In the long run, there is no reason to expect gold to have a real return above 0% because it doesn't generate any cash flows like stocks and bonds do, and it doesn't gain value over time except via inflation. A quick search found this page, which shows gold averaged only a 1.2% real return from 1915 to 2020. Research Affiliates projects a -3.6% annual real return for gold over the next 10 years (I don't know their methodology for predicting gold prices, but I assume it's good because their stuff is usually good).

I believe that Good Ventures' investment data may be available on their Form 990.

Yep, I looked into Good Ventures' Form 990 recently. From what I saw, they don't appear to invest meaningful amounts of money, they just receive money from Cari and Dustin more or less as they donate it. According to Forbes, Cari and Dustin have almost all their money in Facebook stock (which strikes me as an extremely bad idea in principle, although presumably it's not easy for them to liquidate their stock and diversify).

I don't really understand what you're saying here.

I meant that if a donor isn't going to make generic grants, like funding a GiveWell top charity, and will instead do things like fund small EA projects that might not otherwise be funded, then pursuing a more reliable investing approach would be a better bet.

If a non-generic donor pursues a risk neutral approach or invests in a single asset class, that could jeopardize their grantmaking, and from the donor's perspective the downside of not being able to fund a considerable number of projects if there are bad investment outcomes likely outweighs the expected benefit of fractionally shifting the EA community as a whole towards choosing more unusual asset classes.

That's true, I said that in the post. QMHIX/EQCHX might also have a worse ex-ante Sharpe ratio than GAA. The argument for investing in managed futures is that it has positive expected return (not guaranteed) and has basically zero correlation with stocks and bonds.

Right, and I stated that to emphasize other approaches I mentioned later in my comment that might have had and may continue to have decent returns with zero correlation.

VC is highly correlated with equities, and as an asset class, historically it has performed worse than the S&P 500.
Gold has only performed well relatively recently. In the long run, there is no reason to expect gold to have a real return above 0% because it doesn't generate any cash flows like stocks and bonds do, and it doesn't gain value over time except via inflation.

There are a wide variety of views on whether it is wise to invest in every single asset class, from Bitcoin, to gold and venture capital which I mentioned, to managed futures which you mentioned.

I don't have strong asset class views because Antigravity Investments follows the approach of using quantitative/evidence-based investing to allocate different amounts to different asset classes at various points in time rather than sticking with a particular one for the long haul. I think that writing off entire asset classes may not be a good approach due to the inherently challenging-to-predict nature of future investment returns.

Regarding venture capital, this document from Invesco (which is not trying to sell a VC investment) notes there was a -0.06 correlation between venture capital and large-cap equities from 1990-2014. That document also notes that "top quartile absolute returns for venture capital have historically exceeded those for other asset classes." Top-quartile outperformance in VC is especially interesting because unlike equity funds in recent decades, it seems like VC funds may experience consistent outperformance across time. Whether that's due to skill, simply having access to better networks and deal flow, or some combination of both is the question.

Gold definitely struggles with some of the issues commodities and currencies as a whole have (debatable long-term value), but it's also recommended by the founder of the largest hedge fund in the world, so I don't think there's no case to be made for it (not saying there is, either, since I don't hold strong asset class views). A 7.8% non-inflation-adjusted return from 1972 to 2020 with 0.02 market correlation doesn't seem that terrible, although there are rather awful, extended drawdowns of course. I'm not saying that gold is or isn't a good long-term investment, but clearly gold and other things that have uncertain intrinsic value like Bitcoin can be good investments if held during the appropriate times.

I wrote a follow-up to this post on my website, Do Theoretical Models Accurately Predict Optimal Leverage? I haven't posted it to the EA Forum because it's not directly relevant to EA.

Some related posts on LessWrong:

  • The EMH Aten't Dead, especially section Modern Edges are Completely Ridiculous and the discussion of value investing and Buffett's success there. The author writes this here, though:
This might be a good time to confess that I’m currently testing a momentum (trend-following) strategy with a small part of my portfolio, which, uh… flies in the face of all of the above. It’s performed almost comically badly through the COVID-19 crash, which ought to have been a delicious punishment for my hypocrisy and hubris, except that I just so happened to over-rule the crucial decision (i.e, I got lucky). I’m also tracking the counterfactual where I stuck with the experiment: if momentum really does turn out to be a persistent anomaly in otherwise efficient markets, then that would be fascinating—either way, I’ll try to write up a review some time later this year.

(More speculation by me, good chance of being way off)

Another similar investment idea: Instead of buying a managed futures fund, buy value and momentum funds while shorting the broad market to produce net zero stock exposure, and then apply lots of leverage.

I feel like it's worth emphasizing the benefits of this more. Can't this significantly reduce the risk and volatility of your portfolio? OTOH, some of the funds you mention have only been around for a few years, and they have done really poorly, as Paul pointed out. I don't have confidence that they're well-managed.

For value stocks, what about buying VOOV or Buffett's Berkshire Hathaway BRK.B? Worth keeping in mind that BRK.B has dropped ~50% during some crashes, and VOOV has only been around since 2010.

For those interested in global health and poverty, you may end up (very) correlated with Gates, Buffett and the Gates Foundation if you're investing in value ETFs and the strategies happen to lead to similar choices, and obviously if you buy BRK.B. I think most of Gates' wealth is no longer in Microsoft, but I'm not sure how much he has left in it.

(I'll preface by saying that I'm a new to finance, so I could be very wrong.)

I think it's plausible that an isoelastic utility function in wealth is a poor fit, even for those who are risk-neutral in their altruism (and even completely impartial). I wouldn't be surprised if our actual utility functions

1. have decreasing marginal returns at low wealth (and maybe even increasing marginal returns at some levels of low wealth),

2. have a roughly constant marginal returns for a while (the same rightmost derivative as in 1), at the rate of the best current donation opportunities, and

3. have decreasing marginal returns again at very high levels of wealth (maybe billions or hundreds of millions, within a few orders of magnitude of Good Ventures' funds.)

1 is because of personal risk aversion and/or better returns on self-investment than donations compared to 2, where the returns come mainly from donations. 3 is because of eventually marginally decreasing altruistic returns on donations.

I made a graph to illustrate. I think region 2 is probably much larger relative to the other regions, and 1 is probably much smaller than 3. I also think this is missing some temporal effects for 1: you need money every year to survive, not just in the long run, and donation opportunities may be better or worse in the future.

For this reason and psychological reasons, it might be better to compartmentalize your wealth and investments into:

A. Short-term expenses, including costs of living, fun stuff, and maybe some unforeseen expenses (school, medical expenses, unique donation opportunities during times where your investments are doing poorly, to avoid pulling from them). This should be pretty low risk. This is what your chequing account, high-interest savings account, CDs (certificates of deposit, GICs in Canada), and maybe bonds could be for.

B. Retirement.

C. Altruistic investments and donations. Here you can take on considerable risk and use high amounts of leverage, maybe even higher than what you've recommended. I would recommend against any risks that could leave you owing a lot of money, even in the short-term, enough to cause you to need to withdraw from A or B. Risk neutral altruists can maximize expected long-run returns here, although discounting long-run returns that go into scenario 3. Because of A and B, we're past scenario 1, so either in 2 or 3. Your mathematical arguments could approximately apply, with caveats, if most of the expected gains come from staying within 2.

If you plan to buy a house, that might deserve its own category. Your time frame is usually longer than in A but shorter than in B.

We could account for this by treating mean return and standard deviation as distributions rather than point estimates, and calculating utility-maximizing leverage across the distribution instead of at a single point. This raises a further concern that we don’t even know what distribution the mean and standard deviation have, but at least this gets us closer to an accurate model.

Why not just take the actual mean and standard deviation, averaging across the whole distribution of models?

What exactly is the "mean" you are quoting, if it's not your subjective expectation of returns?

(Also, I think the costs of choosing leverage wrong are pretty symmetric.)

Startups
Another low-correlation investment opportunity, suggested by Paul Christiano

Should private equity ETFs be part of a global market portfolio? PSP, IPRV, and XLPE track private equity indices synthetically, BIZD invests in VC-ish companies. According to the McKinsey Global Private Markets Review 2019 (p. 15), global private equity AUM is $3.4 trillion, or ~2% of the global market portfolio.

Private equity is indeed a part of the global market portfolio, so on priors, it makes sense to invest in private equity. I don't know much about it, but my understanding is that the existing private equity ETFs don't do a good job of tracking the market—private equity is, well, private, so you can't really index it.

Hm, interesting, thanks. The fees are also very high, so it may not be worth it.

It seems like Ben Todd is saying that increasing one's exposure to stocks increases risk, but Lifecycle Investing is saying this decreases risk when done early on. How should we reconcile these two views?

Both are correct. The claim made by Lifecycle Investing is not that increasing stock exposure decreases risk in general. The claim is that by increasing stock exposure early in life and decreasing late in life, while keeping net lifetime exposure the same, you decrease risk.

The argument for this claim is that you have more dollars when you're older, therefore market swings in later years have a bigger effect on your portfolio than in earlier years. But you can negate this effect by using leverage when you're young, thus effectively increasing how much money you're investing with, and holding more bonds/cash when you're older.

Simplified example: suppose you have $100 today and will get another $100 next year. If you invest all your money in stocks during both years, then you are exposing $100 to equity risk this year, but $200 next year. If instead you invest with 1.5:1 leverage this year, and then next year you only invest 75% of your money, that means you're exposing $150 to equity risk during both years. Either way, you're investing $150 per year on average. But in the former scenario, you are taking twice as much risk in year 2, whereas in the latter scenario, you take the same amount of risk both years, which is better.

I'm not sure I'm explaining it well, so let me know if that doesn't make sense.

OK that makes sense, thanks.

IIRC Interactive Brokers isn't going to let you lever up more than about 2:1, though if you have 'separate' personal and altruistic accounts you can potentially lever your altruistic side higher. e.g. if you have 50k in personal accounts and 50k in altruistic accounts, you can get 100k in margin, allowing you to lever up the altruistic side 3:1.

Lazy people can access mild leverage (1.5:1) through NTSX for low fees. Many brokerages don't grant access to the more extreme 3:1 ETFs.

Interactive Brokers allows much higher leverage for accounts with portfolio margin enabled, e.g. greater than 6:1. That requires options trading permissions, in turn requiring some combination of options experience and an online (easy) test.

I would be more worried about people blowing up their life savings with ill-considered extreme leverage strategies and the broader fallout of that.


Curated and popular this week
Relevant opportunities