This is the third in a sequence of posts taken from my recent report: Why Did Environmentalism Become Partisan?
Summary
Rising partisanship did not make environmentalism more popular or politically effective. Instead, it saw flat or falling overall public opinion, fewer major legislative achievements, and fluctuating executive actions.
Public Opinion...
I think right now EAs might be making a significant mistake by paying insufficient attention to the political realm. As EAs we tend to figure out what’s most impactful for us to work on and focus hard. That’s great! But there are various actions that are ‘non-delegatable’ - the extent to which an individual can do the action is limited (like voting, going to a protest, making hard money contributions to particular campaigns). It might be useful if we were all more in the habit of doing variou...
This post presents the executive summary from Giving What We Can’s impact evaluation for 2025. At the end of this post we share links to more information, including the full report and...
Primary Author: Sanjay Joshi, with thanks to multiple reviewers in SoGive
This was submitted to the GiveWell Change Our Mind Contest.
Exec summary
SoGive believes GiveWell could fruitfully employ more effort researching the discount rate. This document will set out the following points:
Small changes in discount rate (e.g. 4% to 5%) can cause material changes in cost-effectiveness numbers (e.g. 13.5x cash to 11x cash) for deworming interventions
Givewell's discount rate is lower than some other actors (GiveWell: 4%, World bank: 10-12%, JPAL: 10%)
GiveWell uses a non-standard method of constructing a discount rate; other standard methodologies give different answers (Ramsey formula: 6.2%, GiveWell: 4%)
GiveWell appear to have missed reasonable arguments in favour of a pure rate of time preference
GiveWell could consider catastrophic risks more thoughtfully (GiveWell includes 1.4% for this; reasonable alternative figures include 0.1% (Stern Review) and 2.3% (SoGive estimate))
GiveWell should consider the amount of uncertainty in their discount rates and consider whether declining discount rate considerations apply
This document covers the main GiveWell discount rate of 4% used to discount future economic/financial benefits. GiveWell also uses a discount rate of 0.5% for future averted deaths in the New Incentives model. Because of time constraints, we only focused on the 4% discount rate.
Ideally we would prefer to avoid giving a recommendation for the discount rate which GiveWell should use, since our document highlights several areas where further research is needed. However our non-resilient impressions are outlined below:
Table 1: Highly non-resilient impressions about how GiveWell should change the discount rate
Consideration
Δ
Comments
3. Discount rate construction method
0%
We tentatively prefer GiveWell’s method to the Ramsey Formula
4. Pure rate of time preference
0%
We remain sympathetic to the 0% pure rate, despite our counterarguments.
5. Catastrophic risks
+0.9%
Our estimate of 2.3% was non-resilient, however it’s our best estimate at this time
6. Uncertainty
-0.1%
We expect that the variance in the discount rate is significant enough to warrant a modest decline in the rate
Overall
+0.8%
We tentatively recommend a discount rate of 4%+0.8% = 4.8%; this depresses deworming cost effectiveness by c15%.
Readers may also be interested in our review of the elasticity of the marginal utility of consumption (Appendix 3) and our view that “temporal uncertainty” (i.e. catastrophe risk) is being applied inconsistently between outcomes (Appendix 4).
(1) Small changes in discount rate can cause material changes in cost-effectiveness numbers
GiveWell’s cost-effectiveness model is highly sensitive to the choice of discount rate for deworming charities, and still somewhat sensitive to the discount rate for other charities.
A 1% increase in discount rate (from 4% to 5%) is sufficient to reduce the cost-effectiveness of SCI by 18%, with similar reductions for other deworming charities
In this scenario, SCI’s cost effectiveness as a multiplier of cash goes from 13.5x to 11x, which is an 18% decline.
Table 2: Sensitivity analysis showing how cost-effectiveness changes when a 5% discount rate is used instead of a 4% discount rate.
Impact on Cost Eff as mult of cash*
Impact on Cost eff b4 lev/funging adj**
Impact on Units of value***
AMF
-4.8%
GiveDirectly
-2.3%
Deworm the World
-17.4%
END fund
-17.6%
SCI
-18.5%
Sightsavers
-18.1%
Malaria Consortium
-3.3%
Helen Keller
-0.1%
New Incentives
1.3%
-0.9%
* "Cost Eff as mult of cash" is short for "Cost effectiveness as a multiple of cash transfers". This is one of the main measures of cost-effectiveness used by GiveWell.
** "Cost eff b4 lev/funging adj" = Cost effectiveness before leverage/funging adjustment. It's needed because a quirk of the GiveWell model means the bottom line AMF cost-effectiveness figures can't be compared in this sort of sensitivity analysis
*** Units of value is used for GiveDirectly because the standard cost-effectiveness ratio uses GiveDirectly's impact as the denominator, so this will automatically be 1x anyway.
(2) Givewell's discount rate is lower than some other actors
GiveWell’s discount rate of 4% is a relatively modest discount rate compared to peers. For example, the World Bank uses discount rates of 10% to 12% and JPAL uses a discount rate of 10% per year. Similarly, a review of the Social Discount Rate for Cost-benefit analysis conducted by the Asian Development Bank observed that developing countries generally apply higher social discount rates (8–15%) than developed countries (3–7%).
It is not necessarily the case that GiveWell should change their discount rate just because peers are different, however it is useful to be aware of this difference. It appears that a material driver of the difference is the non-standard method of constructing the discount rate.
(3) GiveWell uses a non-standard method of constructing a discount rate
GiveWell’s approach to constructing the discount rate was to identify relevant considerations, assign a percentage for each, and then add them up. While having the merit of clarity and simplicity, this is a non-standard approach.
Table 3: How GiveWell constructed their discount rate
More standard approaches to setting a discount rate include the SRTP (Social Rate of Time Preference) approach and the SOC (Social Opportunity Cost) approach. More information about the SRTP and SOC approaches can be found in Chapter 10 of the book Cost-benefit Analysis by Boardman et al 2018.
An example of the SRTP approach is the Ramsey formula, which is widely used and well known.
Ramsey formula
Discount rate = δ + ηg
δ = pure rate of time preference
η = elasticity of marginal utility of consumption
g = growth rate of real consumption
According to GiveWell’s assumptions:
δ = 1.4%
η = 1.59
g = 3%
So if GiveWell used the Ramsey formula, they would choose a discount rate of
However GiveWell’s actual discount rate is only 4%, which is materially lower than the rate suggested by the Ramsey formula.
(3.1) How GiveWell arrived at 4%, compared to 6.2% from the Ramsey Formula
GiveWell’s discount rate of 4% was calculated as:
Improving circumstances over time + compounding non-monetary benefits + temporal uncertainty
= 1.7% + 0.9% + 1.4% = 4%
The Ramsey Formula, by contrast, uses
δ+g*η=1.4%+3%*1.59=1.4%+4.77%=6.2%
A key difference between these calculations is that the Ramsey formula simply takes g and η and multiplies them together.
GiveWell’s equivalent figure of 1.7% was calculated in this spreadsheet.
The calculations have a clear, intuitive logic to them:
GiveWell imagine a positive shock to consumption of a 10% increase, raising consumption from 500 units of currency to 550.
Their model uses a very standard utility model, known as the isoelastic utility function, to convert these values into utility.
This is done at time t=1 and t=2, and the model notes the increase in utility as a result of this positive shock at each point in time.
The model derives a 1.7% implied discount rate because the 10% shock causes an increase in utility at both t=1 and t=2, but that increase in utility is 1.7% lower at t=2. The increase in utility is a less big increase because:
the model assumes that consumption is 3% higher at t=2 (see the assumption of g=3% above)
The model assumes diminishing marginal returns on utility (indeed this is built into the structure of the isoelastic utility function, and is governed by the value of η)
The more common approach (the Ramsey model) would lead to 4.77%:
The Ramsey model is an equilibrium approach which assumes that an optimisation problem has already been solved
The derivation is fairly lengthy, and involves comparing the welfare-preserving rate of return on savings with the rate at which society is willing to swap consumption today with future consumption. (more details available on request)
At first glance, the fact that the Ramsey model assumes that an optimum has been achieved appears to be a weakness, especially in a low income country.
However, on balance, we think that GiveWell’s model does not appear as clear cut as its intuitiveness would suggest.
In this copy of GiveWell’s spreadsheet, we tried recreating the calculation, but instead of the positive shock to consumption being expressed in terms of %age increase in consumption, it was an absolute amount – 50 units of currency in each time period rather than a 10% increase in each time period.
This led to a substantially higher discount rate component of 4.4%, which is closer to the 4.77% which the Ramsey formula would have predicted.
Comparing absolute dollar amounts in different time periods is more consistent with how discounting typically works.
However in GiveWell models, it is more normal for increases in consumption to be expressed on logarithmic terms, which in fact lends itself more to the %age-based shock that GiveWell used in their model, rather than the absolute amounts that we included in our alternative model.
However it is questionable whether expressing the increase in consumption in logarithmic terms is really appropriate.
For GiveDirectly, the (positive) financial shock is clearly more naturally considered as an absolute dollar amount rather than a percentage increase.
For deworming, the mechanism of action is mysterious, however it seems reasonable to believe that the impact is proportional to the beneficiary’s existing earning power, hence the percentage approach may be more suitable in that context.
The choice of discount rates is significantly more consequential for deworming than it is for GiveDirectly, so you could argue that deworming related considerations should dominate.
Because of time constraints we stopped our investigations at this point, however we think that further work on this topic could explore:
A deeper exploration of other approaches to constructing a discount rate, including spending more time understanding why approaches such as the Ramsey Formula lead to such different outcomes; ideally this should conducted as an expert survey
Many economics derivations for a discount rate are based on a notional closed economy where the opportunity cost of capital relates to investments within the economy in question – donors to GiveWell recommended charities have investment opportunities that are likely not in the economy where the interventions are performed. What are the implications of this for the derivation of the discount rate?
If we were to select a view on this at this stage, we would likely side with GiveWell’s approach, given its intuitiveness, but believe that it is unwise to assume that this is correct without further research.
(4) GiveWell appear to have missed reasonable arguments in favour of a pure rate of time preference
We reviewed each of the three components (δ, η, and g), and we think that δ (pure time preference) deserves the most attention out of each of GiveWell’s assumptions.
g: we believe that a fairly broad range of answers is reasonable, and the answer which GiveWell selected is defensible
η: Appendix 3 discusses the elasticity of marginal utility of consumption and suggests that the GiveWell choice of 1.59 is reasonable
GiveWell has given relatively little thought to the question of pure time preference
GiveWell allows for zero pure time preference. The rationale is a negative one – objecting to the findings of revealed preference studies. We agree with this objection to beneficiary pure time preference. However we also note that, to the extent that GiveWell donors are within the effective altruism community, GiveWell donors are less likely to be longtermist, which skews the probabilities in favour of them having a positive pure time preference.
All that GiveWell has said on the topic of the pure rate of time preference in their 2020 document is captured in the below box:
Pure time preference (beneficiaries). People act in such a way that implies they would prefer spending now to later. We did not apply an additional adjustment for this factor. We believe the common use of self-commitment mechanisms such as savings accounts indicate that a preference for short term benefits is often an involuntary action (independently of reasons 1 and 2).
Pure time preference (donors). Donors may prefer to achieve benefits now rather than later independently of the relative benefit to the beneficiaries. We do not have this preference.
This is a very small amount of detail, and is in a document which starts with: “Note: This is a rougher stage internal document that has not undergone our formal vetting process.”
The 2018 document has slightly more detail, and includes the sentence “I have not heard a good philosophical argument that we should have a pure time preference, beyond an appeal to intuition.”
Good philosophical arguments in favour of a positive pure time preference do exist
While we are sympathetic to GiveWell’s conclusion, we do not believe there is a total absence of good philosophical arguments in favour of a pure time preference.
The strongest argument in favour is this paper by Andreas Mogensen, based on our currently incomplete review of this topic.
Further work on this topic should explore:
A material chunk of the money moved by GiveWell is through advice to Open Phil / Good Ventures, who employ worldview diversification – to what extent is the idea of a positive pure time preference suitable in that context.
Non-Open Phil donors in the EA community may skew somewhat towards being more neartermist; to what extent is that the case?
To the extent that EA-aligned GiveWell donors skew neartermist, is it suitable to reflect that in a positive pure time preference in the discount rate? Does this essentially boil down to the question: “if donors avoid funding longtermist interventions because they are sceptical about long theories of change with benefits many years in the future, should that scepticism be incorporated into the discount rate”?
Overall, we are sympathetic to the idea that an appropriate pure rate of time preference may well be zero, however we believe that GiveWell could fruitfully research the question further and may reach a different conclusion.
(5) GiveWell could consider catastrophic risks more thoughtfully
GiveWell’s discount rate includes 1.4% for “temporal uncertainty” which allows for catastrophes. This is based on a logic that if a severely catastrophic event occurs, the intervention’s work would be wasted if the benefits would have arisen after the catastrophe.
GiveWell determined their 1.4% figure relying heavily on subjective judgement
The 2020 document said: “James recommended a rate of 1.4% based on judgement on the annual likelihood of an unforeseen event or longer term change causing the expected benefits to not be realized.”
The 2018 document said: “I haven’t done any real work to try to quantify this. This is justified more by an intuitive feeling that there’s ~0.5% chance the world gets radically different each year in a way which would nullify the effects of deworming. (e.g. civilizational collapse, runaway climate change, human extinction, radically different labor markets).”
Further research could lead to a materially different number
The two GiveWell documents include two different judgement-based figures: 0.5% and 1.4%. Those two figures are already quite different from each other.
The Stern review assumed a 0.1% chance of extinction each year, and used this figure in their choice of discount rate.
A member of the SoGive team put together an alternative estimate of this number, which came to 2.3% (See appendix 2).
We think the exercise of determining the 2.3% figure is valuable for illustrating that the 1.4% figure could change non-trivially if more time were spent considering this figure. We are not arguing that we have high confidence in that number.
One more note on the topic of the temporal uncertainty component of the discount rate: arguably the “temporal uncertainty” component of the discount rate is being applied inconsistently between interventions. In order not to interrupt the flow of this document, this argument is expanded upon in Appendix 4.
(6) GiveWell should consider the amount of uncertainty in their discount rates and consider whether declining discount rate considerations apply
Imagine that there is uncertainty about the correct choice of discount rate. It turns out that this should lead to a somewhat lower, and declining discount rate.
Table 4: How uncertainty affects discount rates
Adjustment to discount rate
Applicability for GiveWell
Somewhat lower discount rate
This is often considered to be too modest an effect to be worth modelling over a time period of just a few decades. However if the variance/uncertainty is high enough, this might be worth incorporating. Arguably, given the uncertainties around the temporal uncertainty component (i.e. catastrophe/extinction events), a high variance in the discount rate is justified.
Allowing the discount rate to decline over time
This consideration likely won’t be material for GiveWell, since that typically only applies over longer time horizons (e.g. in an intergenerational context). Again, if the variance/uncertainty in the discount rate is large enough, it might be worth incorporating this.
6(a) Why uncertainty in the discount rate leads to lower discount rates
Imagine a simple model where you don’t know what the right discount rate is, but you know it’s either 3% or 5%.
If you take the present value of a future cash flow of €1000 under a 3% discount rate and calculate it again under a 5% discount rate, and then take the average, you’ll get a higher number than if you calculate it under a 4% discount rate.
A higher present value is consistent with a lower discount rate.
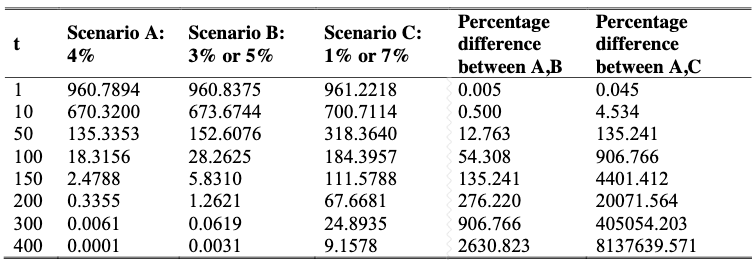
The fact that the present values are higher can be seen by comparing the Scenario B column of the below table with the Scenario A column, which comes from a paper on this topic.
Table 5: Present Value of a cash-flow of €1000 received after t years
Source: Gollier, Koundouri, Pantelidis (2008)
6(b) Why uncertainty in the discount rate leads to declining discount rates
Considering the same table (above) we see that the gap between the point discount rate (4%) and the expected present values widens.
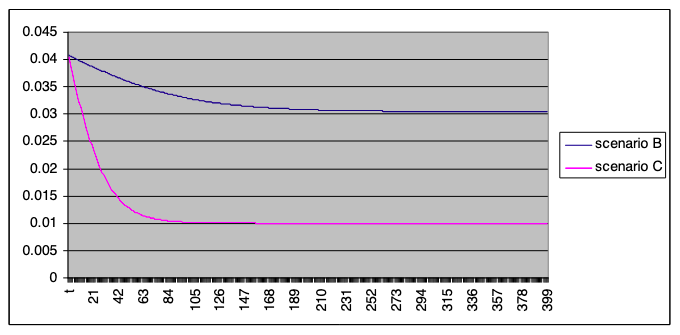
The extent to which that gap widens could be quantified by back-calculating the discount rate in the expected present value (i.e. the forward rate) and then charting that forward rate.
Gollier, Koundouri and Pantelidis have done this in their paper
The forward discount rates
Source: Gollier, Koundouri, Pantelidis (2008)
Arrow et al 2014 states that allowing for uncertainty/risk could lead to a precautionary effect: “that is, that uncertainty about the rate of growth in consumption reduces the discount rate, which causes the social planner to put more weight on the future”. They cite Pindyck and Wang 2013. We reviewed this paper quickly and didn’t find enough detail to justify why the reduction in discount rate makes sense in that context, and whether it carries over to the GiveWell context.
Our tentative view is that there is material uncertainty in the discount rate, especially with regard to catastrophic/extinction risks, and that this likely leads to a modest reduction in the discount rate over the time period relevant for GiveWell.
As noted above, a discount rate of 10%-12% is common. For illustration purposes, we set out here the impact of a 10% on the GiveWell cost-effectiveness model
Table 6: Impact of a 10% discount rate on cost-effectiveness measures
Cost Eff as mult of cash*
Cost eff b4 lev/funging adj**
Units of value***
AMF
-14.3%
GiveDirectly
-11.2%
Deworm the World
-63.6%
END fund
-64.7%
SCI
-67.8%
Sightsavers
-66.3%
Malaria Consortium
-8.7%
Helen Keller
3.4%
New Incentives
9.0%
-3.2%
* "Cost Eff as mult of cash" is short for "Cost effectiveness as a multiple of cash transfers". This is one of the main measures of cost-effectiveness used by GiveWell.
** "Cost eff b4 lev/funging adj" = Cost effectiveness before leverage/funging adjustment. It's needed because a quirk of the GiveWell model means the bottom line AMF cost-effectiveness figures can't be compared in this sort of sensitivity analysis
*** Units of value is used for GiveDirectly because the standard cost-effectiveness ratio uses GiveDirectly's impact as the denominator, so this will automatically be 1x anyway.
For example, the 67.8% decline in the cost effectiveness of the SCI Foundation is because the cost effectiveness multiplier declines from 13.5x cash to 4.3x cash.
Appendix 2: An alternative view on the probability of sufficiently catastrophic risks
This is a quick attempt at constructing an alternative view for what GiveWell calls temporal uncertainty.
The below model tentatively proposes an alternative figure of 2.3%, however as can be seen from the comments in the below table, this was based on a time-constrained review, and hence could be improved with further work.
The table sets out the work done by one member of the SoGive team, and is not necessarily representative of SoGive’s house view.
We believe that the value from the below exercise is not to suggest that 2.3% is, in some sense, the “right answer”. Rather this demonstrates it’s possible to come to conclusions which are materially different from the 1.4% figure employed by GiveWell.
A particular area which was handled crudely below was the “relevance probability”, meaning: given that an event in the reference class occurred (e.g. given that nuclear weapons were used) what’s the probability that this event actually had an impact on the thing being modelled (e.g. what’s the probability of it interrupting the theory of change for deworming).
Table 7:
Risk
Contribution to discount rate
Comments/sources
Nuclear weapons usage
0.5%
1.1% chance of a nuclear exchange per year (source: Rethink Priorities) ✖ relevance probability (i.e. probability that such an exchange would affect low income countries materially enough to undo the intervention being modelled). A relevance probability of 50% was chosen here, somewhat arbitrarily.
Other conflict/ severe geopolitical instability
0.5%
This was estimated very quickly. Given that there are currently more than 35 armed conflicts in Africa, it seems reasonable to assume the per annum risk of conflict or other severe geopolitical event is higher than 0.5%; this was then somewhat arbitrarily adjusted down to ensure that it focuses on events severe enough to interrupt/undo the intervention being modelled.
Pandemics
1%
This study from Duke University found the probability of a pandemic with similar impact to COVID-19 is about 2% in any year. I did not have time to review this study carefully.
The relevance probability was set as 50%, fairly arbitrarily.
AI risk
0.1%
This was derived by taking the estimate of 10% chance of an AI-related extinction event in the century (source: The Precipice, Toby Ord) and converting it to an annual figure.
Arguably this is too low, since it only covers extinction events, and an AI-related catastrophe which doesn’t lead to extinction could still be relevant.
Conversely, in some ways it’s too high, since it spreads the risk evenly across the coming century, however the probability of transformational AI in the next (say) 5 years is much lower than in (say) 20 years.
Other
0.2%
Figure chosen slightly arbitrarily
Total
2.3%
Because of time constraints, several components of this estimate were done quickly, and would likely be improved if assessed with more time available.
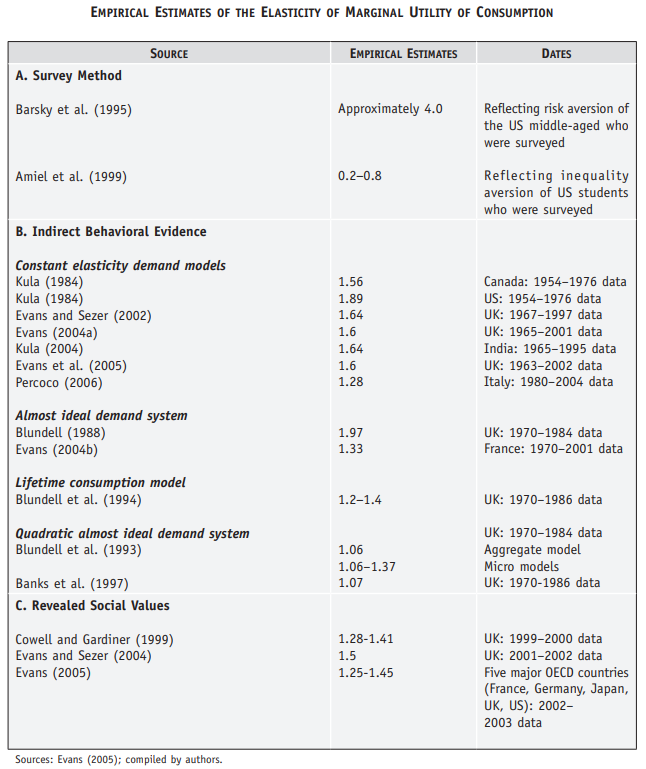
Appendix 3: Elasticity of marginal utility of consumption
This review of values of the elasticity of marginal utility of consumption suggests that GiveWell’s choice of 1.59 is not unreasonable.
Here are some further references for anyone interested in researching this area further:
Values for the elasticity of marginal utility of consumption between 1.25 and 2.5 finds few economists in wild disagreement. (source: Coursera course on Economics and policies of climate change (behind paywall))
There is also some discussion of the elasticity of marginal utility of consumption in this paper, especially around pages 131-2.
Cline proposes using a value of θ equal to 1.56 and then discounting using px measured at 1.5 percent for all CBAs, including greenhouse gas abatement projects. His estimate of θ uses rz 8.0 percent, assumes that all investments have 15-year lives, and that f = 0.2. See W. R. Cline, The Economics of Global Warming.
David J. Evans and Haluk Sezer, “Social Discount Rates for Six Major Countries.” Applied Economic Letters, 11(9), 2004, 557–560, and David J. Evans, “The Elasticity of Marginal Utility of Consumption: Estimates for 20 OECD Countries.” Fiscal Studies, 26(2), 2005, 197–224.
Appendix 4: The “temporal uncertainty” component of the discount rate is arguably being applied inconsistently between interventions
For deworming, a higher probability of extinction or civilisational collapse would lower the probability that beneficiaries benefit from higher income in later life.
This is reflected in GiveWell’s model
For lives saved outcomes, a higher probability of extinction or civilisational collapse would arguably lower the benefit that beneficiaries receive from having their life saved. This is based on the “extinction matters for someone whose life has been saved” claim: having your life saved and then humanity being wiped out in 5 years is less good than having your life saved and living a full, long life with no extinction event.
This is not reflected in GiveWell’s model.
We believe this could be modelled by
modelling the ages of beneficiaries (GiveWell already places beneficiaries into rough age buckets because of moral weights)
determining an expectation of life for each age category
applying the temporal uncertainty component of the discount rate for the expectation of life
We have not had the capacity to create a version of one of these models, but we would not be surprised if it were not material.


Thanks for your entry!