Joel McGuire[1], Samuel Dupret and Michael Plant
[Update 20 February 2023; Joel]: Alex Cohen from GiveWell responded to this post and argued that GiveWell would use a higher starting value than we did (details explained in the comments). I think this is a reasonable choice, and this makes the cost-effectiveness reduction less dramatic than we presented here (10-30% reduction instead of 60-70%).
Summary
At the Happier Lives Institute, we have been replicating GiveWell’s cost-effectiveness analysis of deworming. GiveWell’s model assumes that the economic benefits of deworming last for 40 years with no decline over time. We noticed that this assumption conflicts with the data from the main deworming study that GiveWell uses (Hamory et al., 2021). When we looked at the effects over time, we found that the economic benefits decay by around 12% each year. Taking this decay into account shrinks the total economic benefit by 60% compared to GiveWell’s model. This would reduce the cost-effectiveness of nearly all their recommended deworming charities below their 10x bar for funding. For more details about our calculations, the data used, the choice of the decay model, and its implications for the GiveWell deworming charities, see our external appendix.
We raised this issue with GiveWell[2]. They said that they are aware that the data suggests a decay over time, but they think their model is more appropriate; they noted that they haven’t explained and defended this choice publicly. In conversation, they gave two reasons for their approach. First, they have strong prior beliefs about the effects over time. Second, they have already applied a conservative discount to deworming.
In this post, we provide the context for our analysis and why we estimate a decay of economic benefits. We then attempt to reconstruct GiveWell’s reasons and explain why we find these reasons unconvincing. Finally, we provide four recommendations to improve the clarity and transparency of GiveWell’s cost-effectiveness analyses. These are to (1) publicly explain and defend their assumptions about the effect of deworming over time; (2) explain their cost-effectiveness analyses in writing; (3) illustrate the sensitivity of their results to key parameters; (4) make it clear when an estimate is subjective or evidence-based.
1. How we discovered the discrepancy between the data and GiveWell’s model
The Happier Lives Institute is searching for the most cost-effective ways to increase happiness. We have started this major project by assessing GiveWell’s top interventions and charities in terms of ‘subjective wellbeing’ (e.g. self-reported happiness and life satisfaction). So far, we have conducted cost-effective analyses (CEAs) of cash transfers and psychotherapy. Now, we are focusing our attention on understanding and replicating GiveWell’s CEA of deworming. Later this year, we will publish a report comparing deworming to cash transfers and psychotherapy in terms of its effects on subjective wellbeing. In this report, however, we are solely concerned with understanding the economic benefits of deworming.
Mass deworming is a large drug intervention targeting chronic parasitic infections such as schistosomiasis and soil-transmitted helminthiasis (GiveWell, 2018; WHO, 2006, 2011). These infections can cause a range of urinary, intestinal, nutritional, cognitive and developmental problems. The parasites are transmitted through soil and water because of a lack of proper sanitation. The drugs are cheap and unlikely to cause side effects so they are provided to individuals without testing for infection (which would otherwise be expensive; Hamory et al., 2021).
GiveWell has reviewed deworming multiple times (2016, 2017, 2018). Mass deworming is successful in reducing worm and infection levels, but GiveWell (2018) concluded that the main impact of deworming is the potential for preventing adverse effects on children’s development - and thereby long-term consequences - rather than the effects on preventing short-term health impacts or severe symptoms and death (both of which are rare). In their modelling, GiveWell represents this as long-term economic gains, i.e., the ‘good’ of deworming is an increase in income later in life.
According to GiveWell (2018), “Empirical evidence on this matter [long-term developmental impact from deworming] is very limited, resting primarily on one series of experiments stemming from Miguel and Kremer 2004”. That is a study of the Primary School Deworming Project (PSDP) using the Kenya Life Panel Survey (KLPS) (Miguel & Kremer, 2004) and its follow-ups (Baird et al., 2016; Hamory et al., 2021). There were four rounds of the KLPS data: KLPS 1, 2, 3, and 4. This research suggests that extra years of deworming treatment reduced worm infections and increased school attendance, hours worked, and income.
Except for some discounts and adjustments, GiveWell’s analysis of the long-term economic benefits of deworming is based on evidence from the KLPS. Economic outcomes were measured in KLPS 2, 3, and 4. GiveWell based their estimates on the early results provided to them before the publication of Hamory et al. (2021)[3]. This data shows a non-significant increase in earnings and consumption due to deworming. GiveWell focuses on the relative economic gains (the difference between the control and the treatment group), using the natural log of the gains. We show this data in Table 1.
Table 1: Economic effect of deworming across KLPS rounds[4]
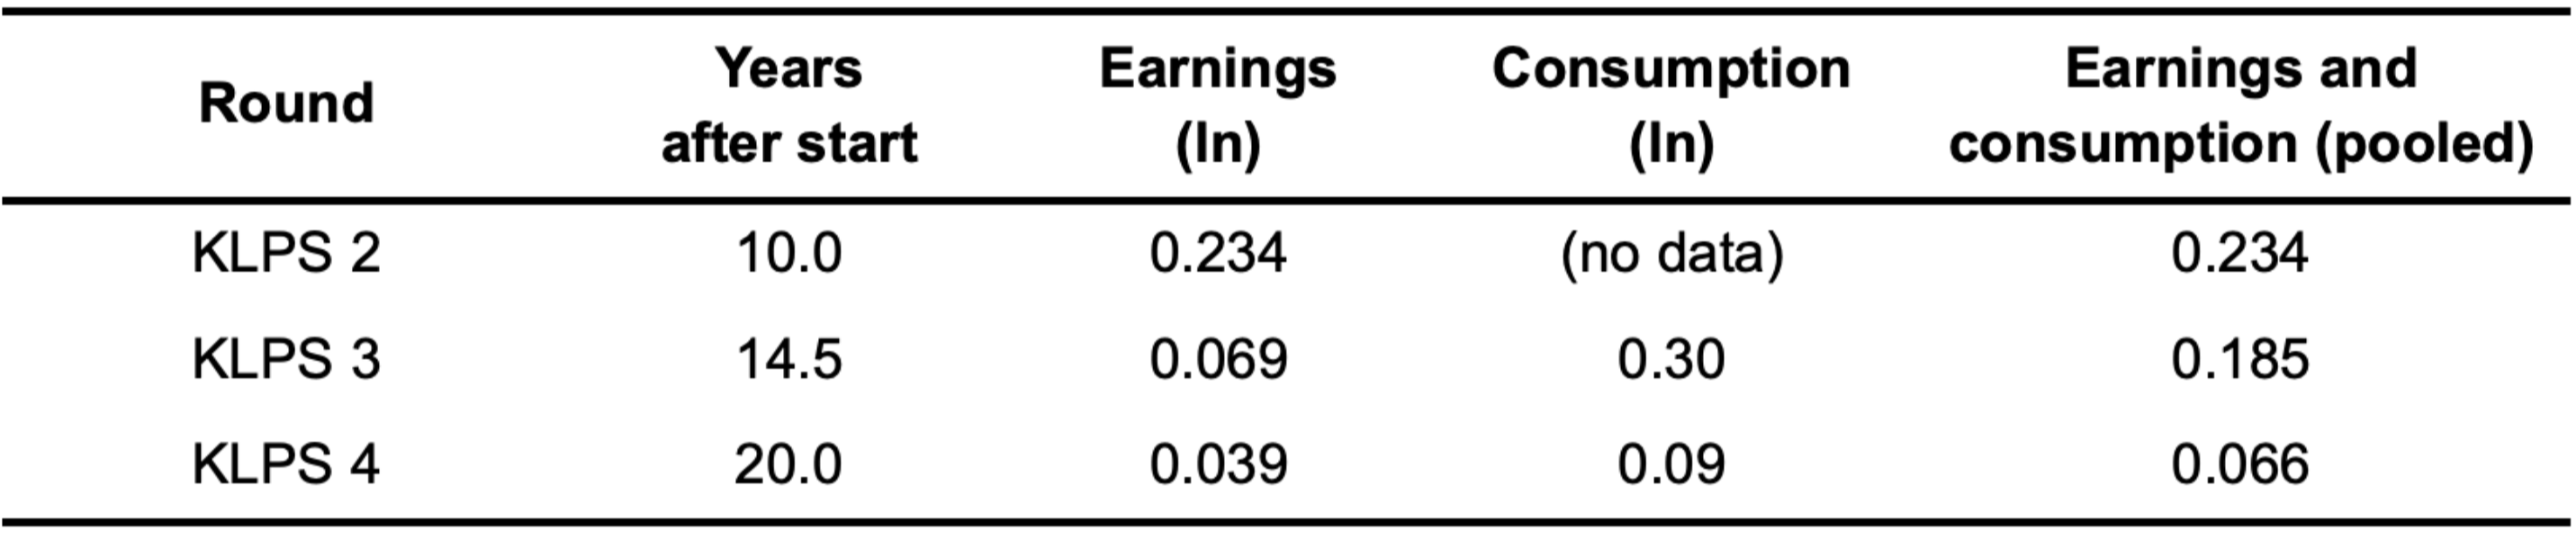
GiveWell averages different summary data points together in order to get one overall figure for the relative economic benefit of deworming. They then pool the earnings and consumption data together (which is why we show the pooled data in Table 1). Overall, they calculate that the relative economic benefit of deworming is 0.109 natural logs increase in income over the decade that spans the three follow-ups. This difference of logs approximates the percentage increase, so in other words, there is an 11.5% increase in economic outcomes on average across the ten years of follow-ups. You can see their calculation in this spreadsheet.
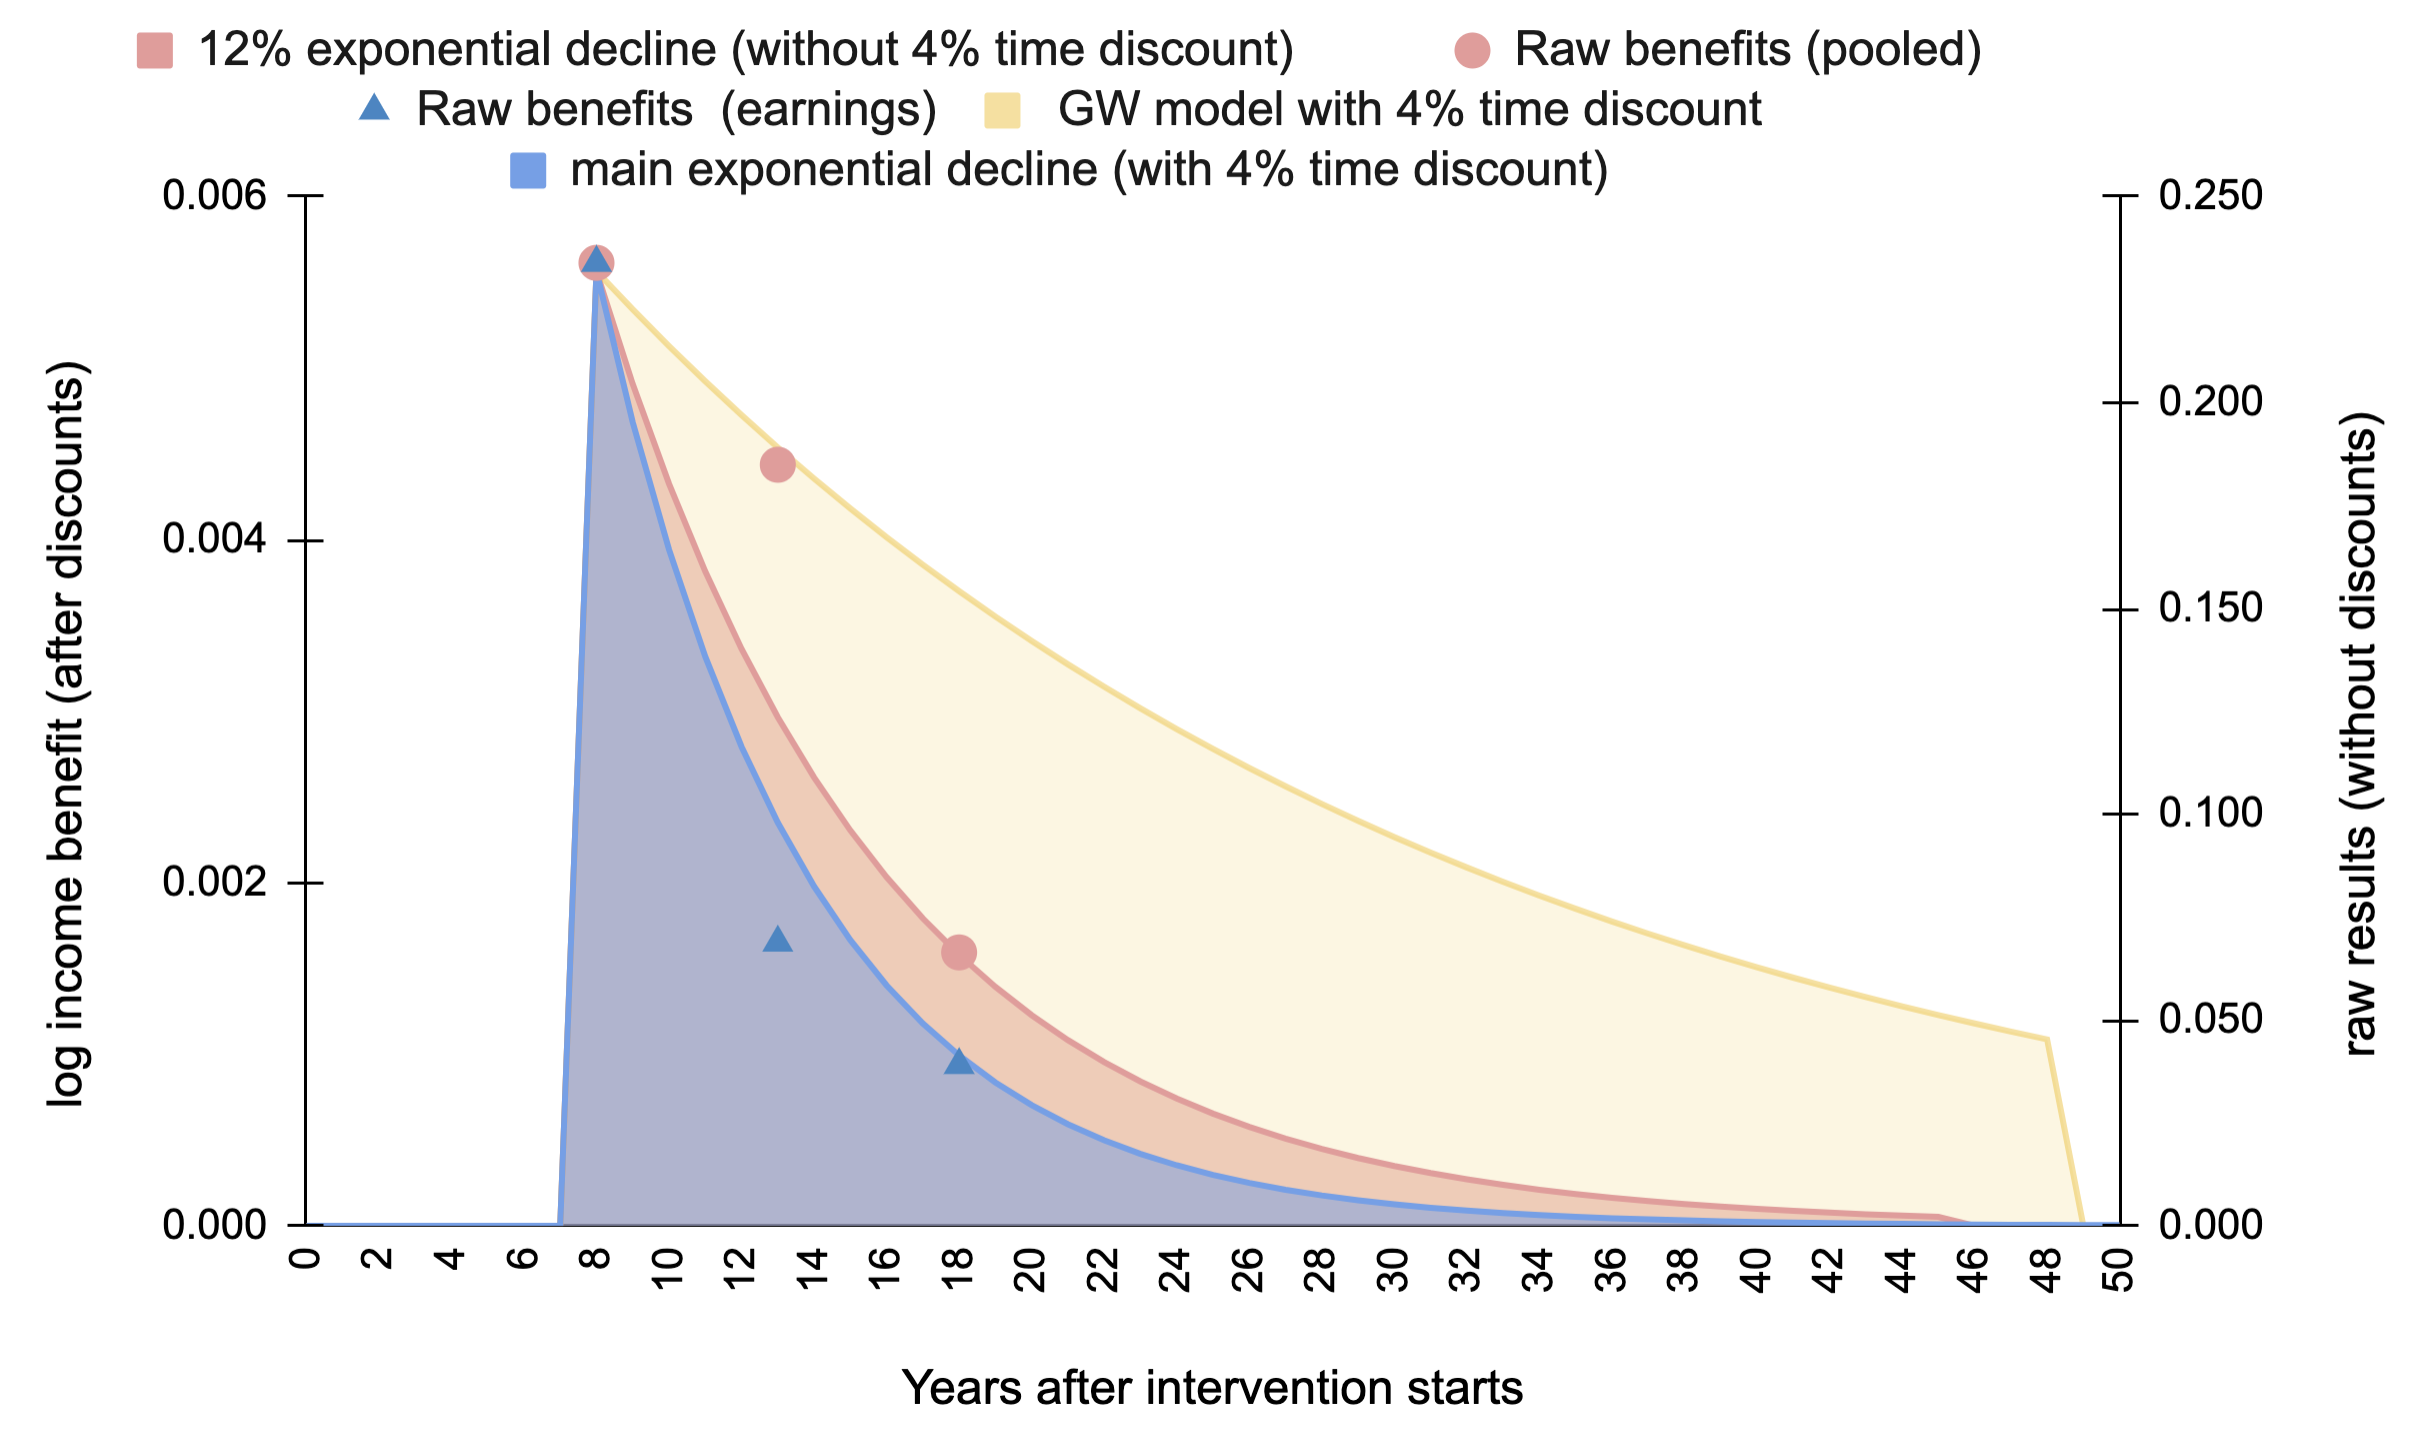
GiveWell models the relative economic gains of deworming as starting eight years after the intervention (recall, it’s schoolchildren who are dewormed - they won’t earn money until later) and having a constant effect for 40 years thereafter (i.e. the rest of the recipient’s working lives). However, the data above indicate that the effects decay. We calculate, using the pooled earnings and consumption figures, that the effect would exponentially decay with a rate of 88% (i.e., reduce by 12% each year). When we incorporate the decay over the 40 years suggested by GiveWell, the total effect reduces by 60%.
See Figure 1, which illustrates the difference between the models. The appearance of decay in GiveWell's model is due to the 4% time discount GiveWell incorporates in all their models. GiveWell includes a 4% time discount to account for circumstances improving over time (1.7%), so each additional benefit will be worth less in the future, temporal uncertainty (1.4%) stemming from radical changes to civilization such as catastrophe, and compounding non-monetary benefits (0.9%) such as reduced stress or improved nutrition. We also explain further in section 2.2 of our appendix.
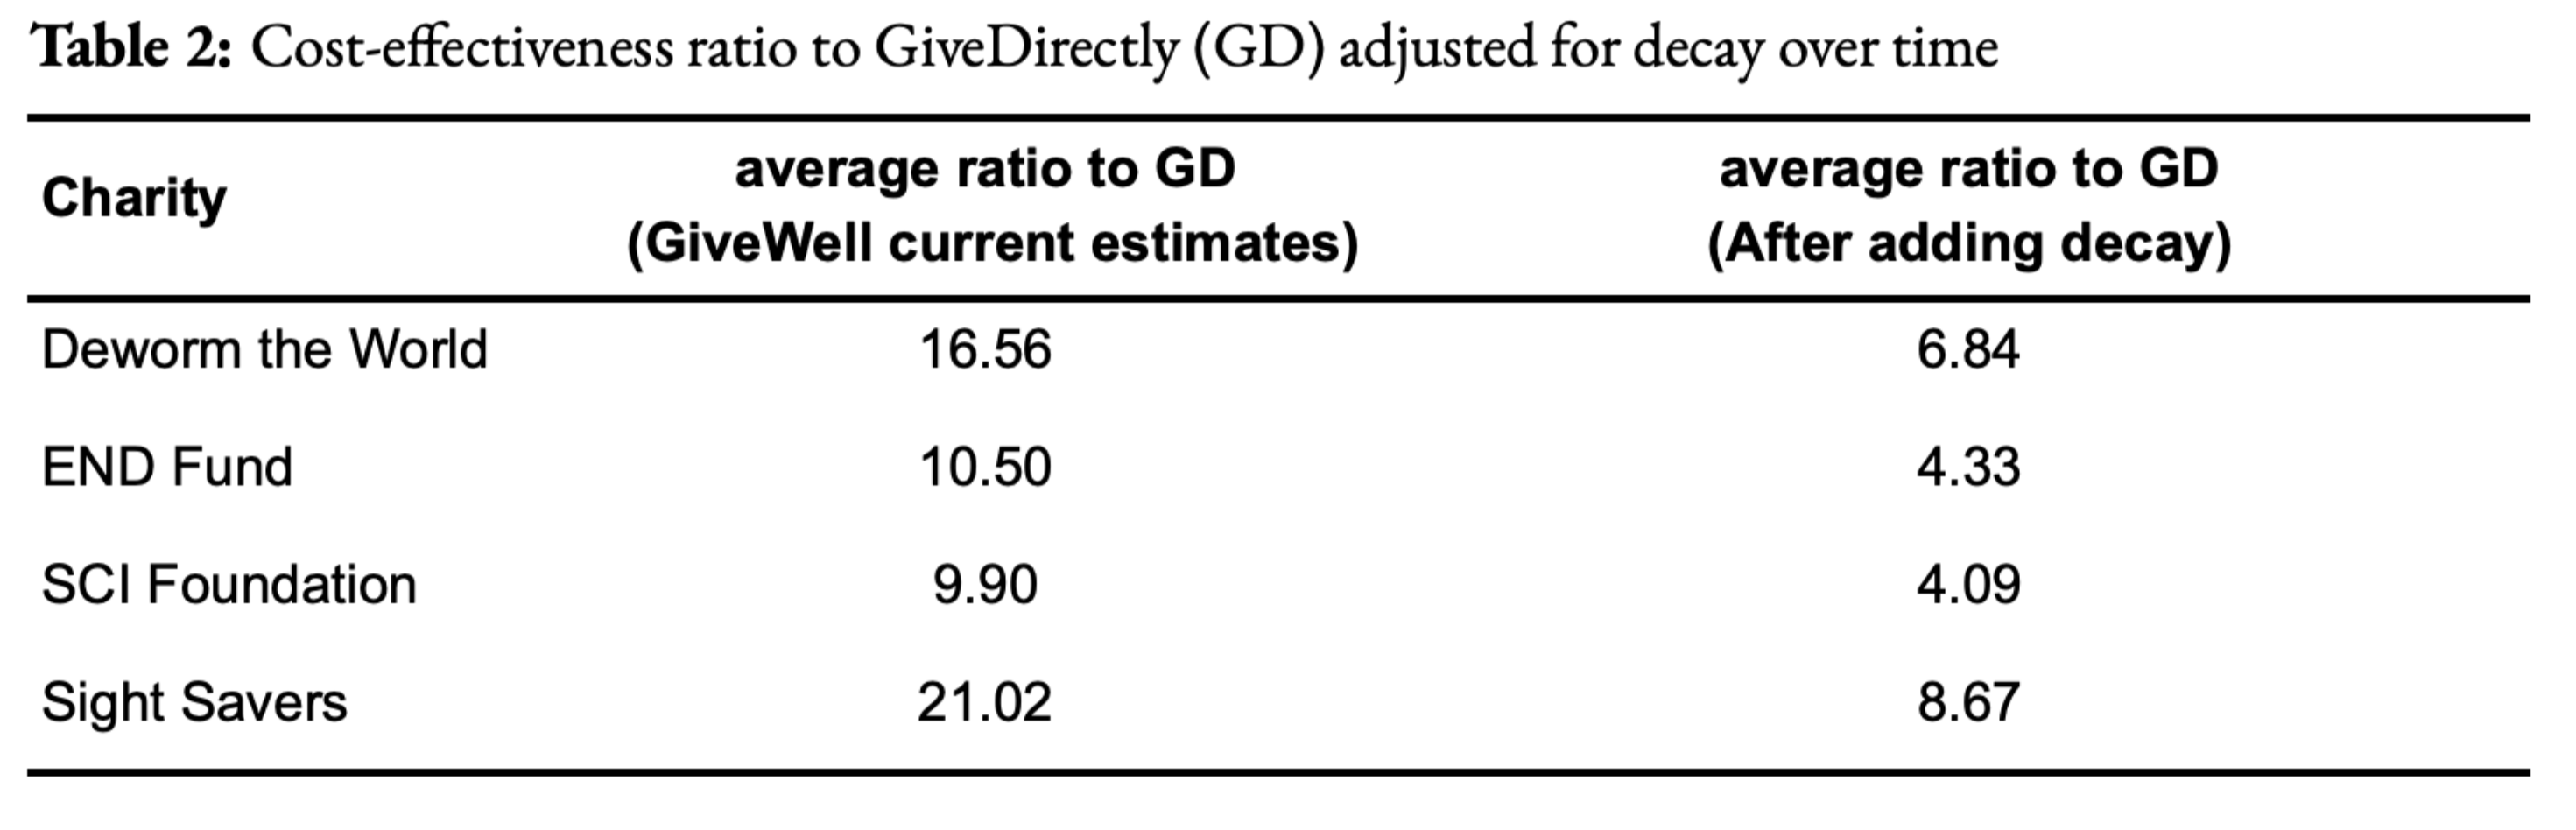
Incorporating the 12% decay would decrease many of GiveWell’s recommended deworming charities below their ‘bar’ of being 10 times more cost-effective than simply providing cash transfers to those in poverty, something the organisation GiveDirectly does. This is shown in Table 2 (this is Table 8 in the external appendix). Note, if we included GiveWell's 4% time discount for both the GiveWell and 12% decay model, this would reduce the total effects of deworming by a further 10% (see Table 7 in the appendix)[5].
Figure 1: Comparing decay models versus GiveWell's model with a 4% time discount
2. Why the difference? A discussion with GiveWell
We could not find anything on the GiveWell website which discussed the difference between what the data indicated about the long-run effects and how GiveWell modelled them in their cost-effectiveness analysis. Because the difference is very substantial, we assumed that GiveWell would have mentioned it if they knew about it and, therefore, either they didn’t know about it, or we had misread the study.
When we contacted GiveWell to discuss this, they said they were aware that the study data indicated a decay over time and did not disagree with our calculations. As a result, we don’t explain the calculation in greater depth here (for details see our external appendix). However, they believe the decay we calculated in the data would not change their overall conclusion about the size of the effect. They provided two main reasons for this choice in the call and noted they had not made these public. We’ve tried to faithfully and charitably reconstruct GiveWell’s explanations below[6]. We found the reasons unpersuasive, and we will explain why.
Update 15/08/2022: When we published this summary we were operating on the understanding of GiveWell’s views that we had formulated from their write-ups, research, and our discussions with members of GiveWell’s research team. We are grateful for their public statements below, which clarify and update their view
2.1 GiveWell’s prior beliefs about the trajectory of the benefits over time
GiveWell said they had a strong prior belief that deworming has a constant effect over time. Their hypothesis is that deworming improves cognition and educational outcomes, and that enables the recipients to earn more for the rest of their lives. They also explained that they consider the evidence for the trajectory of the benefits over time to be weak and therefore stick to their prior belief.
Why is the study only weak evidence? GiveWell noted that the estimates for the economic benefits of deworming are very uncertain. The confidence intervals around the data points are large and get larger with time. Hence, the relationship over time is also uncertain and the difference over time is unlikely to be statistically significant. We note, however, that the treatment effect in general (the difference between the control and treatment groups) is not statistically significant either.
GiveWell thinks that the consumption data from KLPS3 is lower quality than the data from KLPS4. Plus, in KLPS2, some participants were still in school whilst others were working, making the economic benefits of deworming at that point in time uncertain. Hence, GiveWell suggested that if one focuses on the findings between KLPS3 and KLPS4 for earnings, there would be less decay. If we use only the figures from the earnings (not pooled with consumption) in KLPS3 and KLPS4, we do find a weaker decay than with the whole data but only a bit weaker (a decay of 90% instead of 88%, which reduces the total effect by 50% instead of 60%).
In light of this, GiveWell thinks it is more appropriate to rely on their priors rather than the evidence from the KLPS data[7]. In other words, GiveWell is saying, “we know the study suggests a decay but we think there are good reasons to discount it and believe something else”.
We find this response unconvincing. We do not understand the justification for having such strong beliefs about the long-run effect of deworming: it entirely discounts the KLPS data, which is the only data for long-run economic benefits. To be clear, it’s not that we have a strong view that the effects would decay over time. Rather, we don’t have a strong view either way and therefore are prepared to be led by the evidence. Our past research (on cash transfers and psychotherapy) has shown that effects decay over time, so that strikes us as the norm, rather than the exception. It seems plausible to us that the effects of deworming would reduce over time: children who are dewormed may do better in school than those who are not, but, as the data suggests, the other children could still ‘catch-up’ on that difference over the rest of their lives. Note, GiveWell specifies that the economic benefits are relative to a comparison. This means that if the comparison group is getting richer, the absolute benefits need to increase for the relative economic benefits to stay constant. We could be convinced that deworming has a constant lifetime benefit, but GiveWell has not argued for this publicly or provided sufficient evidence in support of that claim. We encourage them to do both.
2.2 GiveWell’s general beliefs about the effect of deworming
The other reason GiveWell gave is that they already apply a very large ‘replicability’ adjustment to the effect obtained from the KLPS data. They discount the effect of the treatment observed in the data by 87%. GiveWell’s general point is that even when you discount the effect suggested by the KLPS data, deworming still looks promising (see, for example, this post).
Our initial understanding was that this adjustment was based on uncertainty about specific aspects of the study (e.g., there are no replications of it, it is only one study, it does not have a ‘true’ control group, and the mechanisms are unclear) and that GiveWell tried to adjust for these factors. However, after our conversation, it seems that this replicability adjustment is more general and aims to adjust the effect from the data so that it reaches an effect size GiveWell considers ‘plausible’. Decisions about the size of the adjustment are based on a combination of subjective and empirical approaches (see here and here for details). Note that these are linked-to-documents, not front and centre in explaining the CEA.
Our understanding of GiveWell’s approach is that any uncertainty about analysis elements based on the KLPS data which would make for smaller effects - such as decay over time - is already included in this replicability adjustment. If they were to explicitly incorporate the decay in their CEA, they would modify the replicability adjustment so that the effect still reaches what GiveWell considers to be ‘plausible’.
With the 87% adjustment, GiveWell calculates a total relative economic benefit of 0.115 natural logs. Without the adjustment, the effect would be 0.115 / 0.13 = 0.885 natural logs, which GiveWell considers to be implausibly large, hence the replicability adjustment. Even if we reduced it by 60% (as the exponential decay suggests), 0.885*0.40 = 0.354 is still larger than the total effect GiveWell uses. Only when we combine the 87% replicability reduction (which, remember, we had no reason to think included the trajectory of the benefits over time) with the 60% of the decay that we get 0.047, which is smaller than 0.115 (and why the charities would no longer pass the 10x bar – as we explain in the appendix).
It seems GiveWell is saying something like: “to be conservative, we have already applied a very substantial non-specific reduction of the effects of this intervention in our model. We don’t need to adjust it further if we identify a specific reduction - we’ve already ‘budgeted’ for that in the non-specific reduction”.
We do not understand this reasoning as it stands. It’s possible that we’ve misunderstood it and so we encourage GiveWell to clarify and explain their thinking publicly.
Why do we find this reasoning suspect? The aim of cost-effectiveness analysis is, presumably, to accurately estimate cost-effectiveness; it’s not clear why you would apply an adjustment that is larger or smaller than what is justified by your available evidence. It is difficult to understand at present what the available evidence is that is being referred to.
The more puzzling concept is the idea that, if you realise you should change one bit of your analysis, you would be justified to arbitrarily alter another, unrelated and non-specified, part of it to ensure you retain a ‘plausible result’. Of course, if we have some idea of what the answer is, and our calculations fail a ‘sanity check’, we need to double-check our calculations. If you learn one of those calculations is wrong, then you should change that one. But you shouldn’t change something solely to pass the sanity check.
Finally, if you conduct an evidence-based analysis, but you look at the available data and end up saying “those figures can’t be right - let’s change them by a factor of eight”, it raises the question: what’s the point of doing or sharing the analysis at all? If your prior beliefs, rather than the data, are doing (nearly) all the work of your overall conclusions, then it seems appropriate to communicate that clearly and explain your reasoning for those beliefs.
3. Recommendations
Here, we make several recommendations for how GiveWell could improve their analysis and their communication of it. GiveWell publishes a large amount of important, decision-relevant work, so it is crucial that people are able to understand, critique, and develop it.
First, GiveWell should publicly explain and defend their assumptions about the effect of deworming over time. As we argued above, this assumption has not been made public, the reasons given for it (in conversation) are unconvincing, and it makes a substantial difference, reducing the effect by 60%.
Second, we think that GiveWell should explain their CEAs for various interventions in writing. GiveWell’s reports are primarily a discussion of the evidence. Their CEAs are communicated by their (famous) spreadsheets, but these are hard to follow unless you already know what’s going on. Spreadsheets are good for showing what you’ve done, but not why you’ve done it. For the latter, you need an accompanying explanation. We think our CEAs of cash transfers and psychotherapy do a good job of communicating how we reach our conclusions.
Third, we’d like GiveWell to discuss how sensitive their results are to changes in various parameters. For instance, it would be interesting to see how the cost-effectiveness of deworming would change with and without important parameters such as the replicability adjustment, decay of effects over time, other adjustments and discounts, etc. This could be fixed by running and communicating robustness checks (these are standard practice in academia, although we recognise that is not GiveWell’s audience). Again, we think we make a decent first attempt in our report on household spillovers (McGuire et al., 2022; Section 5), although more can probably be done.
Fourth, we hope to see greater clarity on which inputs are subjective and which are objective[8]. We’d like to see the results from studies presented separately from the prior belief of the analysts. If there is a clear prior for an effect, it should be explicitly mentioned and incorporated, instead of referenced in a linked document. In the case of deworming, GiveWell could clearly state, based on their reading of the literature, what they believe is the ‘true effect’ of deworming and explain how much it is influenced by the KLPS data. This wasn’t obvious to us, and we assume it isn’t to other people either.
By separating facts from opinions, different stakeholders can understand how the results would differ depending on their own prior beliefs. Relatedly, a version of the analysis with the upper and lower bounds of their subjective inputs could also be done. This would allow donors and researchers to assess how much GiveWell’s beliefs impact the final conclusions and understand where to input their own beliefs, if they differ.
In broad terms, we think that GiveWell’s reports should align more closely with academic norms where authors are expected to fully explain their data, methods, and analysis, as well as the factors that their conclusions are sensitive to. The amount of further research that builds on GiveWell’s methods is less than it could be. We think that GiveWell’s methods are, in many places, an improvement over the status quo in economics and it is a loss that there is not more takeup of their approach. An incremental move to more academic norms may help with this.
- ^
Sam and Joel did the initial review of GiveWell’s deworming research, spoke with GiveWell, and wrote the initial draft. Michael contributed to the reasoning, and the structure and wrote the final draft.
- ^
We presented our calculations and spoke with a GiveWell staff member. We also notified them that we were planning to publish some notes about our conversation.
- ^
The numbers in the early data provided to GiveWell are not the exact same as the numbers in Hamory et al.’s (2021) publication, see their supplementary information (p. 5). However, this is only a very minor change and does not affect our points about the effects of deworming over time. In this document and the appendix, we maintain the use of the preliminary numbers because they are what GiveWell uses and we are trying to exactly replicate every part of GiveWell’s analysis except how it treats the effects through time.
- ^
Note that there is no consumption data for KLPS2 because there was no detailed consumption survey provided to the respondents (Hamory et al., 2021). So when getting a pooled value for KLPS2, one can only take the value for earnings.
- ^
If we compared a 12% decay rate to a model with 0% decay and no time discount the decrease in effects would be more substantial at 80%.
- ^
We find it uncomfortable to state someone else’s views and then object to them. If we had noted the discrepancy in interpretation but not given GiveWell’s (private) reasons, we imagine we would be accused of being uncharitable. However, to state someone else's view leaves us open to the charge we are misrepresenting them. If we have done so, we will happily correct it. It is for these reasons we strongly encourage GiveWell to make their views public.
- ^
We speculate that GiveWell’s priors are based on studies like those they mention in this document that illustrate that interventions that seem to improve children’s developmental trajectories lead to higher incomes later in life.
- ^
Note, an input can be subjective without being related to morality - a guess of how many sweets are in the jar is subjective, even though it’s about a matter of fact.
This is Alex Cohen, GiveWell senior researcher, responding from GiveWell's EA Forum account.
Joel, Samuel and Michael — Thank you for the deep engagement on our deworming cost-effectiveness analysis.
We really appreciate you prodding us to think more about how to deal with any decay in benefits in our model, since it has the potential to meaningfully impact our funding recommendations.
We agree with HLI that there is some evidence for benefits of deworming declining over time and that this is an issue we haven’t given enough weight to in our analysis.
We’re extremely grateful to HLI for bringing this to our attention and think it will allow us to make better decisions on recommending funding to deworming going forward.
We would like to encourage more of this type of engagement with our research. We’re planning to announce prizes for criticism of our work in the future. When we do, we plan to give a retroactive prize to HLI.
We’re planning to do additional work to incorporate this feedback into an updated deworming cost-effectiveness estimate. In the meantime, we wanted to share our initial thoughts. At a high level:
Should we adjust the effect of deworming down to account for decay in benefits?
We agree with HLI that there is some evidence in the Kenya Life Panel Survey (KLPS) data for benefits declining over time. We haven't explicitly made an adjustment in the cost-effectiveness analysis for the possibility that the effects decline over time.
Where I think we disagree is on how to incorporate that potential decay in benefits in our model. While incorporating decay into our model will most likely reduce cost-effectiveness overall, my guess is that HLI’s approach overstates the decline in cost-effectiveness from incorporating decay for three reasons. We plan to explore these further in our updated cost-effectiveness estimate for deworming, but I’ll summarize them quickly here.
First, if we were to model decay based on the KLPS data, we would likely use a higher starting point. We think HLI may have made an error in interpreting the data here.
Second, we guess that we would not put full weight on the decay model, since it seems like there’s a decent chance the observed decline is due to chance or lack of robustness to different specifications of the effects over time.
The three rounds of KLPS data provide three estimates for the effect of deworming at 10-, 15- and 20-year follow-up, which seem to show a decline in effect (based on percentage increase in income and consumption) over time. We could interpret this as either a decline in effect over time, as recommended by HLI, or as three noisy estimates of a constant effect over time, which is the interpretation in our current cost-effectiveness analysis. We’re unsure how much credence to put on each of these interpretations going forward, but it’s unlikely that we will decide to put all of our credence on “decline in effect over time.”
When we look at evidence like this, we typically favor pooled results when there is no a priori reason to believe effects differ over time, across geography, etc. (e.g., a meta-analysis of RCTs for a malaria prevention program) because this increases the precision and robustness of the effect measurement. In cases where there’s more reason to believe the effects vary across time or geography, we’re more likely to focus on “sub-group” results, rather than pooled effects. We acknowledge this is often a subjective assessment.
In the deworming case, there are some reasons to put weight on the decay story. First, the point estimates we have from KLPS 2, KLPS 3, and KLPS 4, in terms of impact on ln income and consumption, tend toward a decline over time. Second, there are plausible stories for why effects would decline. For example, it’s possible individuals in the control group are catching up to individuals who were dewormed due to broader trends in the economy. This is speculative, however, and we haven’t looked into drivers of changes over time.
However, we also think there are reasons to put weight on the “noisy effects” story, which is why our current cost-effectiveness analysis uses a pooled estimate as our best guess of effects over time. First, the evidence for decline comes from three imprecise estimates of income and two imprecise estimates from consumption with overlapping confidence intervals. And comparing effect sizes across rounds and measures is not straightforward – for example, the small sample KLPS 3 consumption results implied at least a doubling of deworming's cost-effectiveness relative to GiveWell's historical model if taken literally (in part due to idiosyncrasies about effects being measured at the per-capita level in a household, rather than merely for a single individual who was dewormed), which is why we funded a larger consumption survey in KLPS-4 and expected to see a much smaller effect in a larger sample.[1] Factors like this give us reason to believe that some of the observed decline in particular measures is due to chance or measurement error. In this case, we would expect the average pooled effect factoring in multiple types of measures to be the best predictor of what we’ll find in future KLPS rounds. Second, it seems plausible that effects would be constant over time (or could even compound over time). For example, adults who were dewormed as children and see greater cognitive or educational gains may be less likely to enter sectors like agriculture, which may have flatter earnings trajectories, or be more likely to move to cities, where opportunities for wage growth are higher. However, these stories are also speculative.
As a result, even if we did incorporate the decay model, we would put less than 100% weight on it. We’d like to look further into studies of interventions where the mechanism (improving child development) is more plausibly similar to deworming to see if this provides additional information, as well as any evidence of mechanisms for deworming specifically that would point toward decline in effects. We'd also like to further explore how to interpret the round-by-round estimates, since many factors change between rounds (such as rates of labor force participation and methods of earnings measurement) and we would like to better understand how to predict future changes in control group standards of living when taking all of this into account.
Third, we would likely update our “replicability adjustment” for deworming, based on these results.
This is noted in the blog post. HLI notes, though, "The more puzzling concept is the idea that, if you realise you should change one bit of your analysis, you would be justified to arbitrarily alter another, unrelated and non-specified, part of it to ensure you retain a ‘plausible result’."
Our approach to the replicability adjustment is to do an informal Bayesian update. We have a prior that is more skeptical of the impact of deworming than seen in the data from KLPS. We incorporate that prior into our estimate of the effect size through the replicability adjustment. The larger the effect size estimated by the KLPS data, the greater the gap between that result and our prior, and the larger the adjustment needed to incorporate our prior.[2] As a result of this adjustment, we input a smaller effect of ln income in our cost-effectiveness analysis than we would if we took the data from KLPS at face value.
In our current cost-effectiveness analysis, we adjust the pooled effect of 0.109 in ln income downward by 87%. This reflects our prior belief that we should expect a much lower effect of deworming on later-life income. If we thought the pooled effect was lower than 0.109, we would likely apply a less strict adjustment. We would plan to specify how we update our adjustment in our follow-up work on this.
Our current best guess is that incorporating decay into our cost-effectiveness estimates would reduce the cost-effectiveness of deworming charities by 10%-30%. This adjustment would have led to $2-$8 million less out of $55 million total to deworming since late 2019 (when the most recent deworming study results were released).
We plan to do some additional research to refine our estimates and share an updated cost-effectiveness analysis soon.
Where we’d like to improve on reasoning transparency
We also agree with HLI that we have room for improvement on explaining our cost-effectiveness models. The decision about how to model whether benefits decline is an example of that—the reasoning I outlined above isn't on our website. We only wrote, "the KLPS 4 results are smaller in magnitude (on a percentage increase basis) and higher variance than earlier survey rounds."
We plan to update our website to make it clearer what key judgment calls are driving our cost-effectiveness estimates, why we’ve chosen specific parameters or made key assumptions, and how we’ve prioritized research questions that could potentially change our bottom line.
Encouraging more feedback on our research
We’re extremely grateful to HLI for taking the time to dig into our work and provide feedback. We think this type of engagement improves the quality of our research and our grant recommendations, which helps us allocate resources more cost-effectively, and we’d like to encourage more of it.
In the near future, we plan to announce prizes to individuals and organizations who identify issues in our cost-effectiveness analyses that are likely to lead to meaningful changes in our decisions.
As part of that contest, we also plan to retroactively recommend a prize to HLI (details TBD). We believe HLI’s feedback is likely to change some of our funding recommendations, at least marginally, and perhaps more importantly improve our decision-making across multiple interventions.
See the "internal forecasts" we published, which roughly predict a 25% chance of large consumption results (similar to KLPS-3) that would have doubled our estimate of deworming's cost-effectiveness. (Put differently, we predicted a 75% chance of not updating to the KLPS-3-like magnitude of results after seeing KLPS-4's larger survey.) ↩︎
To see how the math on this works, see this tool, which we used in generating our replicability adjustments. If you input a prior with mean = 0.5 and standard deviation = 0.25, and see evidence with mean = 10 and standard deviation = 1, the posterior effect estimate is ~1.1, for a "replicability adjustment" relative to the evidence of 1.1/10 = ~11%. However, if the evidence shows a smaller effect closer to the prior (mean = 5, sd = 1), the estimated posterior effect is ~0.8, with a replicability adjustment of 0.8/5 = ~16%. So, the overall estimated posterior effect falls when the evidence shows a lower effect estimate (from ~1.1 to ~0.8), but the skeptical Bayesian "replicability adjustment" is slightly less extreme in the second case (an 84% discount instead of an 89% discount). This is what we mean when we say that the replicability adjustment must be updated in conjunction with the estimated effect size, and this is what we have done historically. ↩︎
We'd like to express our sincere thanks to GiveWell for providing such a detailed and generous response. We are delighted that our work may lead to substantive changes, and echoing GiveWell, we encourage others to critique HLI's work with the same level of rigour.
In response to the substantive points raised by Alex:
Using a different starting value: Our post does not present a strong argument for how exactly to include the decay. Instead, we aimed to do the closest 'apples-to-apples' comparison possible using the same values that GiveWell uses in their original analysis. Our main point was that including decay makes a difference, and we are encouraged to see that GiveWell will consider incorporating this into their analysis.
We don't have a strong view of the best way to incorporate decay in the CEA. However, we intend to develop and defend our views about how the benefits change over time as we finalise our analysis of deworming in terms of subjective wellbeing.
How to weigh the decay model: We agree with Alex's proposal to put some weight on the effects being constant. Again, we haven't formed a strong view on how to do this yet and recognise the challenges that GiveWell faces in doing so. We look forward to seeing more of GiveWell's thinking on this.
Improving reasoning transparency: We strongly support the plans quoted below and look forward to reading future publications that clearly lay out the importance of key judgements and assumptions.
In retrospect, I think my reply didn't do enough to acknowledge that A. using a different starting value seems reasonable and B. this would lead to a much smaller change in cost-effectiveness foor deworming. While very belated, I'm updating the post to note this for posterity.
Hi, Joel, Sam, and Michael -
We really appreciate this type of thoughtful engagement. We find a lot of value in hearing well-reasoned critiques of our research and weaknesses in our communication: thank you for sharing this!
Facilitating feedback like this is a big part of why we hold transparency as one of our values. You're right that it shouldn't be as difficult as it is to understand why we made the decisions we did in our model and how our deworming estimates rely on priors and evidence. Our deworming cost-effectiveness analysis (and frankly other models as well) falls short of our transparency goals–this is a known shortfall in how we communicate about our research, and we are working on improving this.
We want to take the time to more deeply consider the points raised in this post, and do plan on sharing more thinking about our approach. Thanks again for your critical engagement with our research.
Nice to see a rare substantive post in the sea of meta ;)
This is a serious transparency issue
Weighting a strong prior over evidence is a serious decision that GiveWell absolutely should have justified in public documents. I actually think that is a really important point to highlight above and beyond the specifics of this particular CEA. Grantmakers like GiveWell enjoy a really large influence over EA giving and activities, and without strong transparency norms over how they make their decisions, we risk human error amplifying into very large misallocations of resources.
The only reason I could imagine not to share this justification is because it would increase researcher burden from an already-extensive CEA. In the tradeoff between researcher burden and transparency, I think there's a pretty high bar to prioritize researcher burden, and this does not seem like it meets that bar. I would strongly support GiveWell publishing this justification and making it a norm for all future CEAs to justify exclusion of evidence in a model.
Use prior distributions to shrink estimates, not non-specific discount factors
CEAs commonly use Bayesian hierarchical modelling to estimate true treatment effects from a small number of studies. To get these estimates requires plugging in a prior. If GiveWell thinks that 0.885 log units is unreasonable and 0.113 is more reasonable, then they should formalize that upfront in a prior distribution over the true treatment effect.
Yes, you can still tinker with a prior ex-post so it doesn't solve the issue completely. Yes, a shrinking of the estimate is technically equivalent to applying a prior distribution that places low weight on 0.885 and higher weights on lower values. That doesn't mean these are practically equivalent procedures. It's much easier for motivated reasoning to slip into ex-post adjustments. Moreover, ex-post adjustments are impossible to interpret except in how they change the final estimate, whereas people can interpret priors before the analysis is done and debate whether they are reasonable. So I don't think non-specific discounting of estimates is a good practice.
However, I think your claim that discounting should only be based on specific factors is too strong. Any reasonable prior over the true treatment effect is discounting some treatment estimates just because of their "unreasonable" magnitude. CEAs aren't mechanical and shouldn't be treated as such in the name of following the evidence.
Both your calculations and GiveWell's should count consumption benefits over the lifetime, not 40 years
40 years may be the working lives of the subjects, but benefits accrued while working will almost certainly increase consumption beyond working age. First, savings accumulated while working will be consumed after retirement. Moreover, higher income while working likely leads children to earn more and thus support their parents better. So consumption benefits in the working life are likely substantially understate the real consumption benefits of any treatment.
I would understand ignoring or substantially discounting consumption benefits to the future children of deworming recipients because of decay - but consumption benefits should still be counted over people's whole lifetime, say 55 years. I could not find a spreadsheet with your calculations to plug a longer time horizon in, but I would be very curious to see how your results change with a longer window of effects.
On non-specific discount factors: one approach which I was interested in when doing a lot of this work was to use estimates we have of how much effect sizes shrink when more and/or larger studies are conducted.
For example, in this paper Eva Vivalt, using a sample of impact evaluations, regresses effect size on variables like number of studies and sample size. As one would expect, the larger the sample size, the smaller the estimated effect size. I always wondered if you could just use the regression coefficients she presents to estimate how much an effect size would be expected to shrink if one conducted a larger study.
I don't think this strikes at exactly what you or HLI are trying to get at. But I do think it's valuable to ponder how we might get at "principled" discount rates, given all we know about the validity problems these studies exhibit.
This is an interesting idea, but a note of caution here is that effect sizes could shrink in larger studies for 2 reasons: 1. the "good" reasons of less publication bias and more power, etc, 2. the "bad" (bias) reasons that larger studies may be more likely to be implemented more loosely (maybe by government rather than a motivated NGO, for example). The latter issue isn't statistical, it's that a genuinely different treatment is being applied.
Whether or not this matters depends on exactly the question you're asking, but there is some risk in blurring the two sources of shrinkage in effect sizes over the size of the study.
Yep, totally agree that this would be tricky! There'd be a lot of details to think through. I would note that Vivalt does run regressions where, e.g., the kind of organization implementing the program (government vs NGO) is included as a covariate, and the coefficient on sample size doesn't change much (-0.011 vs -0.013 in the single linear regression; see table 7, p. 31).
I am not sure if I'm a fan of this, because the true effect of an intervention will vary across place in ways that will affect the results of future studies, but shouldn't affect our assessment of deworming in this context. So future studies might extend deworming to countries where worm burdens are lower and thus find lower effects of deworming. But it would be a mistake to conclude that deworming in Kenya is less effective based on those studies.
You might say we can control for the country being studied, but that is only the case if there are many studies in one country, which is rarely the case.
What a great post, thanks for this. Hope to see a response from GiveWell. I'm really impressed by the clarity of explanation and analysis here.
Some readers may not know that the effect of deworming has been controversial for many years. Seriously, check out this 'anthology' of critiques and responses from 2015 - and there's been more written since! Tom Chivers also had a short explainer in UnHerd in 2020.
I think one consideration worth surfacing is that GiveWell explicitly notes that
(That page goes into more detail as to why.)
The philosophical underpinning behind this (if you want to call it that) is in Holden Karnofsky's Sequence thinking vs cluster thinking essay -- in short, GW is more cluster-style, while the Happier Lives Institute strikes me as more sequence-style (correct me if I'm wrong). Holden:
And then further down:
Elsewhere, Holden has also written that
If I'm right that HLI leans more towards sequence than cluster-style thinking, then you can interpret this passage as Holden directly addressing HLI (in the future).
This comment is getting too long already, so I'll just add one more Holden quote, from Some considerations against more investment in cost-effectiveness estimates:
Note that these are very old posts, last updated in 2016; it's entirely possible that GiveWell has changed their stance on them, but that isn't my impression (correct me if I'm wrong).
Side note on deworming in particular: in David Roodman's writeups on the GW blog, which you linked to in the main post, GW's "total discount" is actually something like 99%, because it's a product of multiple adjustments, of which replicability is just one. I couldn't however find any direct reference to this 99% discount in the actual deworming CEAs, so I don't know if they're actually used.
I think the main post's recommendations are great -- having spent hours poring over GW's CEAs as inspiration for my own local charity assessment work, the remark above that "these [CEAs] are hard to follow unless you already know what’s going on" keenly resonated with me -- but given GW's stance above on CEAs and the fact that they only have a single person updating their model, I'm not sure it'll be all that highly prioritized?
I am sympathetic to all of these comments but I think deworming is a uniquely bad intervention on which to apply strong priors/reasoning over evidence. It has been a highly controversial subject with strong arguments on both sides, and even the most positive studies of deworming are silent on the mechanisms for large long term effects from a brief intervention. Even consulting experts is not a guarantee of good judgments on a topic that is so polarizing in the expert community. I'm really curious how they arrived at this strong prior.
Ah, I was waiting for someone to bring these up!
On cluster Vs sequence, I guess I don't really understand what the important distinction here is supposed to be. Sometimes, you need to put various assumptions together to reach a conclusion - cost-effectiveness analysis is a salient example. However, for each specific premise, you could think about different pieces of information that would change your view on it. Aren't these just the sequence and cluster bits, respectively? Okay, so you need to do both. Hence, if someone were to say 'that's wrong - you're using sequence thinking' and I think the correct response is to look at them blankly and say 'um, okay... So what exactly are you saying the problem is'?
On cost-effectiveness, I'm going to assume that this is what GiveWell (and others) should be optimising for. And if they aren't optimising for cost-effectiveness then, well, what are they trying to do? I can't see any statement of what they are aiming for instead.
Also, I don't understand why trying to maximize cost-effectiveness will fail to do so. Of course, you shouldn't do naive cost-effectiveness, just like you probably shouldn't be naive in general.
I appreciate that putting numbers on things can sometimes feel like false precision. But that's a reason to use confidence intervals. (Also, as the saying goes, "if it's worth doing, it's worth doing with made up numbers"). Clearly, GiveWell do need to do cost-effectiveness assessments, even if just informally and in their heads, to decide what their recommendations are. But the part that's just as crucial as sharing the numbers is explaining the reasons and evidence for your decision so people can check them and see if they agree. The point of this post is to highlight an important part of the analysis that was missing.
Thanks for collecting those quotes here. Because of some of what you quoted, I was confused for a while as to how much weight they actually put on their cost-effectiveness estimates. Elie's appearance on Spencer Greenberg's Clearer Thinking Podcast should be the most recent view on the issue.
(Time at the start of the quote: 29:14).
I think the quote is reasonably clear in it's argument: maximizing cost-effectiveness through explicit EV calculation is not robust to uncertainty in our estimates. More formally, if our distribution of estimates is misspecified, then incorporating strength of evidence as a factor beyond explicit EV calculation helps limit how much weight we place on any (potentially misspecified) estimate. This is Knightian uncertainty, and the optimal decisions under Knightian uncertainty place more weight on factors with less risk of misspecification (ie stronger evidence).
You say that a "cluster bit" where you think about where evidence is coming from can account for this. I don't think that's true. Ultimately, your uncertainty will be irrelevant in determining the final Fermi estimate. Saying that you can "think about" sources of uncertainty doesn't matter if that thinking doesn't cash out into a decision criterion!
For example, if you estimate an important quantity as q = 1 with a confidence band of (-99, 101), that will give you the same cost-effectiveness estimate as if q had the confidence band of (0, 2). Even though the latter case is much more robust, you don't have any way to minimize the effect of uncertainty in the former case. You do have the ability to place confidence bands around your cost-effectiveness estimate, but in every instance I've seen, confidence bands are pure lip service and the point estimate is the sole decision criterion. I do not see a confidence band in your estimate (sorry if I missed it) so that doesn't seem like the most robust defense?
Full disclosure: I'm the primary author of a yet to be published SoGive report on deworming, however I'm commenting here in a personal capacity.
Thanks for this thought provoking and well-written analysis!
I have a query about whether the exponential decay model appropriately reflects the evidence:
Looking forward to hearing HLI's thoughts on whether this approach better reflects the evidence or if I have misunderstood.
* Note that I have included both the 10th and 20th year, hence the 11 years.
Thank you for your comment Lucas! Looking forward to seeing your forthcoming report.
Firstly, to clarify, we are doing a comparison between GiveWell’s model without decay and with decay. So to make the closest comparison possible we use the starting value and the time values that GiveWell uses. Rows 17, 18, and 19 of their CEA show the values they use for these. They consider the effects of starting 8 years after the deworming ends (~when participants start joining the labour force, see here) and continuing for 40 years with 0.006 each year. We get the same (similar because of our discretisation) total effects as GiveWell of 0.115 (0.113) for their model and show that if we use the exponential decay, we get a ~60% smaller total effect of 0.047.
While it’s plausible there’s a better value to start with; we’re trying to illustrate what would happen if GiveWell added decay to their model. It’s unclear if they would also change the starting value too, but seems like a plausible choice.
The advantage of exponential decay is that it is based on % and so we can extract it from the study and use it on any start value and period, as long as we use the same as GW on these, we can get a proportional decrease in the effect.
We also considered linear decay. When we used linear decay, we found that the reduction in benefits is more dramatic: an 88% reduction. With linear decay, we had to change the start value, but we did this both for the constant effect model and the decay models so we could compare the proportional change.
Of course, a more complex analysis, which neither ourselves nor GiveWell present, would be to model this with the whole individual data.
The main point here is that the effect is very sensitive to the choice of modelling over time and thereby should be explicitly mentioned in GiveWell’s analysis and reporting. I think this point holds.
Hi Joel, thanks for your response on this!
I think my concern is that we can only "illustrate what would happen if GiveWell added decay to their model" if we have the right starting value. In the decay model's current form, I believe the model is not only adding decay, but also inadvertently changes the total earnings effect over the first 11 years of adulthood (yet we already have evidence on the total earnings effect for these years).
However, as you noted, the main point certainly still holds either way.
As a separate note, I'm not sure if it was intentional, but it appears HLI has calculated log effects slightly differently to GiveWell.
I don't have a good intuition on which of these approaches is better. Was there any rationale for applying the second approach for this calculation?
Average of the log is more principled and I'm pretty surprised that givewell did it the reverse. These two quantities are always different (Jensen's inequality) and only one of them is what we care about. Log increase in consumption/income represents the % increase in that quantity. We want to find the average % increase across all people, so we should take the average of the log increase.
Thank you for your comment!
Indeed, we did take the average of the logs instead of the log of the averages. This doesn’t change the end and start point, so it wouldn’t change the overall decay rate we estimate. We could do more complex modelling where effects between KLPS2 and KLPS3 see small growth and KLPS3 and KLPS4 see large decay. I think this shows that the overall results are sensitive to how we model effect across time.
See Figure 4 of the appendix, which shows, whether in earnings or in consumption, that the relative gains, as shown by the log difference, decrease over time.
We used the pooled data because it is what GiveWell does. In the appendix we note that the consumption and earnings data look different. So, perhaps a more principle way would be to look at the decay within earnings and within consumption. The decay within earnings (84%) and the decay within consumption (81%) are both stronger (i.e., would lead to smaller effects) than the 88% pooled decay.
Thanks for the response Samuel, would be interesting to hear GiveWell's rationale on using the log of average(earnings+consumption).
Beautifully written summary
In response to HLI's feedback, we've added a 10% downward adjustment to our deworming cost-effectiveness analysis to account for the benefits of deworming decaying over time. We describe in detail how we arrived at this adjustment in this separate Forum post.
Thanks! This analysis seems quite relevant to inform priorisation amongst interventions which aim to improve human well-being of present generations.
On the other hand, from the point of view of cause priorisation, I think looking into the indirect effects of GiveWell's top charities could be more informative (e.g. the effect on population size seems unclear). Excluding indirect effects, it appears that GiveWell's top charities are not the most effective interventions. For example, based on this, it looks like corporate campaigns for chicken welfare could be 10 k as effective as GiveWell's top charities (excluding indirect effects).
Thanks for evaluating the evaluators!
Great and important post, and I love that these 'boxes are being opened up and made explicit' by you, by Sam Nolan, SoGive and others.
I love this analysis, and I think it highlights how important model choice can be. Both constant and decaying treatment effects seem plausible to me. Instead of choosing only one of the two models (constant effect or decaying effect) and estimating as though this were the truth, a middle option is Bayesian model averaging:
https://journals.sagepub.com/doi/full/10.1177/2515245919898657
Along with the prior over the parameters in the models, you also have a prior over the models themselves (eg 50/50 constant vs decaying effect). The data will support some models more than others and so you get a posterior distribution over the models based on the data (say 33/67 constant vs decaying effect). The posterior probability that each model is true is the weight you give each model when you estimate the treatment effect you're interested in. It's a formal way of incorporating model uncertainty into the estimate, which would allow others to adjust the analysis based on their priors on the correct model (presumably GiveWell would start with a larger prior on constant effects, you would start with a larger prior on decaying effects).
One (small) reason one might start with a larger prior on the constant effects model is to favor simplicity. In Bayesian model averaging when researchers don't assign equal priors to all models, I think the second most common decision is to penalize the model with more parameters in favor of the simpler model, which would mean having a larger prior on the constant effects model in this case. I share your prior that decaying effects of economic programs in adults is the norm; I think it's less clear for early childhood interventions that have positive effects in adulthood. This paper has a review of some qualifying interventions (including deworming) - I'd be interested to see if others have multiple long-run waves and whether those also show evidence of decaying effects.
https://www.nber.org/system/files/working_papers/w25356/w25356.pdf
I'm unclear on whether this works since a constant effects model is a decay model, with a decay parameter set to zero. So you're just setting hyperparameters on the distribution of the decay parameter, which is normal bayesian modelling and not model averaging.
Thanks for this point, I didn't think clearly about how the models are nested. I think that means the BMA I describe is the same as having one model with a decay parameter (as you say) but instead of a continuous prior on the decay parameter the prior is a mixture model with a point mass at zero. I know this is one bayesian method for penalizing model complexity, similar to lasso or ridge regression.
https://wesselb.github.io/assets/write-ups/Bruinsma,%20Spike%20and%20Slab%20Priors.pdf
So I now realize that what I proposed could just be seen as putting an explicit penalty on the extra parameter needed in the decay model, where the penalty is the size of the point mass. The motivation for that would be to avoid overfitting, which isn't how I thought of it originally.
Thank you for sharing this and those links. It would be useful to build a quantitative and qualitative summary of how and when early interventions in childhood lead to long-term gains. You can have a positive effect later in life and still have decay (or growth, or constant, or a mix). In our case, we are particularly interested in terms of subjective wellbeing rather than income alone.
I am a bit rusty on Bayesian model comparison, but - translating from my frequentist knowledge - I think the question isn’t so much whether the model is simpler or not, but how much error adding a parameter reduce? Decay probably seems to fit the data better.
Any model with more degrees of freedom will always fit the data (that you have!) better. A decay model nests a constant effects model, because the decay parameter can be zero.
Where does GiveWell explain the reasoning for discounting the effect of the treatment observed in the data by 87%? Looking at the post you linked I don't see 87% mentioned, but there is a link to this cost-effectiveness estimate but that ranges from 54% to 85% but those are also from Nov 2016.
You can find their replicability adjustment here, and explanations are in this doc :)
Thank you!
Perhaps you should re-emphasize the ~main takeaway in the intro?
But you suggest that GW vastly discounted the one study that suggested very large LT benefits in an ad-hoc way.
Thus I saw the takeaway as possibly the opposite -- maybe even understated benefits of deworming, but perhaps vastly more uncertainty.
And your pain point was a critique of GW's approach. ... I think you are saying "don’t do (semi-hidden) ad-hoc adjustments"
… do this as part of a transparent methodology. If you are incorporating prior beliefs, make this explicit.
If you want to include a study-specific random term as part of a Bayesian meta-analysis, make that explicit. (This is my suggestion but I think other commenters fleshed out this a bit more.)
It seems alarming that GiveWell bases their significant donation recommendations only on one study[1] that, furthermore, does not seem to understand beneficiaries' perspectives but rather estimates metrics that relate to performance within hierarchies that historically privileged people set up: school attendance[2], hours worked[3], and income.
I disagree that GiveWell's reports should align more closely with academic norms, because these norms do not engage intended beneficiaries.
Explanations can help differentiate the actually most helpful programs from those made prestige by big/small numbers and convoluted analyses.
Allowing GiveWell's audience tweak the factors and see how conclusions change would show the organization's confidence in their (moral) judgments.
'Data' should not be confused with 'numbers.' Focus group data may be invaluable compared to quantitative estimates when a solution to a complex problem is being found.
School curricula in developing contexts may include post-colonial legacy, select elites while leaving most behind, or optimize for raising industrial workforce that may prevent global value chain advancement of industrializing nations but make the countries an instrument for affordable consumption of foreign-made goods.
I am unsure whether unpaid domestic and care work was considered within hours worked - excluding this would imply greater value of paid over unpaid work, a standard set up by the historically privileged.
If you found this post helpful, please consider completing HLI's 2022 Impact Survey.
Most questions are multiple-choice and all questions are optional. It should take you around 15 minutes depending on how much you want to say.