Disclaimer: I have a physics background, but not a statistics or terrorism background. I’m hoping the simple nature of the equations will protect against me screwing up the maths here, but you should obviously not take blog posts as final authorities on any of these matters.
Introduction:
In effective altruist communities, the concept of a warning shot refers to a catastrophic event that tips off humanity about the seriousness of a threat of human extinction. The hope is that such an event would serve as a wake-up call to humanity and prompt cooperation to prevent extinction from occurring.
Warning shots are often discussed in the context of existential risk from AI, where the assumption seems to be that such warning shots would be few and far between. I have previously written an article arguing the opposite, that if AI truly is an existential threat, that warning shots would be incredibly frequent. However, I am not aware of significant study of AI attacks as a statistical phenomenon.
In this article, I want to discuss a different phenomenon where statistical data is available, and has been to shown to follow a fairly regular statistical pattern: that of terrorist attacks.
I think terrorist attacks are worth studying in an existential risk context, because many “doomsday” scenarios can be arguably described as terrorist attacks. For example, I’ve seen people put forward a case where a disgruntled individual decides to engineer and release a supervirus to kill us all, As part of this article, I will look at what the data can tell us about how likely we are to get warning shots for terrorism, and how future technology might affect the likelihood of this occurring.
The definition of “warning shot” is not precisely defined. In this post, I am going to provide a very strict definition: a terrorist attack is not a “warning shot” unless it kills a million people or more.
In this article, I want to show statistical evidence that even with this extremely high bar, we can still expect to see terrorist warning shots numbering in the thousands, even hundreds of thousands, before we see one that wipes out the human race.
This evidence relies on a simple statistical model of a power law distribution, but crucially, it does not assume that the statistical model holds perfectly or anywhere near close to perfectly. I’m going to show that if you relax the assumptions about a perfect power law, it results in a prediction of even more warning shots, as the power law is generally considered a very “fat-tailed” distribution.
Introduction to terrorist attack data:
I have previously discussed terrorist attack data in my previous article on disaster frequency and power laws. If you want a more in depth discussion of what power laws are and how applicable they are to real world data, I recommend reading my previous article.
The main data I will be looking at comes from this paper here from Clauset, Young and Gleditsch. In the paper, they looked at the frequency of different terrorist attacks with different numbers of victims. They examine a time period of 50 years leading up to 2008, with over 13000 datapoints of individual terrorist attacks and their frequencies, and find a pretty clear power law trend.
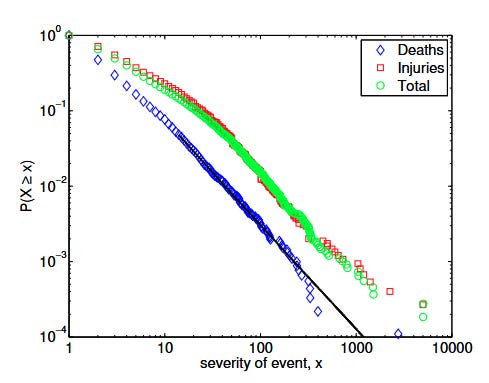
To explain what that means, let’s look at the key graph of the paper, with terrorist deaths shown in blue:
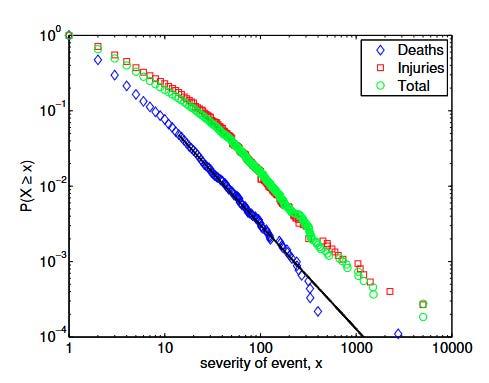
On the x axis, we have the severity of event, in terms of number of people killed, on a log scale. On the Y-axis, also on a log-scale, we have the probability of a randomly chosen attack from the dataset being higher than that severity number x. So, for example, if our x is 100 deaths, the corresponding value is roughly 10-3, meaning that 1 in a thousand attacks had 100 deaths or more.
On the log-log scale shown here, we can see a straight line trend, in this case a fitting to the Power law distribution. This particular distribution follows the principle that if you pick a random event E, then for each value x the probability that the magnitude of E is greater than X is proportional to x^(alpha-1). In this case, our value of Alpha is 2.4, corresponding to a graph slope of 1.4.
Let me translate the above graph into everyday terms.
It is saying that, in a 50 year period that followed the power law exactly:
The number of attacks that killed between 1 and 10 people is expected to be 23,753
The number of attacks that killed between 10 and 100 people is expected to be 974, which is 24 times lower than the previous segment.
The number of attacks that killed between 100 and 1000 people is expected to be 40, which is 24 times lower than the previous segment.
The number of attacks that killed between 1000 and 10,000 people is expected to be 2, which is 24 times lower than the previous segment.
In reality, the numbers don’t fall exactly on the line. It is fairly typical for power law distributions to look really noisy at the higher magnitudes due to the lack of data.
Existential risk
Now, lets turn to “existential threats”. What does this data say about the probability of a terrorist attack killing all of humanity?
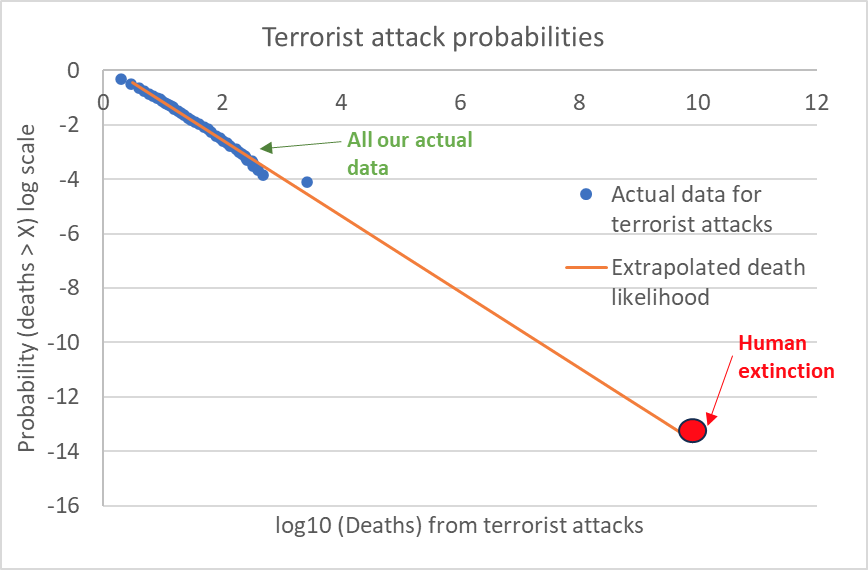
Well, the simple answer is that it doesn’t say much at all. The most deadly terrorist attack was 9/11, which killed around 3000 people. This is six orders of magnitude smaller than the billions of people on planet earth. The gap between the area we have statistics in, and the area we are concerned about, is simply too large for an extrapolation to be meaningful. An extrapolation would put the probability of an extinction event in the next 50 years at something like 1 in 3 billion. However, we shouldn’t take this calculation too seriously, because the actual data is very far away from the order of magnitude we are talking about:
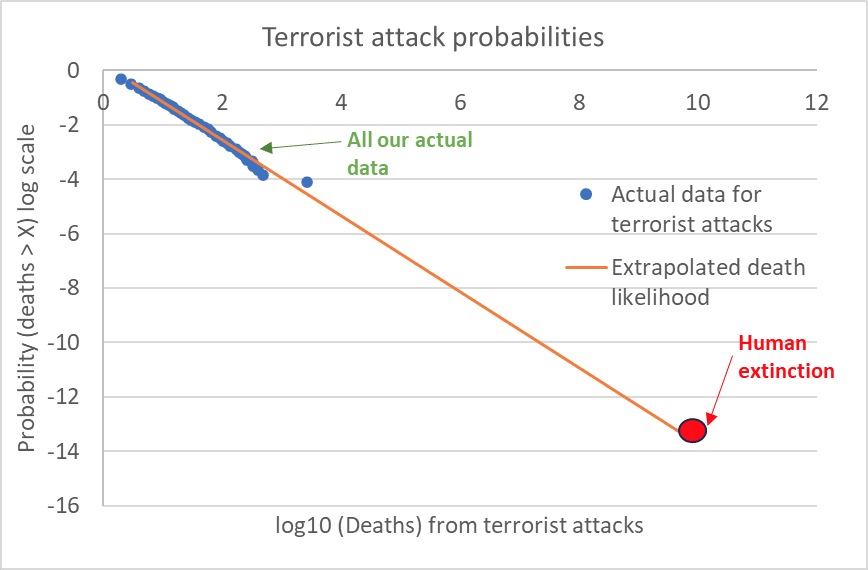
However, let’s just say for the moment that the trend did hold the entire way. What would it mean for warning shots?
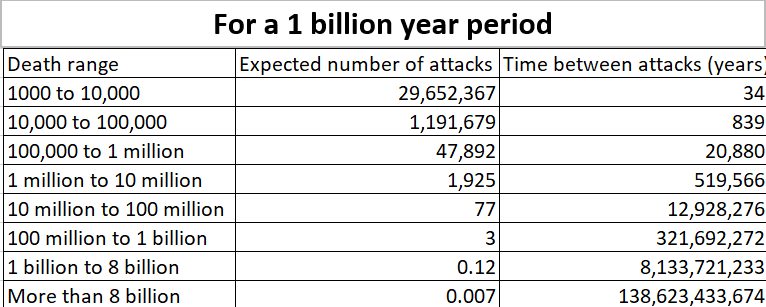
Let’s take the distribution above, and instead of running it for a 50 year period, we run it for a billion year period. We make the (obviously incorrect) assumption that the distribution doesn’t change in this time. The results in this silly scenario would be as follows:
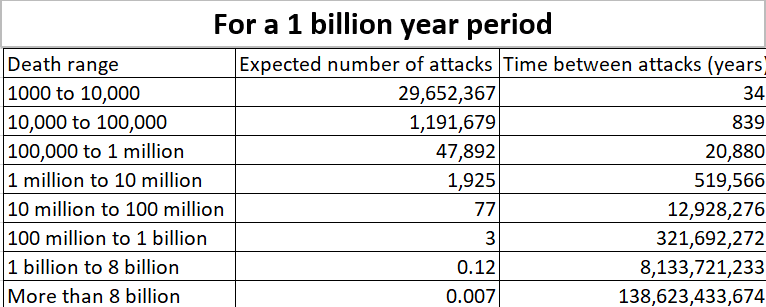
This shows that we expect a 9/11 scale attack every 34 years, an attack killing between 1 and 10 million people every 500,000 years, whereas an extinction level event occuring every 140 billion years.
Before encountering an extinction level event, you would be expected to have a billions year long history, filled with large numbers of massive lower level attacks. Now, I want to define something I will call the “Warning shot ratio”, which I will define as:
P(C)/P(E)
Where P(C) is the probability of an attack killing between 1 and 10 million people (ie, a city-sized attack), and P(E) is the probability of an attacking killing over 8 billion people (ie, extinction). For the power law described above, the warning shot ratio is about 250 thousand. Ie, you would expect to see on average about 250 thousand cities wiped out before you saw humanity as a whole wiped out.
But of course, merely having a model is not the end of the story. In the next sections, I will examine the various assumptions of this model. First, I’ll look at the assumption that the distribution is a power law over the whole range, then at the assumption that the power law exponent is exactly 2.4, and then look at how things might change over time and with technology type.
Distributions other than power laws:
The first and most important assumption in the model is the assumption that the distribution for terrorism will continue to look like a power law for a further six orders of magnitude beyond what we have data for.
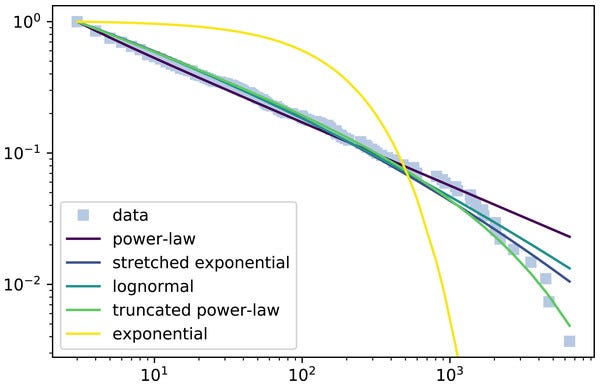
There are very good reasons to be skeptical of this. The statistician Cosma Shalizi (who worked with many of the authors of the terrorism paper), wrote a lot of articles emphasizing that it’s very easy to mistake other distributions for power laws. As an example, the following graph shows the data for participation in wiki communities from this article. This data set appears to follow a power law perfectly up until you get to 10^3, then it starts to fall off faster, in a way that could fit a number of curves that fall off faster than power law:
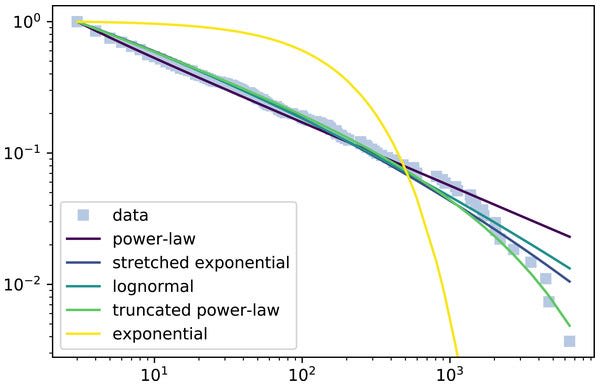
In this paper, researchers Corral and Gonzalez reassessed a number of empirical phenomenon in geoscience that appeared to show power law behaviour. One of their findings (shown in table 6) was that only 3 out of 15 re-analysed datasets showed untruncated power law behaviour over the dataset range. Of the other 12, some were better fits to a truncated power law distribution (which falls of faster at higher magntiudes), a lognormal distribution (which also falls faster at higher magnitudes, or no fit to any distribution could be found (for rain, which by visual inspection also falls off faster than power laws).
This is all unsurprising, because the power law is well-known as being a very “fat tailed” distribution, compared to other patterns found in nature, with way more extreme values than found in other distributions. So when it breaks, it almost always seems to break downward, at least from what I’ve seen. I certainly can’t think of a conceptual reason why we should expect it to break upwards.
The implication of this for warning shots is that in this very common situation where the power law is actually truncated or falls off for high values, we should expect even more warning shots than I showed off in my worked example. With any truncated curve, the probability of extreme events starts dropping off much faster than expected, and hence you would expect to see way more moderate events before seeing an extreme one.
So, despite my analysis above predicting an obscene number of warning shots, in the very likely scenario where the true distribution is less fat-tailed than a power law, we would expect even more warning shots.
Effect of alpha
Okay, let’s just pretend for a while that the power law distribution really does hold over the entire mangitude range. What would happen if the parameters of the power law was different from the values that Clauset et al found?
The most important parameter of the power law distribution is the alpha parameter. This parameter is typically between 2 and 3 for a wide variety of empirical phenomena, with some outliers. Clauset found it to be 2.4. How would different values affect our findings?
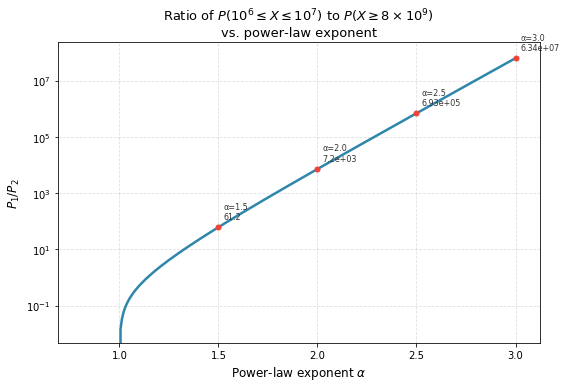
To visualise this, let’s look at the “warning shot ratio” again, defined earlier as the predicted ratio of attacks between 1 and 10 million deaths to attacks over 8 billion deaths. Below is a Graph of the effect of alpha on this ratio (Note the log scale on the y-axis) :
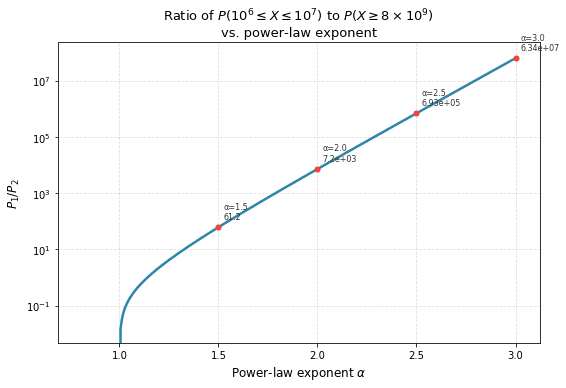
The weird drop at 1.0 occurs because at this point the slope of the power law becomes 0, which would imply that the odds of finding a value above any value of X is the same, which is impossible. Once you get an alpha above 1.1 or so, this weirdness stops, and the ratio rises exponentially as you increase alpha.
At an alpha of 1.5, it is 60 times as likely to see a city–scale attack as an extinction level event.
At an alpha of 2, it is 7000 times as likely to see a city–scale attack as an extinction level event.
At an alpha of 2.5, it is 700,000 times as likely to see a city–scale attack as an extinction level event.
At an alpha of 3, it is 60 million times as likely to see a city–scale attack as an extinction level event.
As alpha gets higher, it gets even more ridiculous, at an exponential rate. So even if the alpha found in the dataset is a little off, and the power law holds up across all orders of magnitude, we would still be expected to see massive amounts of warning shots. For there to be little or few warning shots, the power law would need to hold, and the alpha value would have to be unusually low, lower than 1.5.
Changes over time:
Okay, lets move on to another assumption: the assumption that the next 50 years will look exactly the same as the previous 50 years. Is this really reasonable, given that technological growth is expanded, and we see new technology like LLM’s bursting onto the scene and rapidly advancing? Won’t this increase the danger, and decrease the likelihood of warning shots?
Well, we have to be careful here. Remember, our power law is describing the relative likelihood of attacks. If technological advances make very deadly terrorist attacks more likely, they might make easy attacks more likely as well. In that case, as the extreme events increase in frequency, so too would the warning shots. What we actually care about is the change in the exponent alpha.
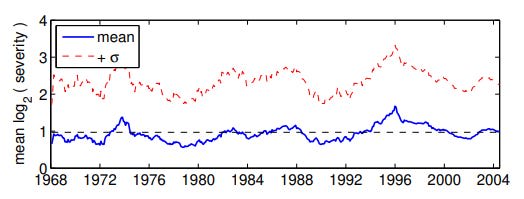
So what does the actual data say? Well, over the fifty year period of the data, from 1954-2004 ,the number of attacks did not change by a huge amount:
They also looked at the value of the power exponent alpha over the 50 year period, and found that it was fairly stable over time, and actually increased in the years leading up to 2004, making warning shots more likely, not less.
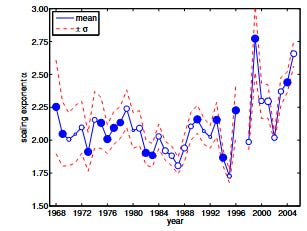
Following our alpha graph from earlier, the "warning shot ratio” has varied from a low of 700 to a high of 7 million over the 50 year dataset period. These changes are signficant, but don’t change the underlying prediction of very common warning shots.
Why did alpha seemingly increase towards the end of the dataset leading up to 2004:? The authors explain:
“our analysis suggests that the changes in event frequencies have not been evenly distributed with respect to their severity, but rather that less severe attacks are now relatively more frequent, while the frequency of “major” or tail-events has remained unchanged.”
Unfortunately, I was unable to find a straightforward extension of this dataset to the present day. This is especially unfortunate because it appears there was a large rise in terrorist incidence starting right after the dataset ended. I wasn’t able to find any updated alpha values, but I expect that if you did look, it would still end up in a similar range to the graph shown above.
Weapon type:
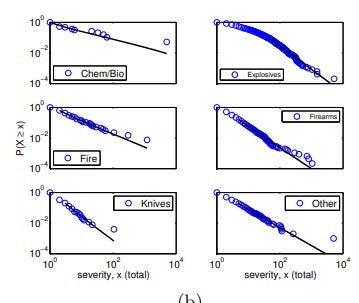
“Terrorist attacks” is a pretty broad category, and terrorists can use a variety of different methods to kill people. The authors hence break down the power law trend by the type of weapon used, and find that breaking it down into six different types of weapons results in distributions that still resemble power laws, albeit with different exponents:
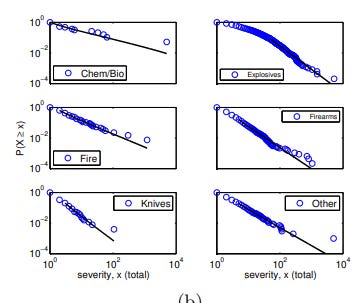
The Exponents and other features of each are summarised in the table below:
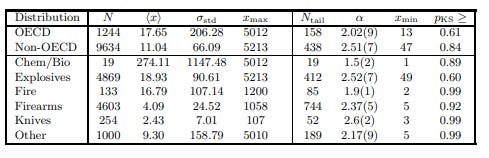
For the most part, the exponents are in the 2-3 range that is considered “typical” for power laws, which would give warning shot ratios of 7000 or more. The two exceptions are “fire” and “chem/bio”.
Terrorist attacks for “fire” have an alpha of 1.9, which has a “city to humanity” ratio of around 2000. Taken literally, this means that we would expect an arson attack killing all of humanity to be 2000 times as rare as an arson attack killing a major cities worth of people.
But let’s stop for a second: it is hard to fathom how one would kill 10 million people in an arson attack, and we can say that it is just straight up impossible for a terrorist to kill all of humanity in an arson attack. This is a case where we know for a fact that the power law behaviour is not going to actually extend out that far, giving us another warning about the effect of naively extrapolating data.
Now, onto the most concerning result: the alpha value calculated for Chem/bio is 1.5. This is concerningly low, although our city-to-extinction ratio is still about 60 for this value. However, there are severe problems with this dataset:
“for chem/bio attacks, the sparsity of the data reduces the statistical power of our fit,and, as discussed by Bogen and Jones (2006), the severity of the largest such event,the 1998 sarin gas attack in Tokyo, is erroneously high.”
There is only about a dozen datapoints, only one such attack is labelled as having a high death toll, and the labelling is wrong. The dataset is wrongly saying that the 1998 attack killed thousands of people when it actually only killed about a dozen people. So this calculated alpha value is basically useless.
Now, we can’t say anything about terrorist weapons that are not on this list. Perhaps there will be some future tech coming along that will count as a new category for terrorist attacks, like AI drones or something. But, unless we have a really good reason to believe that the new form of attacks will have an extremely low alpha, or be the extremely rare exception to rule of attacks following power laws or lower, we can guess that it will probably produce the same kind of curve as the ones above.
Implications
Suppose that this argument is correct. What does this imply?
Plentiful warning shots does not automatically mean that there is no existential risk from terrorism. It is possible that that catastrophes will occur, and that humanity will ignore it, and not take any action to prevent it. Perhaps we will just get used to catastrophes, and treat them as a fact of life.
Personally, that doesn’t seem likely. I would argue that it is more typical for people to over-react to terrorist attacks, rather than ignore them. Consider just how transformational the response to the 9/11 attacks was. It seems like way bigger attacks would prompt even more extreme responses.
Overall, I think this points to a preventing terrorism existential risk. All you have to do is foster a society which is not indifferent to mass death, and that will see a horrible event and take actions to prevent it from happening again. That means that a democratic society of transparency and accountability is very important to the health of humanity.
Conclusion:
In this article, I have discussed the idea of “warning shots” around terrorist attacks. In particular, I have looked at a “warning shot ratio”, which is the expected amount of 1-10 million death terrorist attacks to see before an extinction scale attack was seen.
For a simple power law model with the exponent fitted by Clauset et al, this ratio was found to be over 250 thousand, meaning we would expect to see ample warning before an extinction level event.
In the much more likely event that the power law assumption is not true at higher magnitudes, then this warning shot ratio would probably be much higher, meaning even more attacks would be seen before an extinction level event. Even if the power law did hold, and the exponent turned out to be somewhat lower than that found by Clauset, we still would expect to see dozens or hundreds of warning shots.
Even if technological changes made terrorist attacks much, much easier, it would not necessarily have any effect on the warning shot ratio, because technology that makes extinction easier could very easily make lower-death events easier as well.
Broken down by technology type, the only concerning type of attack was chemical and biological weapons, which had a worryingly low power law exponent, although the dataset was too sparse and flawed for this to be trustworthy.
Overall, if my argument holds, I think there is enough evidence to be very confident that if humanity is ever wiped out in a terrorist attack, that we will have had a huge amount of warning before it happens. Hopefully, this warning will be translated into action, and overall I think the threat of terrorism existential risk is extremely low as a result.
In a future post, I may try extending this framework to other existential threats. I think most of the principles here will still apply to any threat which is power-law distributed or less than power-law distributed, which may well be almost all of them.


I mostly agree with the conclusion (though have not vetted the analysis in detail). This is one of the reasons why I'm more concerned with takeover risk and extreme concentration of power, than with random wanton destruction by terrorists (human or otherwise).