Hide table of contents

Executive summary

On behalf of CEA, SEADS (Sharing EA Data Science) analysed view metrics of the EA Forum for the 14-month period from February 2020 to March 2021. We focused on two metrics:

  • View count (the number of times pages were viewed by anyone)
  • View time (time spent on a page before the user leaves for another page[1]) Both metrics roughly doubled in the analysed period. By March 2021, the Forum had about 2500 views and 100 view hours per day. Aggregation of view metrics by post, author, and tag showed a very asymmetric distribution: most posts, authors, and tags received very few views, while a few held most of the view share. The top 5% of posts accounted for about half of the views and view time.

Introduction

Situation

SEADS — Sharing EA Data Science[2] — is an output-oriented project group. We aim to study questions relevant to EA and publish the results of our findings on the EA Forum. Our expertise lies in data analysis and data science.

We have been collaborating with CEA since around March 2020. Our first project with CEA focused on EAG survey data analysis (see our post on that). In this post, we discuss our analysis of view metrics of the EA Forum over a 14-month period spanning February 2020 through March 2021.

Motivation of analysis

The EA Forum is the central knowledge-exchange platform of the EA community. Therefore, metrics on its usage are potentially of interest to both CEA and the community as a whole.

Research question

CEA provided the following question to guide our analysis of the EA Forum:

Given the metrics view count and view time, what information do we gain by aggregating them in the following ways: overall, by post, by author, and by tag?

Methods & results

Data used

CEA collects anonymised user data on view count and view time for each EA Forum post. We analysed these two metrics over a single 14-month time period. All findings on the metrics are therefore limited to this period; we cannot determine whether they are representative of other time periods.

View metrics overall

Development over time

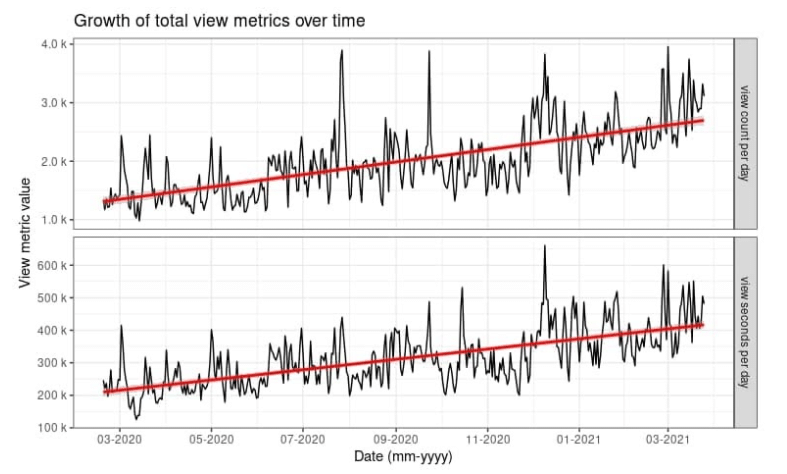
Figure 1 shows the growth of the view metrics’ view count and view seconds over the analysed time period. Both metrics roughly doubled. When modeled linearly (see the red lines in Figure 1), the increase per day was about 3 views and 8 view minutes. By March 2021, the EA Forum registered ~2500 post views and ~100 post view hours per day.[3] Remember: this linear increase is specific only to the timeframe we analysed.

Figure 1: view count per day (upper) and view seconds per day (lower) plotted against view date. The plot of each view metric is overlaid with a linear fitting function (red).

Distribution of view times

The distribution of post view times per user per day was heavily skewed towards short view times. Very few views were for extended periods, with the median post view time equal to 60 seconds.

View metrics by post

The all-time total number of EA Forum posts at the end of March 2021 was 14643. Of those, 6159 posts were viewed over the analysed time period. As with the post view times, the view count per post was heavily skewed — most posts had low counts, with the median at 28 views and with few posts showing high counts. The same distribution holds true for total view time per post (adding up all views ever), with the median at 1900 seconds.

In terms of view share, the top 5% of posts accounted for around half of the view metrics:

  • 46% of the view count
  • 58% of view time

The top three posts for the period by view count were:

The top three posts for the period by total view seconds were:

View metrics by author

The all-time number of authors[4] by the end of March 2021 stood at 3645. Of these, 1447 had views on one or more of their posts. The number of posts per author viewed in this period ranged from 1 to 398, with the median at 1. In other words, more than half of all authors published only one post.

Once again, the view metrics per author showed heavily skewed distributions: most authors’ posts had low averages, and just a few had high averages. The average total view time per post ranged from 10 to ~1.1 million seconds, with a median of 2620 seconds. The average number of views per post ranged from 1 to ~5800, with a median of 34 views.

View metrics by tag

233 different tags were assigned to the posts published over the analysed period.[5] The most-used tag was used 1061 times, with the median at 15 posts per tag. These are the top three tags which were assigned to posts:

  • Community
  • Existential risk
  • Cause prioritization

Again, the view counts per tag were heavily skewed; most tags had low average views and few had high ones. The median was 269. The median post view time per tag was 700 minutes.

Figure 2 shows the top ten tags by average view count (left) and by average view time (right). The top four tags were the same for both metrics, albeit in differing order: “Totalitarianism” (which had the highest view count), “Persistence of political cultural variables” (which had the highest view time), “bounded rationality”, and “memetics”. All tags were included, even those with only one post.
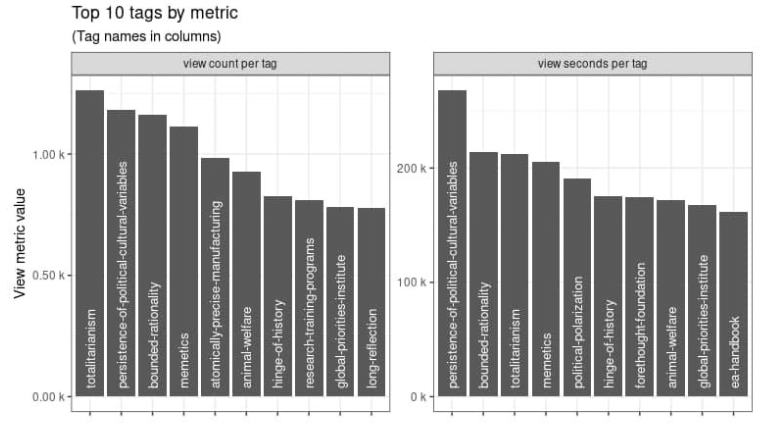
Figure 2: top ten tags by average view count (left) and by average view seconds (right). By average view count, the tag “totalitarianism” ranked highest and by average view time the tag “persistence of political cultural variables” came first.

Conclusion

Our analysis of the two EA Forum view metrics view count and view time over a 14-month time period shows that both metrics roughly doubled, to about 2500 views and 100 view hours per day. Each of the views by post, author, and tag were heavily skewed towards very low numbers. The top 5% of posts accounted for about half of the views and view time.


  1. Special case: If a user with the same browser tag accesses the same post several times a day, then this time is added up. So we measured “view time per post per user per day”. ↩︎

  2. We replaced “Swiss” with “Sharing” in anticipation of future collaborators, and to be more inclusive. ↩︎

  3. By only including views/hours for post viewing, we excluded all views/hours on pages like the homepage, the “All Posts” page, and tag pages. ↩︎

  1. People who published at least one post. ↩︎

  2. Note that this was before the Editing Festival, when there were many fewer tags than there are now. ↩︎

Show all footnotes

30

0
0

Reactions

0
0

More posts like this

Comments7


Sorted by Click to highlight new comments since:

"The top 5% of posts accounted for about half of the views and view time."

Looks like the EA forum, just like the overall project of effective altruism itself, is a hits-based business!

Does anyone know what other forums and media are like in this regard? One guess is that the distribution of views on major media sites is not as lopsided.

I recall Kelsey Piper mentioning that there was significant variation in the popularity of Future Perfect articles. It would be interesting to see how it compares to the EA Forum in this respect.

Thank you!

Does anyone know how this compares to other EA sites, forums in general and to the EA growth rate?

How well is this forum doing as a main internet hub of the EA community?

Cool! Just in case you have the data quickly at hand, I’d‘ve been interested in more than just the top three articles, maybe you could add the top ten? Also, maybe minutes would be the more intuitive unit, compared to something like 2600 seconds.

Hi MaxRa
Thanks for your question and input. We don't want to encourage too much of a comparison between posts to avoid giving the impression that some are "better" than others. Therefore, we'd prefer to let the post stand as it is.

Thanks SEADS for your help with this research, and for taking the time to share it publicly!

Curated and popular this week
 ·  · 5m read
 · 
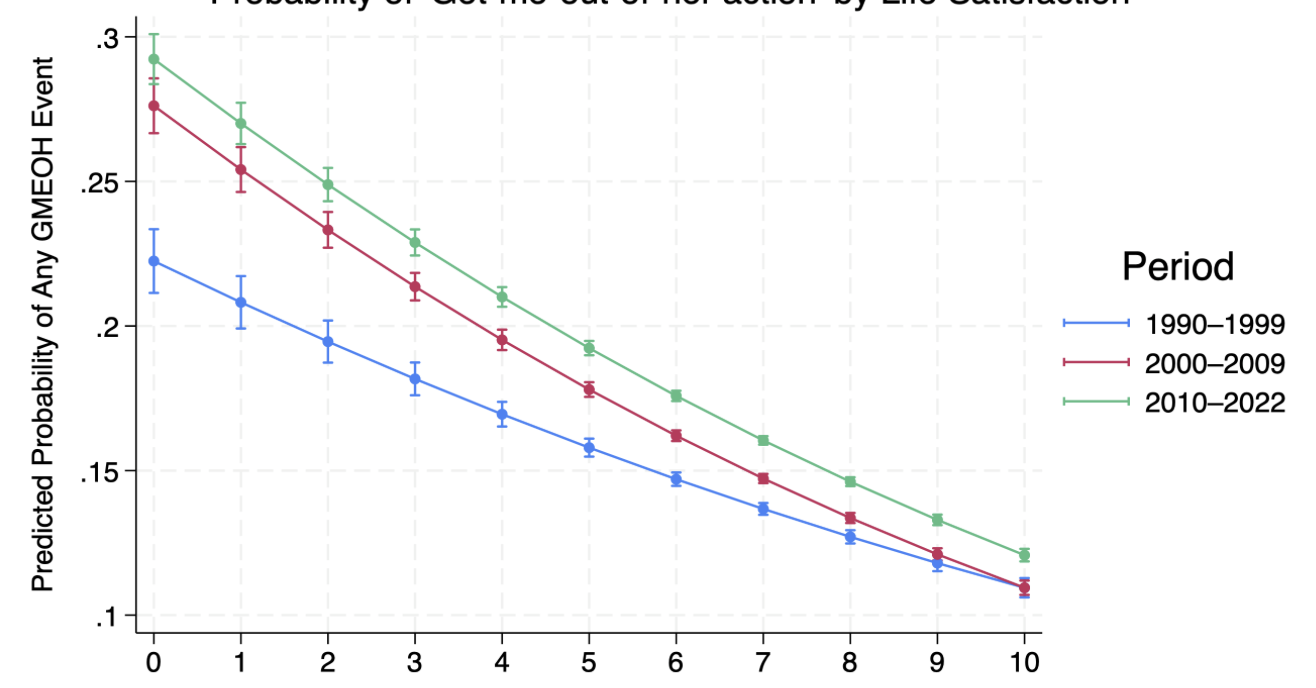
This work has come out of my Undergraduate dissertation. I haven't shared or discussed these results much before putting this up.  Message me if you'd like the code :) Edit: 16th April. After helpful comments, especially from Geoffrey, I now believe this method only identifies shifts in the happiness scale (not stretches). Have edited to make this clearer. TLDR * Life satisfaction (LS) appears flat over time, despite massive economic growth — the “Easterlin Paradox.” * Some argue that happiness is rising, but we’re reporting it more conservatively — a phenomenon called rescaling. * I test rescaling using long-run German panel data, looking at whether the association between reported happiness and three “get-me-out-of-here” actions (divorce, job resignation, and hospitalisation) changes over time. * If people are getting happier (and rescaling is occuring) the probability of these actions should become less linked to reported LS — but they don’t. * I find little evidence of rescaling. We should probably take self-reported happiness scores at face value. 1. Background: The Happiness Paradox Humans today live longer, richer, and healthier lives in history — yet we seem no seem for it. Self-reported life satisfaction (LS), usually measured on a 0–10 scale, has remained remarkably flatover the last few decades, even in countries like Germany, the UK, China, and India that have experienced huge GDP growth. As Michael Plant has written, the empirical evidence for this is fairly strong. This is the Easterlin Paradox. It is a paradox, because at a point in time, income is strongly linked to happiness, as I've written on the forum before. This should feel uncomfortable for anyone who believes that economic progress should make lives better — including (me) and others in the EA/Progress Studies worlds. Assuming agree on the empirical facts (i.e., self-reported happiness isn't increasing), there are a few potential explanations: * Hedonic adaptation: as life gets
 ·  · 38m read
 · 
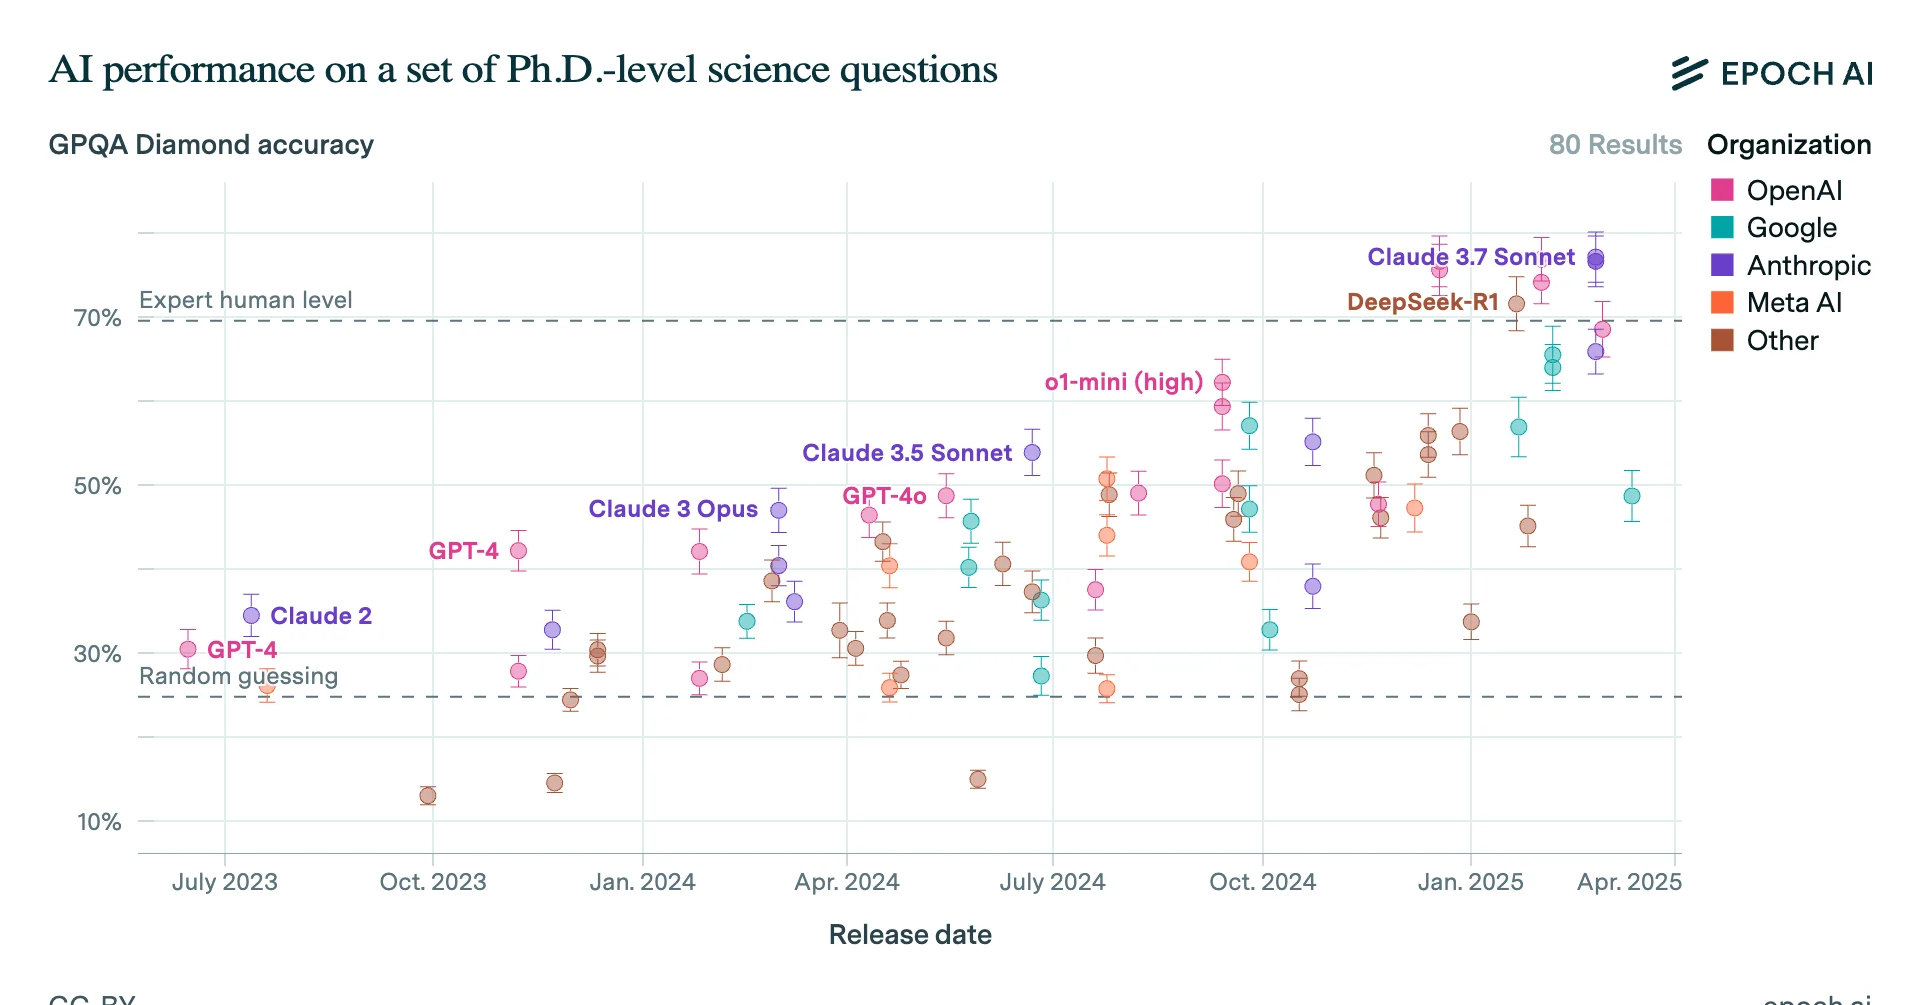
In recent months, the CEOs of leading AI companies have grown increasingly confident about rapid progress: * OpenAI's Sam Altman: Shifted from saying in November "the rate of progress continues" to declaring in January "we are now confident we know how to build AGI" * Anthropic's Dario Amodei: Stated in January "I'm more confident than I've ever been that we're close to powerful capabilities... in the next 2-3 years" * Google DeepMind's Demis Hassabis: Changed from "as soon as 10 years" in autumn to "probably three to five years away" by January. What explains the shift? Is it just hype? Or could we really have Artificial General Intelligence (AGI)[1] by 2028? In this article, I look at what's driven recent progress, estimate how far those drivers can continue, and explain why they're likely to continue for at least four more years. In particular, while in 2024 progress in LLM chatbots seemed to slow, a new approach started to work: teaching the models to reason using reinforcement learning. In just a year, this let them surpass human PhDs at answering difficult scientific reasoning questions, and achieve expert-level performance on one-hour coding tasks. We don't know how capable AGI will become, but extrapolating the recent rate of progress suggests that, by 2028, we could reach AI models with beyond-human reasoning abilities, expert-level knowledge in every domain, and that can autonomously complete multi-week projects, and progress would likely continue from there.  On this set of software engineering & computer use tasks, in 2020 AI was only able to do tasks that would typically take a human expert a couple of seconds. By 2024, that had risen to almost an hour. If the trend continues, by 2028 it'll reach several weeks.  No longer mere chatbots, these 'agent' models might soon satisfy many people's definitions of AGI — roughly, AI systems that match human performance at most knowledge work (see definition in footnote). This means that, while the compa
 ·  · 4m read
 · 
SUMMARY:  ALLFED is launching an emergency appeal on the EA Forum due to a serious funding shortfall. Without new support, ALLFED will be forced to cut half our budget in the coming months, drastically reducing our capacity to help build global food system resilience for catastrophic scenarios like nuclear winter, a severe pandemic, or infrastructure breakdown. ALLFED is seeking $800,000 over the course of 2025 to sustain its team, continue policy-relevant research, and move forward with pilot projects that could save lives in a catastrophe. As funding priorities shift toward AI safety, we believe resilient food solutions remain a highly cost-effective way to protect the future. If you’re able to support or share this appeal, please visit allfed.info/donate. Donate to ALLFED FULL ARTICLE: I (David Denkenberger) am writing alongside two of my team-mates, as ALLFED’s co-founder, to ask for your support. This is the first time in Alliance to Feed the Earth in Disaster’s (ALLFED’s) 8 year existence that we have reached out on the EA Forum with a direct funding appeal outside of Marginal Funding Week/our annual updates. I am doing so because ALLFED’s funding situation is serious, and because so much of ALLFED’s progress to date has been made possible through the support, feedback, and collaboration of the EA community.  Read our funding appeal At ALLFED, we are deeply grateful to all our supporters, including the Survival and Flourishing Fund, which has provided the majority of our funding for years. At the end of 2024, we learned we would be receiving far less support than expected due to a shift in SFF’s strategic priorities toward AI safety. Without additional funding, ALLFED will need to shrink. I believe the marginal cost effectiveness for improving the future and saving lives of resilience is competitive with AI Safety, even if timelines are short, because of potential AI-induced catastrophes. That is why we are asking people to donate to this emergency appeal