Comments
Good to see more and more examples of using Squiggle. Do you think you can use these or future examples to really show how this leads to "ultimately better decisions"?

Good to see more and more examples of using Squiggle. Do you think you can use these or future examples to really show how this leads to "ultimately better decisions"?
So two questions here:
How hard would it be to get other people's squiggles more as tables so it's clearer where to put your own values if you disagree? Could squiggles be auto-turned into google sheets?
When are we gonna get squiggle embedded in the forum with people being able to vote on variables?
I like how
squiggle embedded in the forum
would be easy (we have a Squiggle components storybook that shouldn't be that hard to integrate), but
people being able to vote on variables
would be fairly annoying.
To answer your question, when one of the developers feels like this is a priority, but not in the immediate future.
I currently use Guesstimate for things like you're proposing. Why should I move to Squiggle? Do you recommend Squiggle directly or via the Google Sheets interface you've developed here?
Not sure, but curious to see you give it a try.
thank you for this
you are welcome
This post goes through several simple estimates, written in Squiggle, a new estimation language. My hope is that it might make it easier to write more estimates of a similar sort, wider adoption of Squiggle itself, and ultimately better decisions.
One can use Squiggle in several ways. This blog post will cover using it on its website and in a Google Spreadsheet. An upcoming blog post will cover using it in more complicated setups.
The simplest way to use Squiggle is to open squiggle-language.com/playground. You will see something like the following:
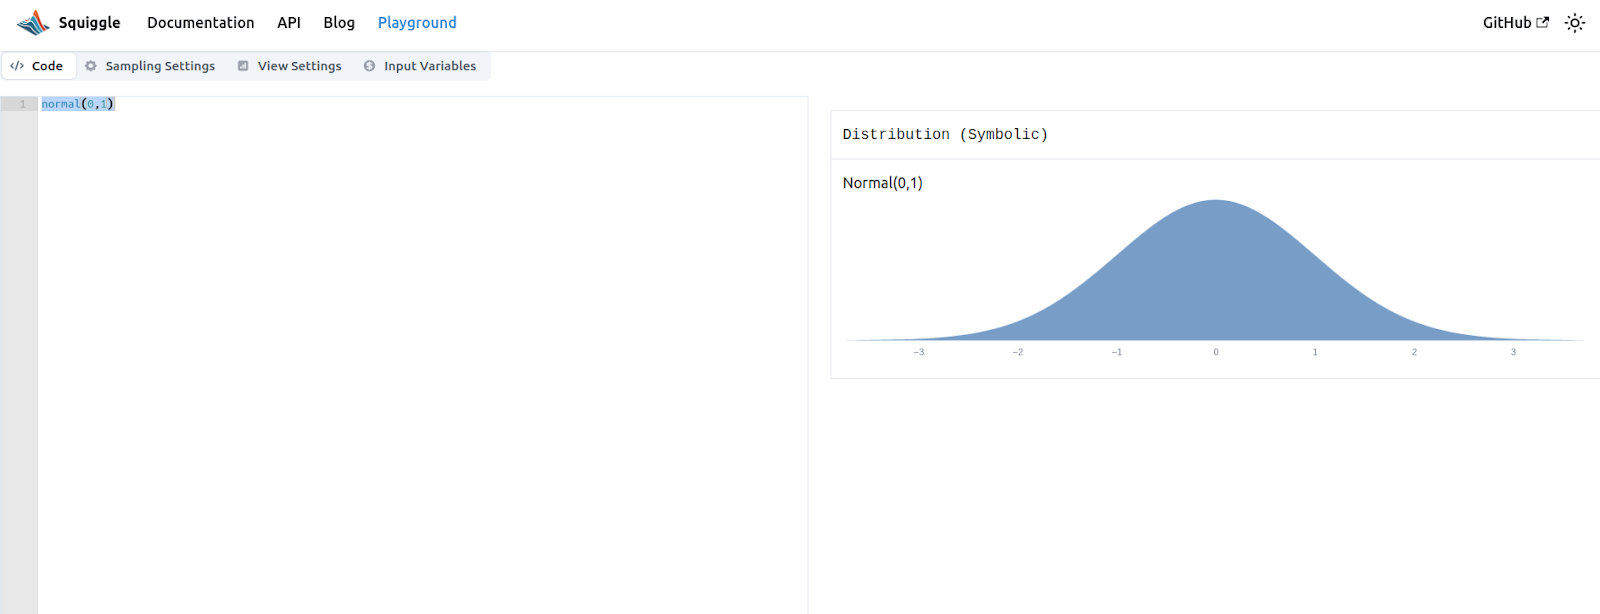
You can write your model on the editor in the left side, and the results will be displayed in the right side. As you make edits, the url in your browser bar will change so that you copy it and use it to refer people to your model.
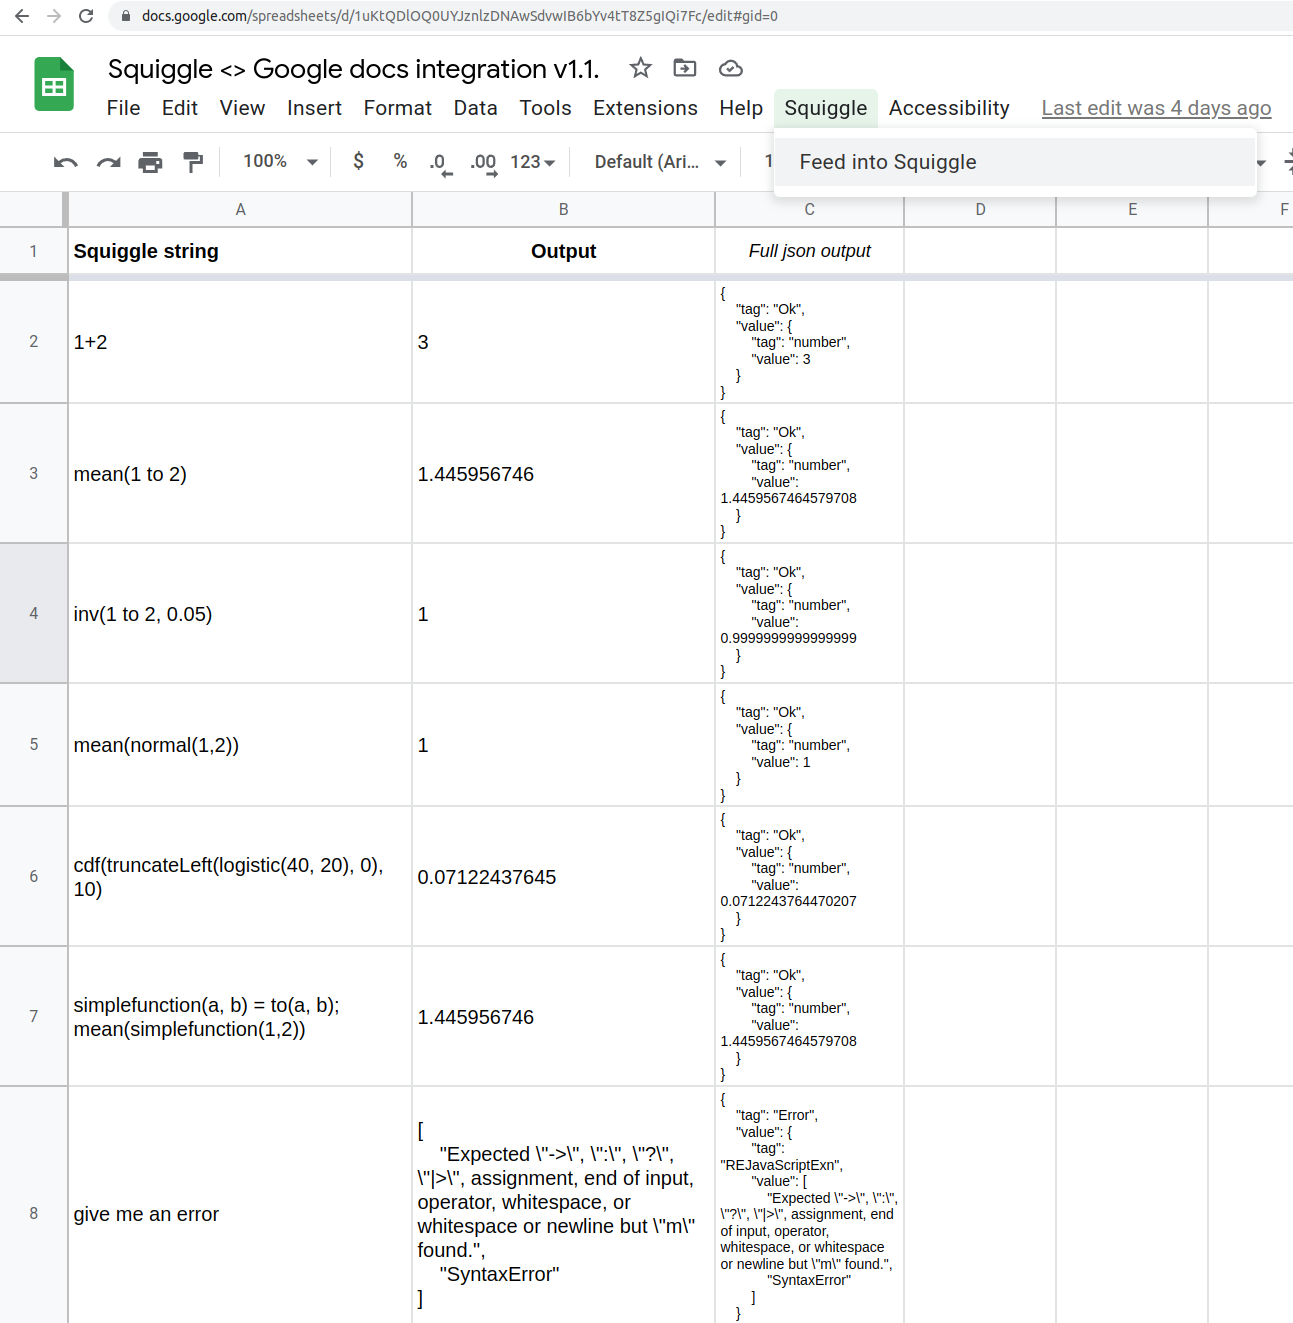
When working with multiple models, I’ve also found it useful to use Squiggle in Google sheets. To do so, make a copy of this spreadsheet, and allow app permissions. Edit the “Main” sheet, and click on “Squiggle” > “Feed into Squiggle” to compute models. If you have difficulties, read the “Instructions” sheet, or leave a comment.
So without further ado, the simple example models:
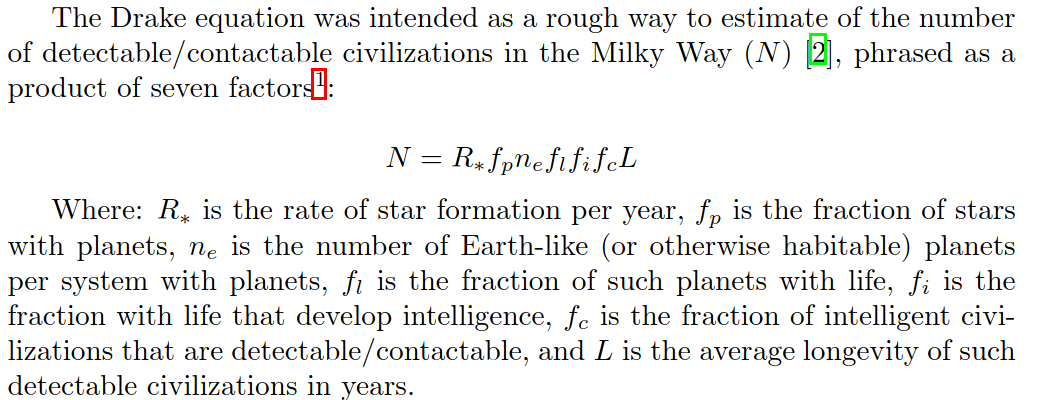
Page 2 of the paper defines the factors for the Drake equation:
Page 10 of the paper gives its estimates for the factors of the Drake equation:
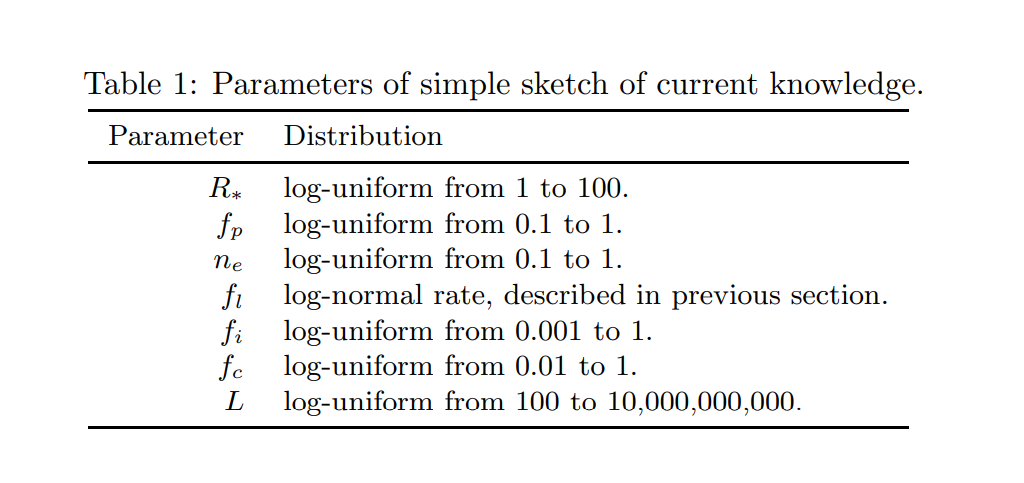
Because Squiggle doesn’t yet have the log-uniform probability distribution, we’re going to have to define it first. A log-uniform is a probability distribution whose log is a uniform distribution.
// Define the log-uniform
// (<https://en.wikipedia.org/wiki/Reciprocal_distribution>)
loguniform(a, b) = exp(uniform(log(a), log(b)))

// Estimates
rate_of_star_formation = loguniform(1,100)
fraction_of_stars_with_planets = loguniform(0.1, 1)
number_of_habitable_planets_per_star_system = loguniform(0.1, 1)
fraction_of_habitable_planets_in_which_any_life_appears = 1
// ^ more on this below
fraction_of_planets_with_life_in_which_intelligent_life_appears = loguniform(0.001, 1)
fraction_of_intelligent_planets_which_are_detectable_as_such = loguniform(0.01, 1)
longevity_of_detectable_civilizations = loguniform(100, 10000000000)

// Expected number of civilizations in the Milky way;
// see footnote 3 (p. 5)
n = rate_of_star_formation *
  fraction_of_stars_with_planets *
  number_of_habitable_planets_per_star_system *
  fraction_of_habitable_planets_in_which_any_life_appears *
  fraction_of_planets_with_life_in_which_intelligent_life_appears *
  fraction_of_intelligent_planets_which_are_detectable_as_such *
  longevity_of_detectable_civilizations

// Display
n
This produces the following estimate:
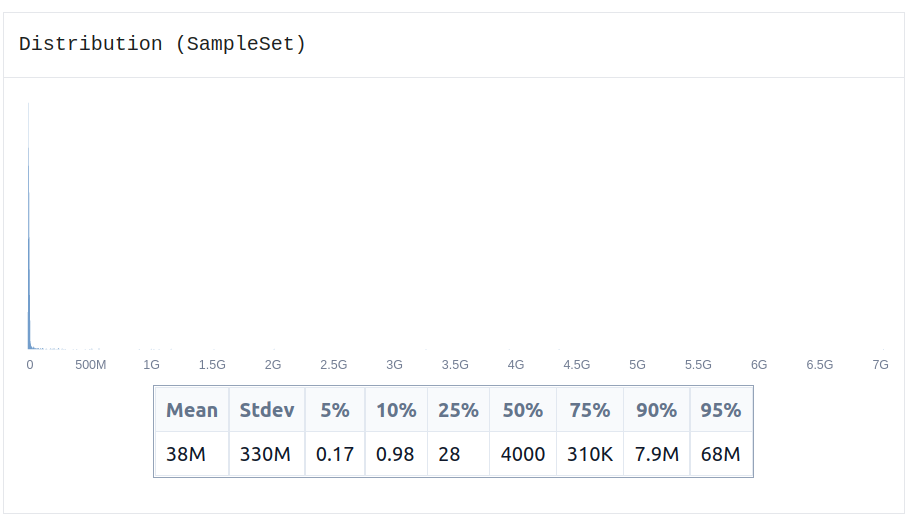
The estimate is fairly wide, but the model gives a 10%-ish chance that there is, in expectation, less than once civilization in the Milky Way. After updating on a bunch of observations, the paper raises that probability, hence the conclusion that the Fermi paradox has been “dissolved”.
Why did we set fraction_of_planets_in_which_any_life_appears to 1? Well, the paper considers an estimate of , where is distributed as a . But because ranges from very small numbers to very large numbers, they get collapsed to either 0 or 1 when going through , which produces some numerical errors when multiplying by 0. In addition, that estimate has been questioned.
So following a similar move in the paper, we can set that factor to a high value (in this case, to 1, meaning that all planets capable of life do host life). And then, when we notice that the probability of no other life in the Milky Way is still significant, the Fermi paradox will still have been somewhat dissolved, though to a lesser extent.
From here on, we could tweak the rate of life formation to other plausible estimates, like:
We could also question the other estimates, or notice that the uncertainty over the rate of life formation probably dominates other uncertainties.
Moving on to a slightly more complicated example, I was recently talking with someone who was thinking about various career pathways. To estimate the effectiveness of each opportunity, I created the following spreadsheet (project name and notes censored):
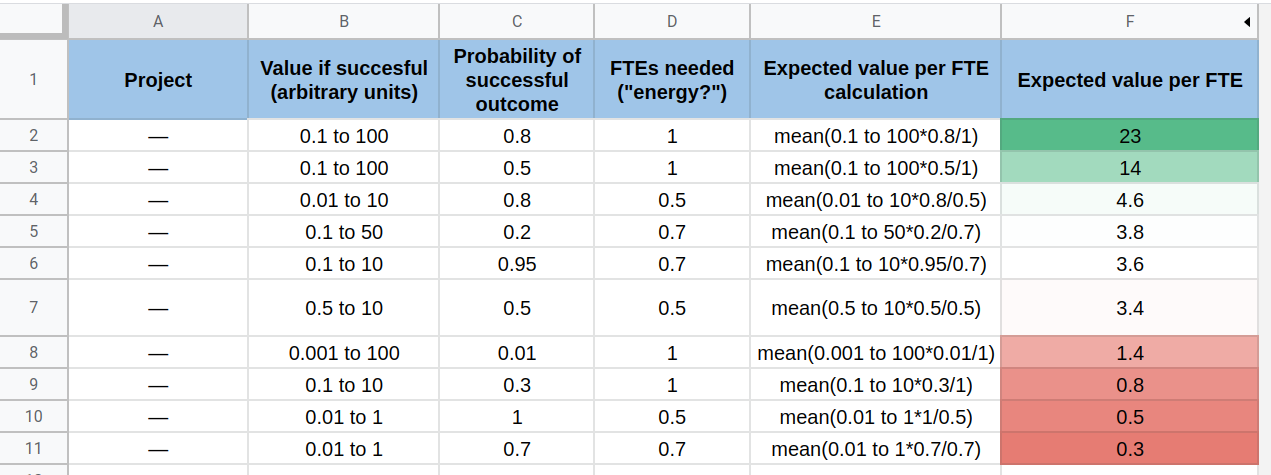
That is, I decomposed each job opportunity into:
I estimated each of the values, combined them as strings using a Google Sheets function, and then fed it to Squiggle using a copy of this Google spreadsheet. The whole thing took 10 mins. And the complexity in this example comes from integrating Squiggle with Google docs, which was annoying to set up but which shouldn’t be as annoying to use.
One interesting feature of these estimates is that the value estimates were relative, rather than using a concrete unit like QALYs. That is, the thing that has meaning is the ratio between the different values in that column, not the absolute values. In this case, this makes estimates much, much quicker to produce, but more error-prone, and harder to interpret, improve, or disagree with.
A logic model (I also use pathway to impact as a synonym for this) is a chain between inputs and outcomes, which at its simplest might look as follows:
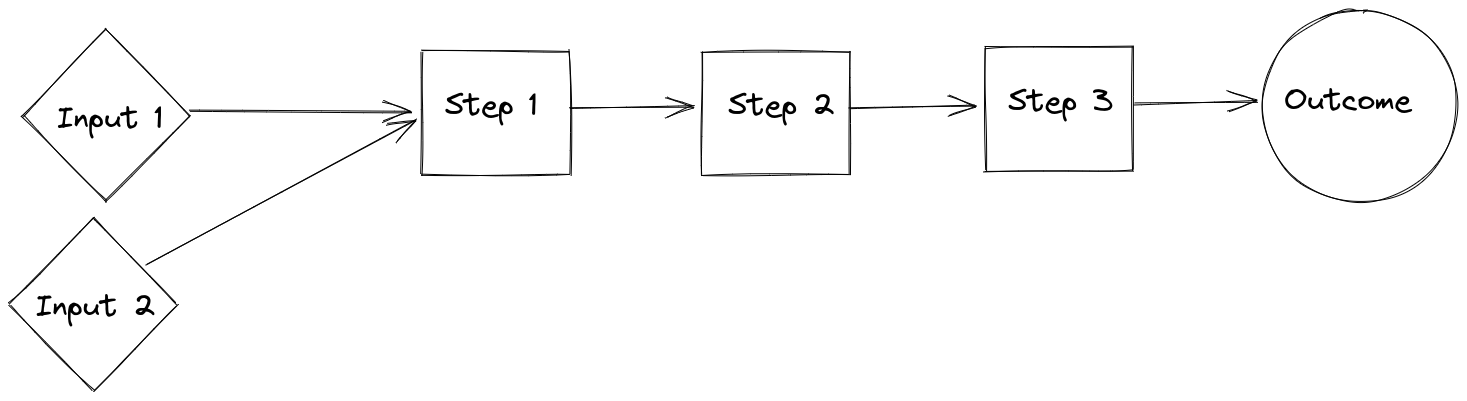
When doing quick estimates, we can keep this pathway to impact implicit. But when working with slightly more complex models, it can be worth it to write it explicitly. I’ve been using excalidraw for this, and I would recommend it.
For example, when calculating the chance that a nuclear bomb hits London, we can draw a logic model like:
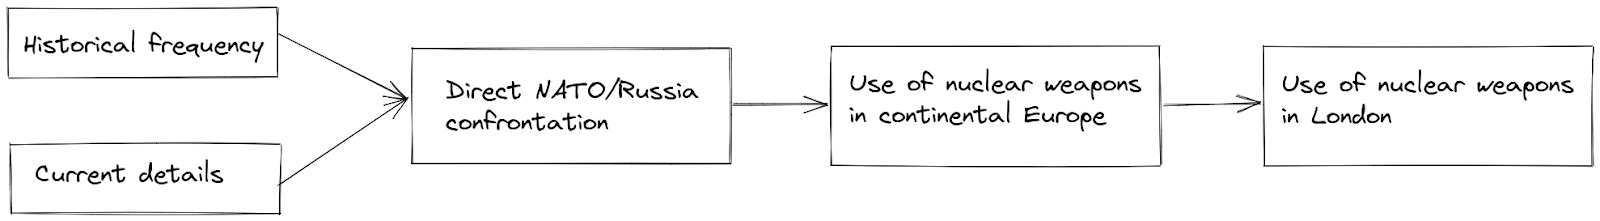
To get a sense of the historical frequency, we can use Laplace’s rule of succession. Per Wikipedia on Russia–NATO relations, the one direct NATO/Russia incident was the shootdown of a Russian plane by Turkish forces in 2015. Putting numbers on this, we have:
num_years_NATO_Russia_relations = 2022 - 1991
num_years_with_direct_confrontation = 1
laplace(successes, failures) = (successes + 1)/( successes + failures + 2) // this is a function!

[
  laplace(num_years_with_direct_confrontation,
  num_years_NATO_Russia_relations), laplace(0, num_years_NATO_Russia_relations)
] // this is an array

// [ 0.0588, 0.0303 ] = [ 5.88%, 3.03% ]
That is, if we count the Turkish incident as a “confrontation”, the base rate implied by Laplace’s rule would be 5.88%, and if we don’t, it would be 3.03%. See also some more discussion about possible confrontations here. I think that when I’m thinking of a direct NATO/Russia confrontation, I’m thinking more of NATO’s Article 4 being invoked.
In any case, giving some numbers I think are plausible, we would have something like:
chance_of_direct_nato_confrontation = 0.005 to 0.05
and_use_of_nuclear_weapons_in_Europe = 0.01 to 0.2
and_use_of_nuclear_weapons_in_London = 0.05 to 0.3


use_of_nuclear_weapons_in_London = chance_of_direct_nato_confrontation *
  and_use_of_nuclear_weapons_in_Europe *
  and_use_of_nuclear_weapons_in_London

yearly_probability = mean(use_of_nuclear_weapons_in_London)
monthly_probability = 1 - (1 - yearly_probability)^(1/12) // roughly
This produces an estimate of ~0.02% per year, or 0.0016% per month. We can then transform these into expected hours lost:
remaining_life_expectancy_in_years = 40 to 60
days_in_a_year = 365
hours_in_a_day = 24

expected_lost_hours = monthly_probability * remaining_life_expectancy_in_years * days_in_a_year * hours_in_a_day

{
    expected_lost_hours: expected_lost_hours,
    mean_expected_lost_hours: mean(expected_lost_hours)
} // this is a record
The last four lines are a record. It is telling Squiggle two things:
This produces the following output:
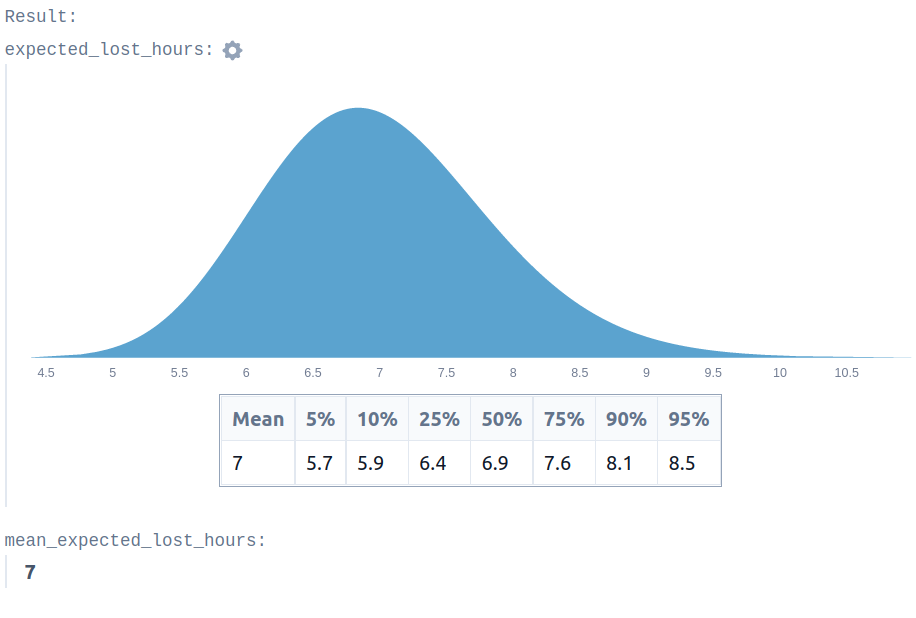
From here, we could refine these estimates, or add some probability of getting out of London before a bomb hits.
In this model, we had a few moving parts, so now seems like a good time to mention that we can link to a squiggle model directly by copying the link which the playground produces when edited.
Metaculus has a question on a Bilateral Ceasefire between Russia & Ukraine. The question asks about two different things:
We can use Laplace’s rule of succession for both cases, first to estimate the likelihood that a ceasefire starts, and then to estimate whether it will last. For the latter, we will make the Laplace prediction, but also look at a list of ceasefires to estimate the historical frequency of success.
For the likelihood that a ceasefire will start:
// Likelihood that a ceasefire will start
numSuccesses = 0 // no ceasefire so far
numFailures = 138 // days since the 24th of February
numFutureTrials = 172 // days until end of year
laplaceSuccessByNthTrial(successes, failures, numFutureTrials) = {
numTrialsAlready = successes + failures
numTrialsAtTheEnd = numTrialsAlready + numFutureTrials
pAllFailures = (failures + 1) / ( numTrialsAtTheEnd + 1)
// e.g., 10 trials, 10 failures, 0 successes
// then probability of one additional failure is:
// 11/12
// and the probability of three additional failures is:
// 11/12 * 12/13 * 13/14 = 11 / 14 = (failures + 1) / ( numTrialsAtTheEnd + 1)
// e.g.: 3/4 * 4/5 * 5/6 * 6/7 * 7/8 = 3/8
1 - pAllFailures
}
chance_of_ceasefire = laplaceSuccessByNthTrial(numSuccesses, numFailures, numFutureTrials)
And for the likelihood that a ceasefire, once started, lasts, we are going to do some textbook outside view aggregation with the “mixture” function.
// Likelihood that a ceasefire lasts
// per laplace
laplace(successes, failures) = (successes + 1)/( successes + failures + 2)
chance_ceasefire_lasts_laplace = laplace(0,0)
// per dataset of ceasefires
// (<https://docs.google.com/spreadsheets/d/1ufNP_iuTghzKGUCRPMoLY4-c9PibiNlVFEaAxyAad-A/edit#gid=315186780>)
chance_ceasefire_lasts_historical = 0.3130434783
// per dataset of ceasefires, restricted to Soviet conflicts (same link)
chance_ceasefire_lasts_historical_russian = 0.4
// per brief literature review (same link)
chance_ceasefire_lasts_lit_review = 0.6392156863
// overall guess
distribution_ceasefire_lasts = mixture(chance_ceasefire_lasts_laplace, chance_ceasefire_lasts_historical, chance_ceasefire_lasts_historical_russian, chance_ceasefire_lasts_lit_review, [0.25, 0.3, 0.3, 0.15]) // instead of mixture(...), we can also use mx(...), which is the same but shorter.
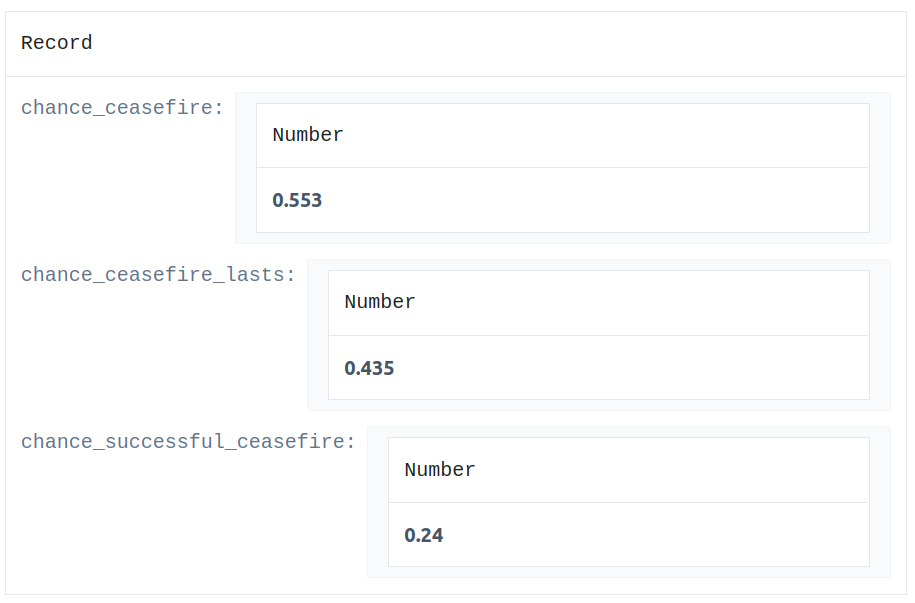
chance_ceasefire_lasts = mean(distribution_ceasefire_lasts)Putting this all together, we get:
// Result
chance_successful_ceasefire = chance_of_ceasefire * chance_ceasefire_lasts
// result: 0.256 = 25.6%

// Display
{
  chance_of_ceasefire: chance_of_ceasefire,
  chance_ceasefire_lasts: chance_ceasefire_lasts,
  chance_successful_ceasefire:chance_successful_ceasefire
}
We have looked at some simple models and produced some estimates of things we might care about. But this amount of complexity hasn’t exhausted the number of things we can estimate.
In particular, we haven’t yet looked at:
An upcoming blog post will look at these complications. Readers might also want to browse the Squiggle EA Forum tag, which has begun to fill up with some neat estimates.

This post is a project by the Quantified Uncertainty Research Institute (QURI).


I had a crack at doing the Fermi Paradox calculations using vanilla JS for benchmarking. Took maybe 5 minutes to build reusable probabilistic estimation functions from scratch. On that basis, it doesn't look to me like it would be worth the effort of learning a new syntax.
However, what took me almost all day was trying to get a nice visualisation of the probability distribution I came up with. I would like to be able to zoom and pan, hover over different x-values to get the PDF or CDF as a function of x, and maybe vary model parameters by dragging sliders. IMO, this is the real advantage of a probabilistic reasoning web-app.
After like 6 hours, I came up with a janky prototype which has zooming and a hover tooltip on a CDF.
Very messy code here: https://github.com/hamishhuggard/interactive-CDF/blob/main/fermi.html
PS: I hear QURI is hiring? Can I use this as a work trial? :P
I like the chutzpa. Up to Ozzie, but most likely not.
Lol. Not bad for 60% joking.
PS, here's the code actually deployed: https://hamishhuggard.com/misc/fermi.html