I was surprised I couldn't find a graph like this already on the forum, so I made one and thought I would share it:
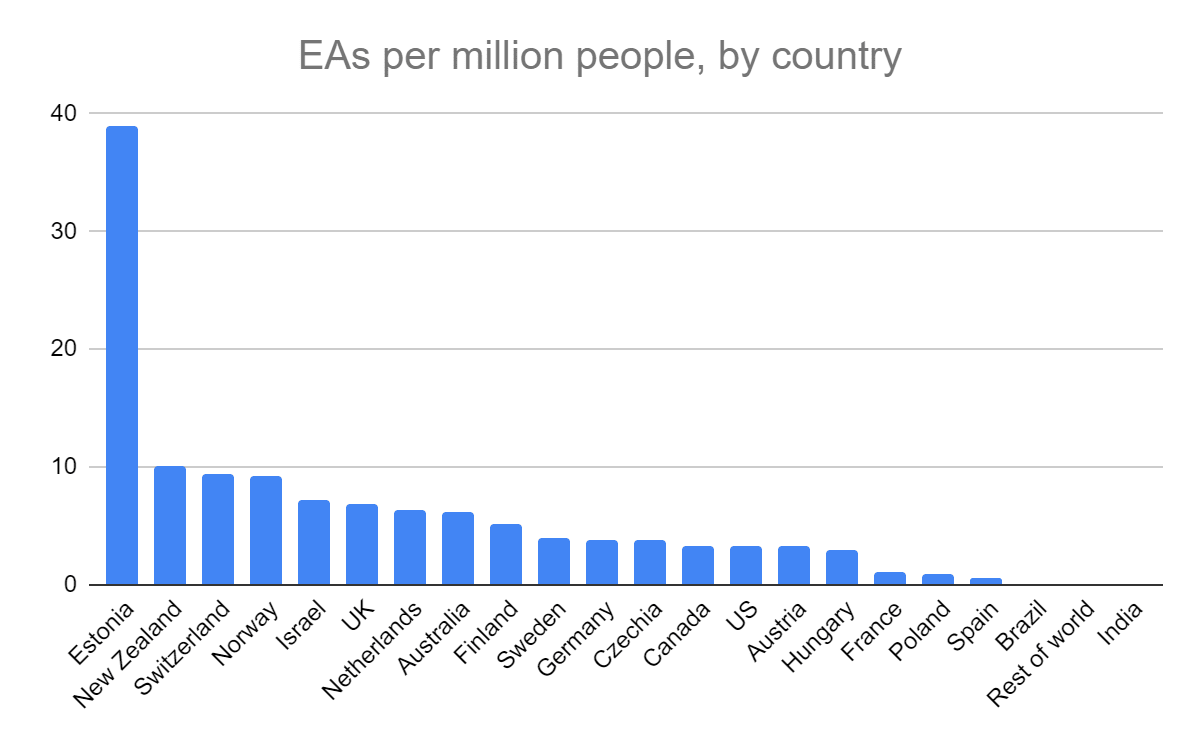
The data is from the 2022 EA survey,[1] and here is my sheet.
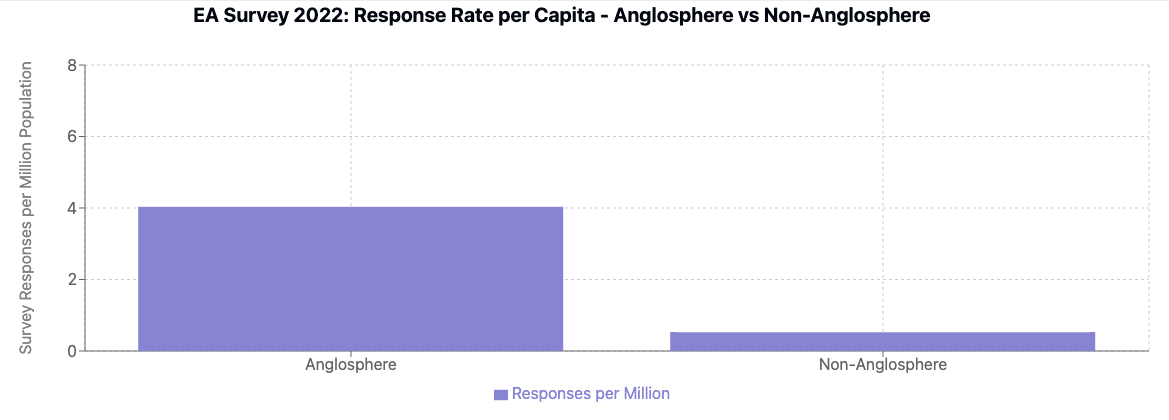
The main surprising thing to me is that English-speaking countries are less dominant than I expected, in this per capita framing. My vague sense was that the EA community was notably more popular in the Anglosphere than even in other rich countries, but eyeballing this data makes me think I was wrong: Northern/Western Europe seems to have quite comparable rates of EAs.
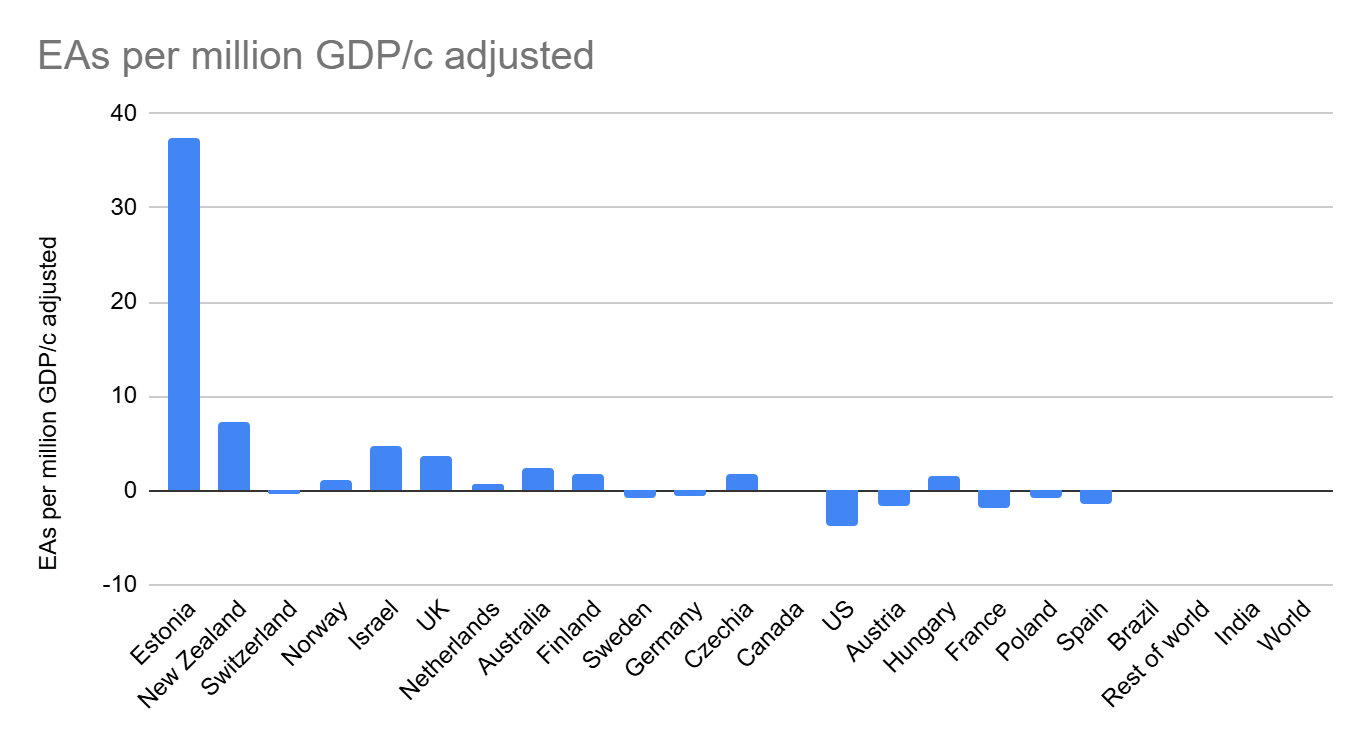
And what on earth is happening in Estonia? Perhaps some Estonian EAs can tell us all what you are doing that works so well!
- ^
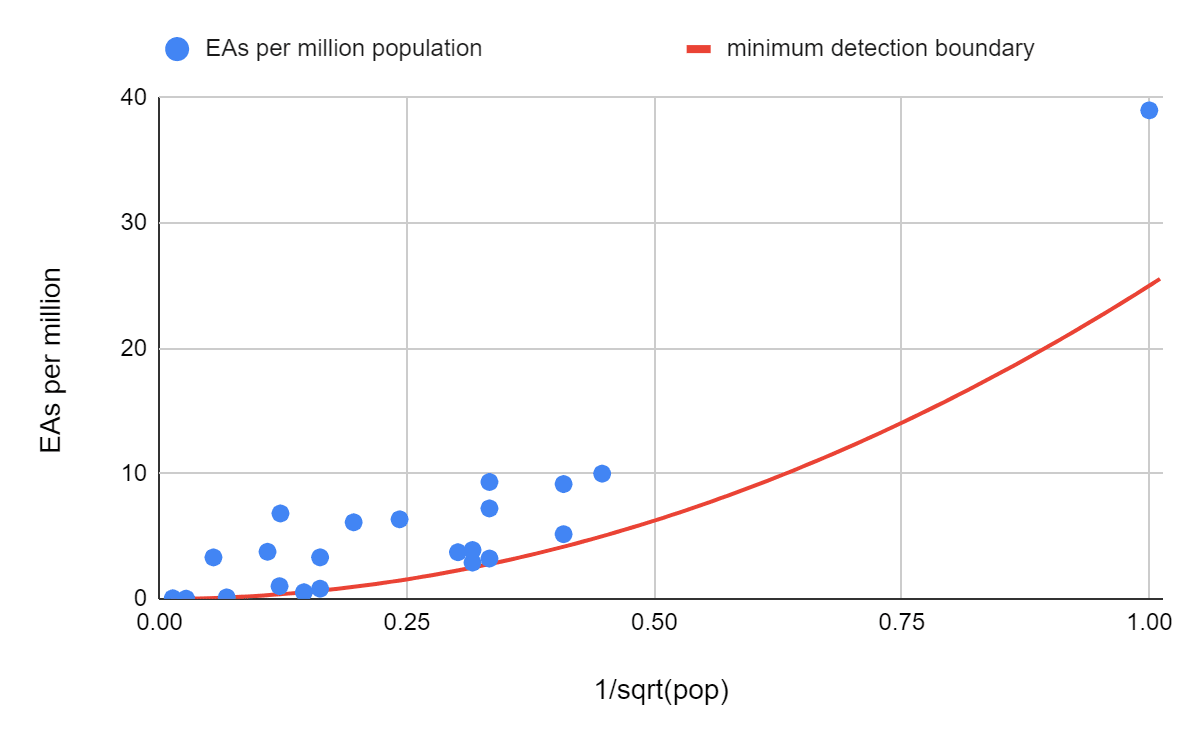
Maybe there are quite different response rates by country, and this could explain some of the variance but I assume there isn't a large or systematic effect here.
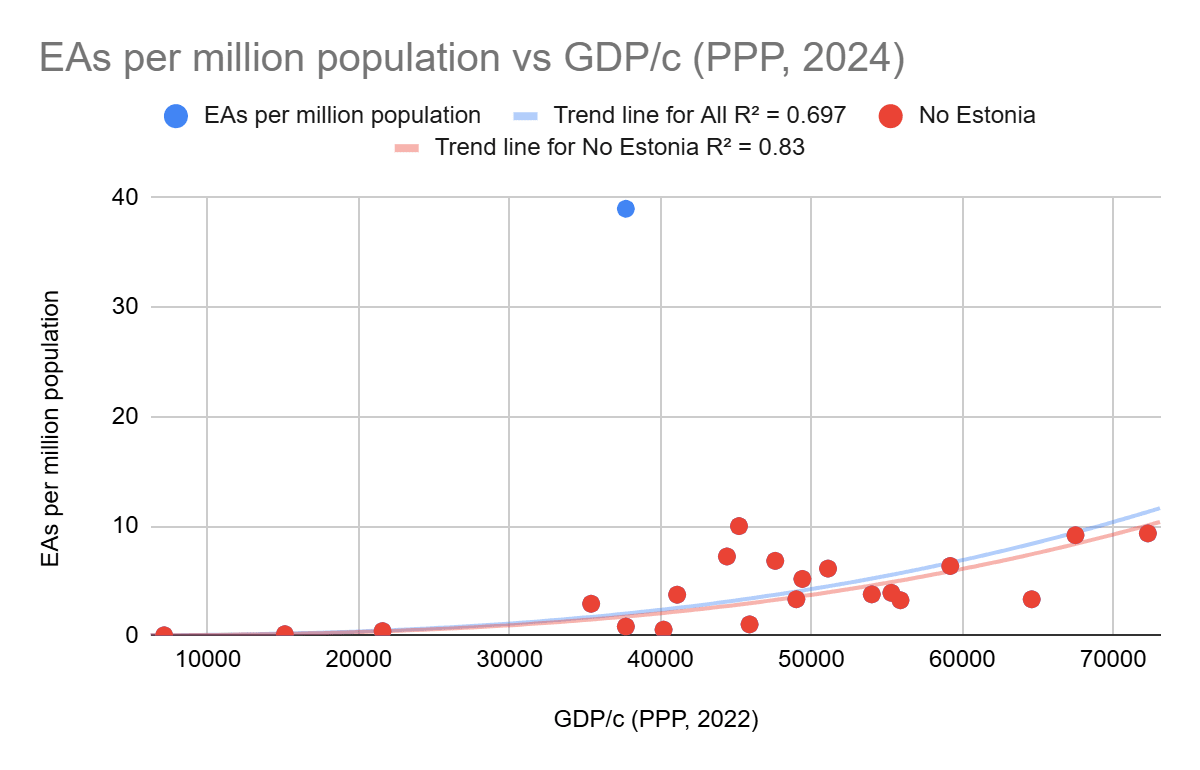
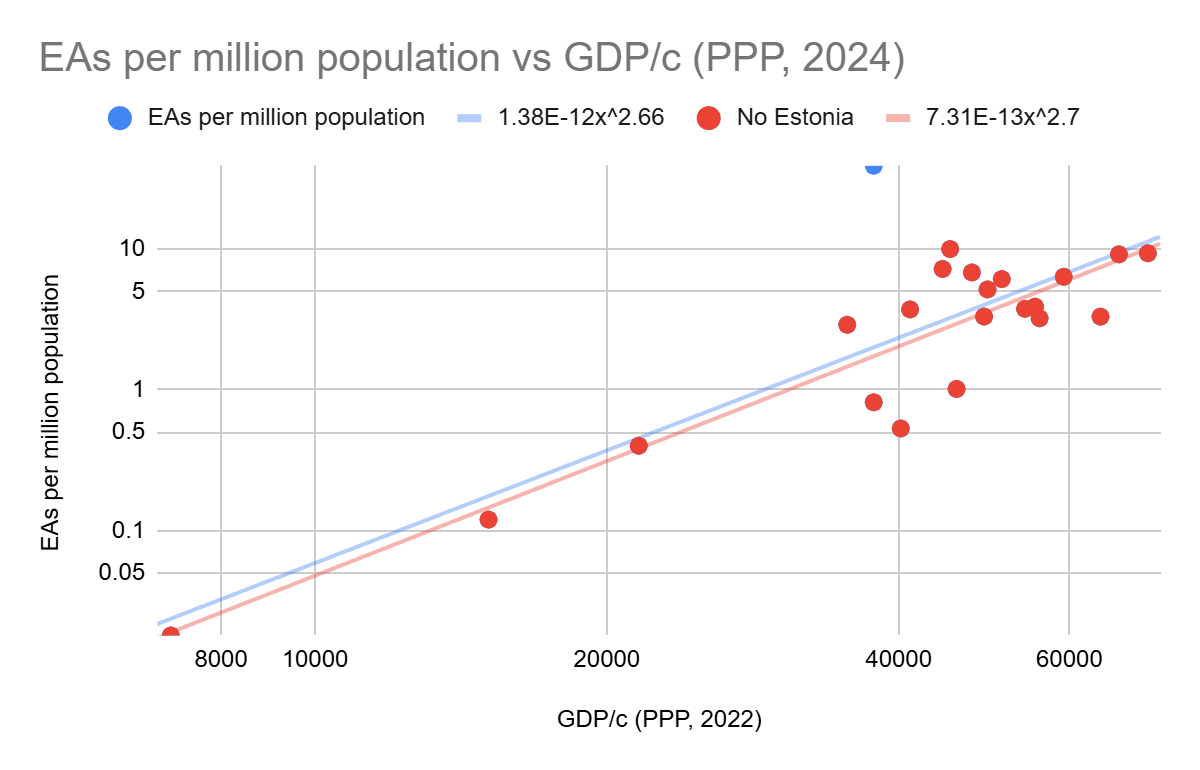
GDP per capita predicts most of the variance in EAs per million population. Estonia is a clear outlier, R^2 is higher with it excluded.
How about the ratio of community age (or exp(community age)) to national population? See this comment
Instead of trying to identify a founding date for every country's EA community, maybe you could look at the year when it surpassed, say, 20 people in the survey. That data should be easier to find, and could also help address the issue of early false starts.
BTW I happened to see this comment which gives some interesting thoughts regarding why attrition in LMICs with small EA communities could be high. So my overall hypothesis at this point would be somet... (read more)