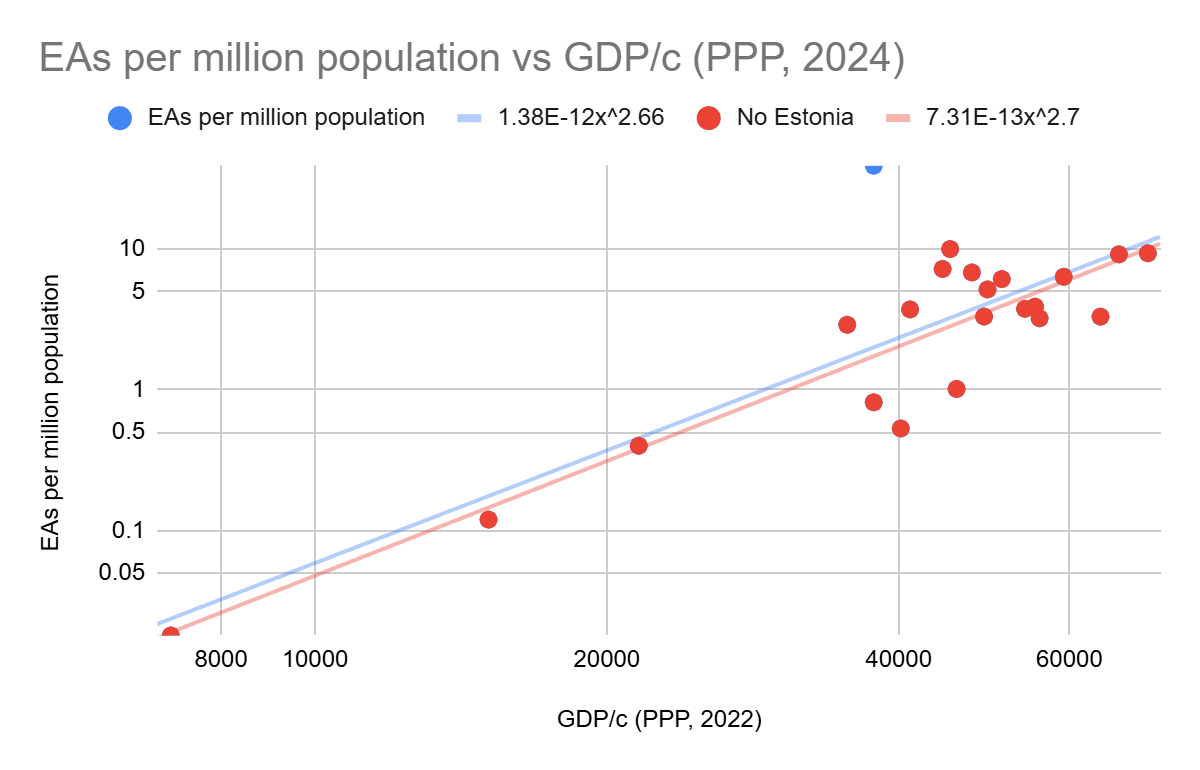
I was surprised I couldn't find a graph like this already on the forum, so I made one and thought I would share it:
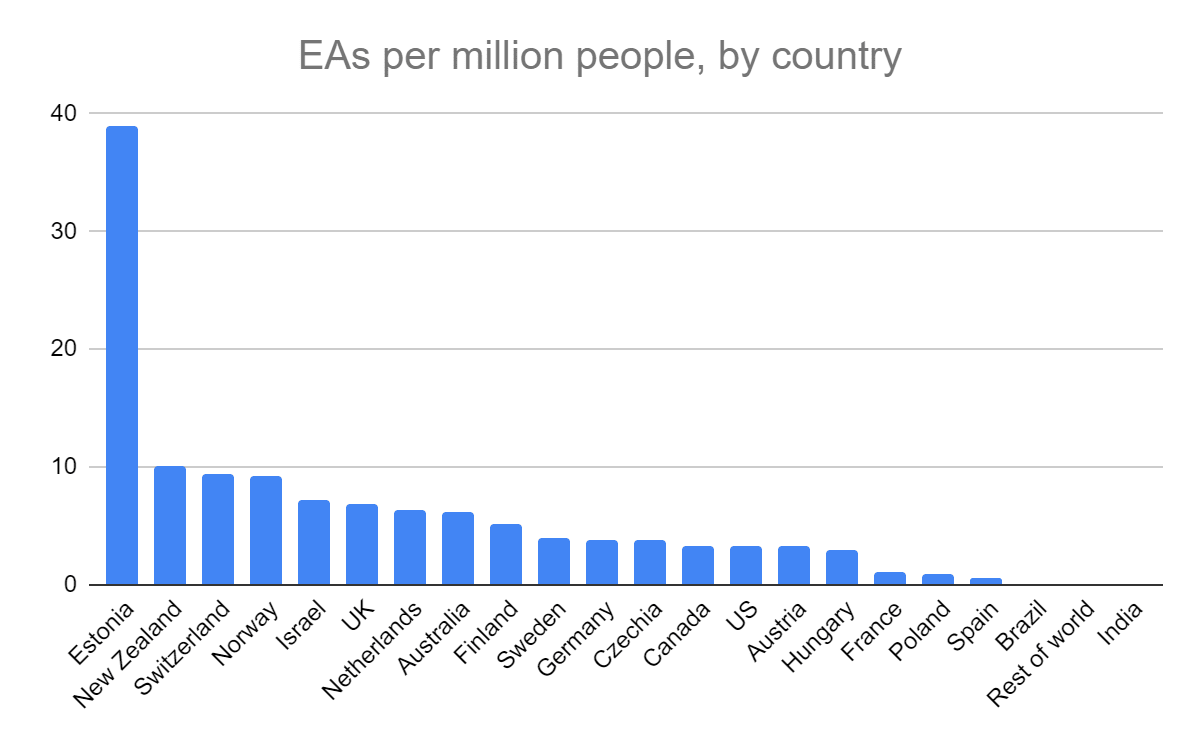
The data is from the 2022 EA survey,[1] and here is my sheet.
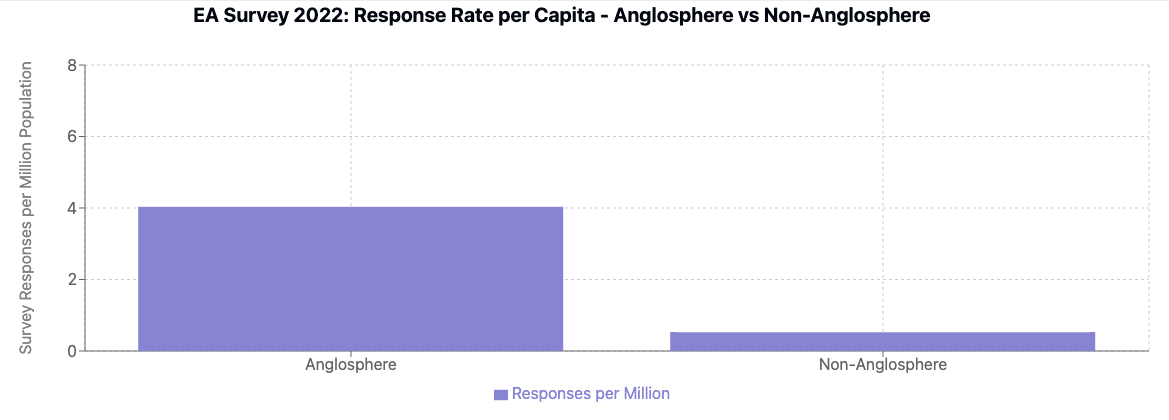
The main surprising thing to me is that English-speaking countries are less dominant than I expected, in this per capita framing. My vague sense was that the EA community was notably more popular in the Anglosphere than even in other rich countries, but eyeballing this data makes me think I was wrong: Northern/Western Europe seems to have quite comparable rates of EAs.
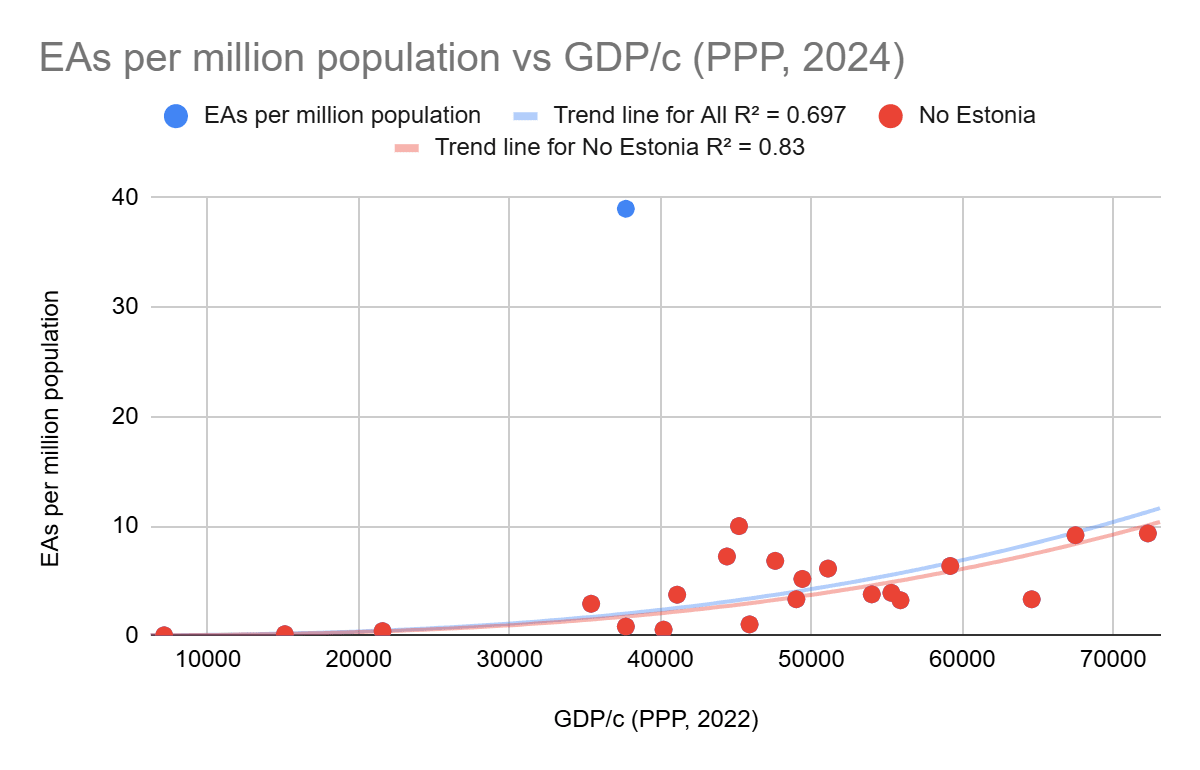
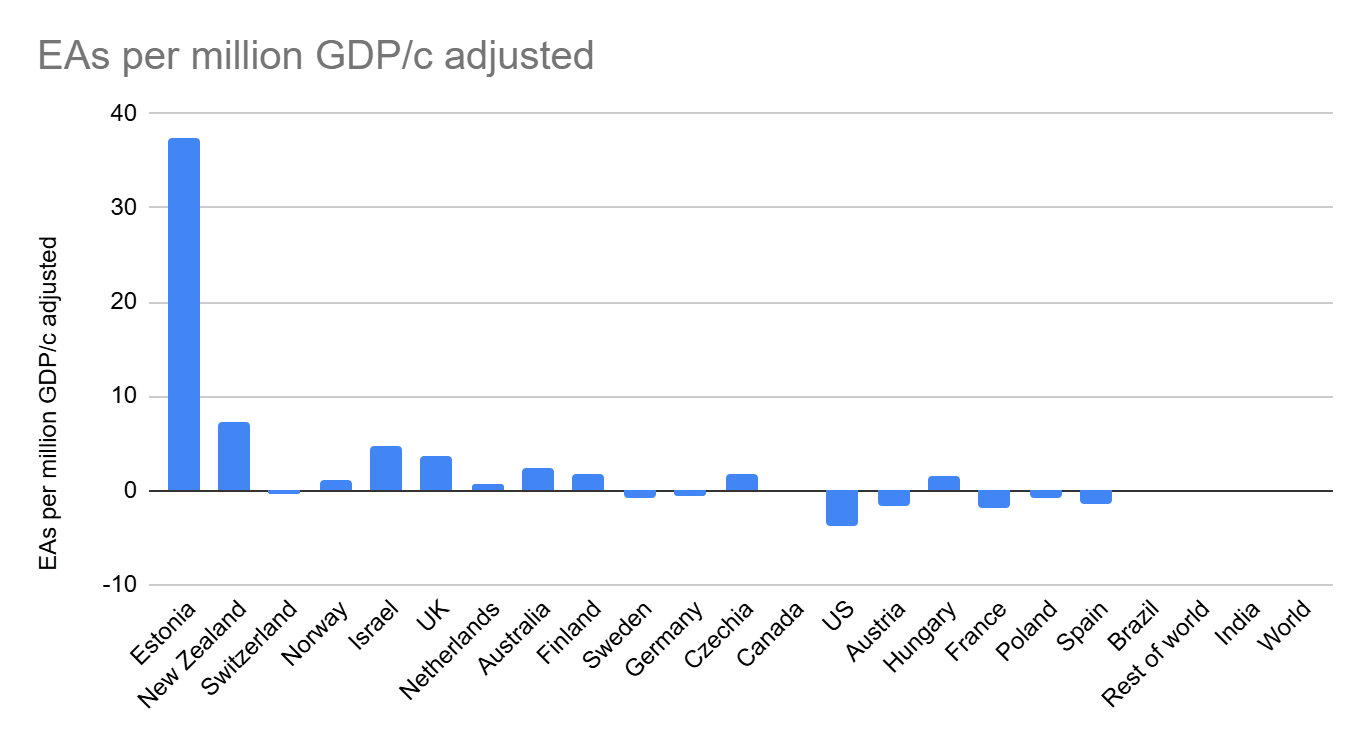
And what on earth is happening in Estonia? Perhaps some Estonian EAs can tell us all what you are doing that works so well!
- ^
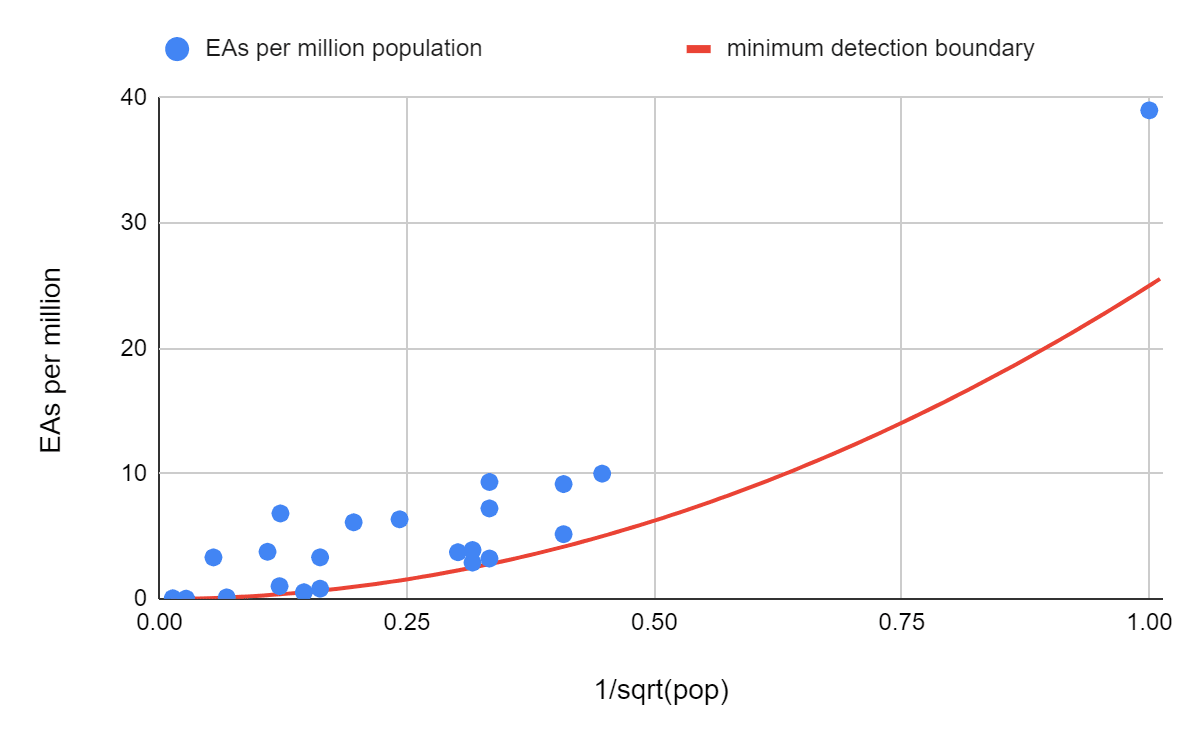
Maybe there are quite different response rates by country, and this could explain some of the variance but I assume there isn't a large or systematic effect here.
Yeh, as we note here:
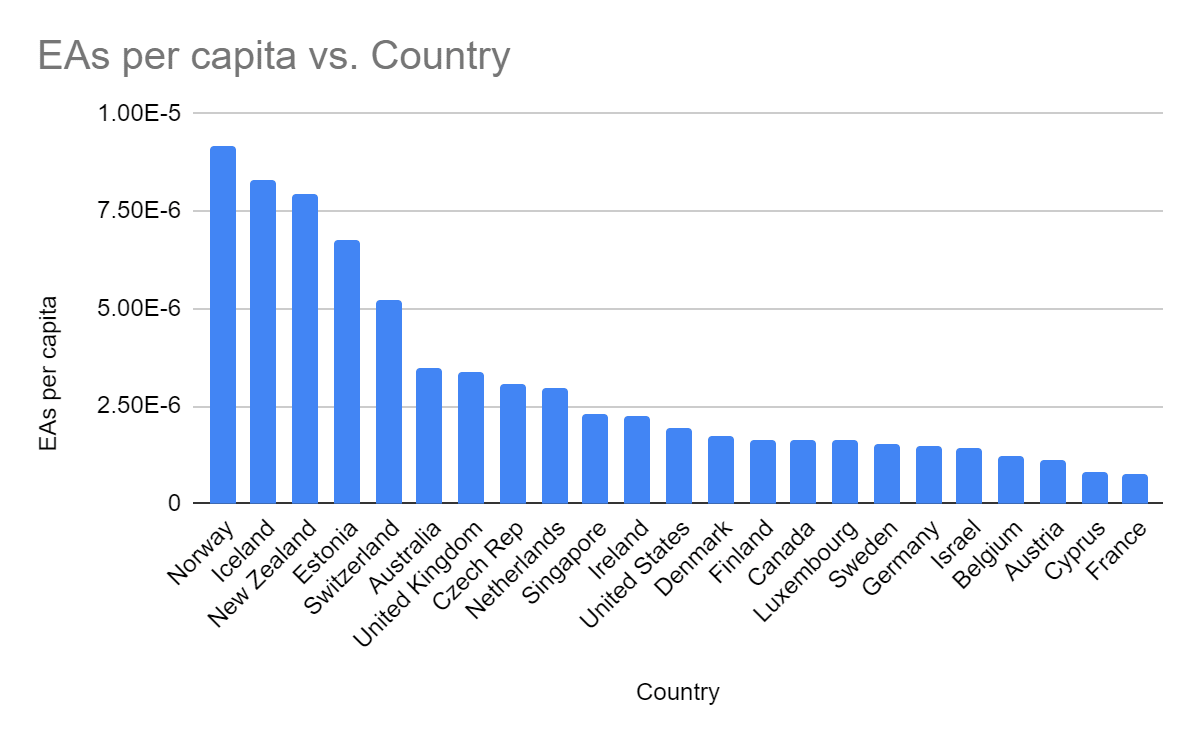
The last time we reported this was 2020, with the caveat that "Iceland, Luxembourg and Cyprus, nevertheless have very low numbers of EA (<5) respondents. This graph doesn't leave out any countries with particularly high numbers of EAs, in absolute terms, though Poland and China are missing despite having >10."
We'll discuss the details more in the post we are putting together on this (hoping to release this month), but there is indeed quite a lot of noise when you look at EAs per capita, and in particular the highest EAs per capita countries, due to small populations and small numbers of respondents, often close to zero (e.g. small countries can jump in and out of the top rankings based on having 5 or 0 respondents in a year). In the full post we'll additionally examine results for composites of years (e.g. 2020-2022), and which countries outperform what a model would predict (though that will be heavily caveated).