I was surprised I couldn't find a graph like this already on the forum, so I made one and thought I would share it:
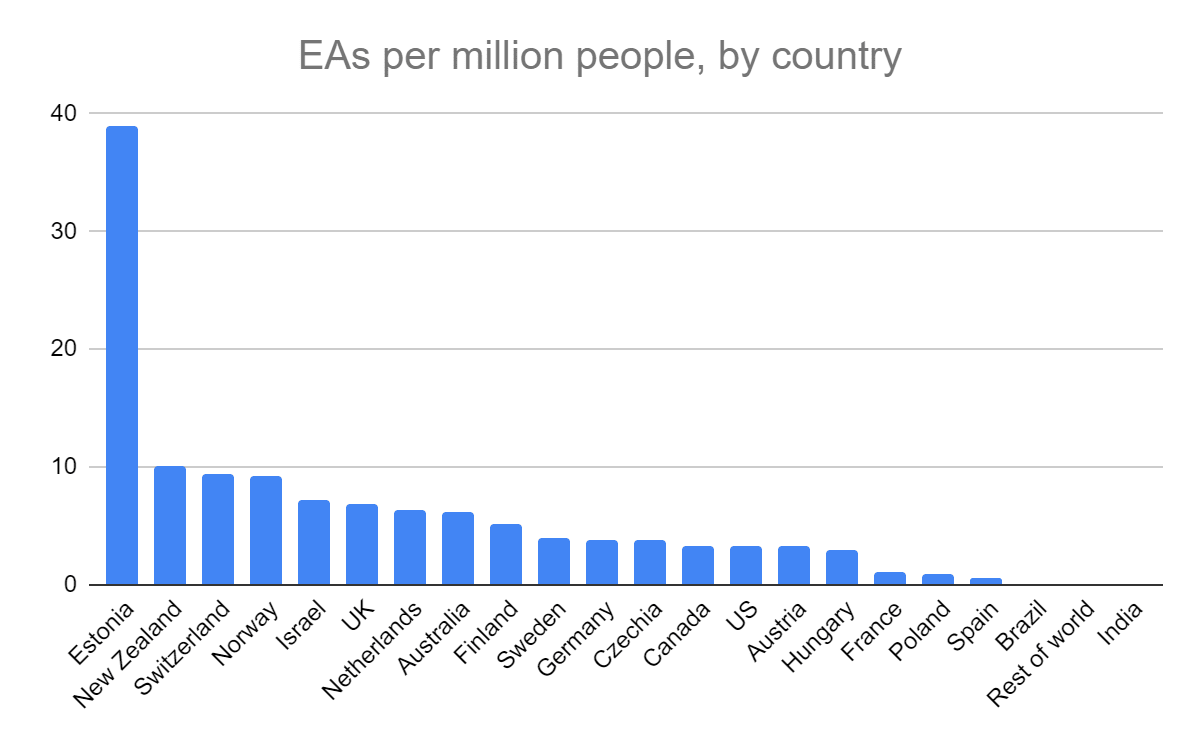
The data is from the 2022 EA survey,[1] and here is my sheet.
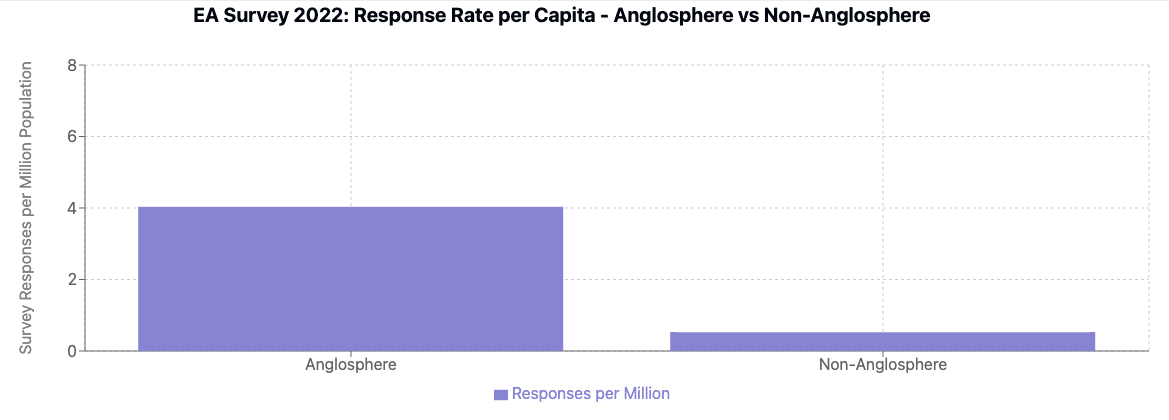
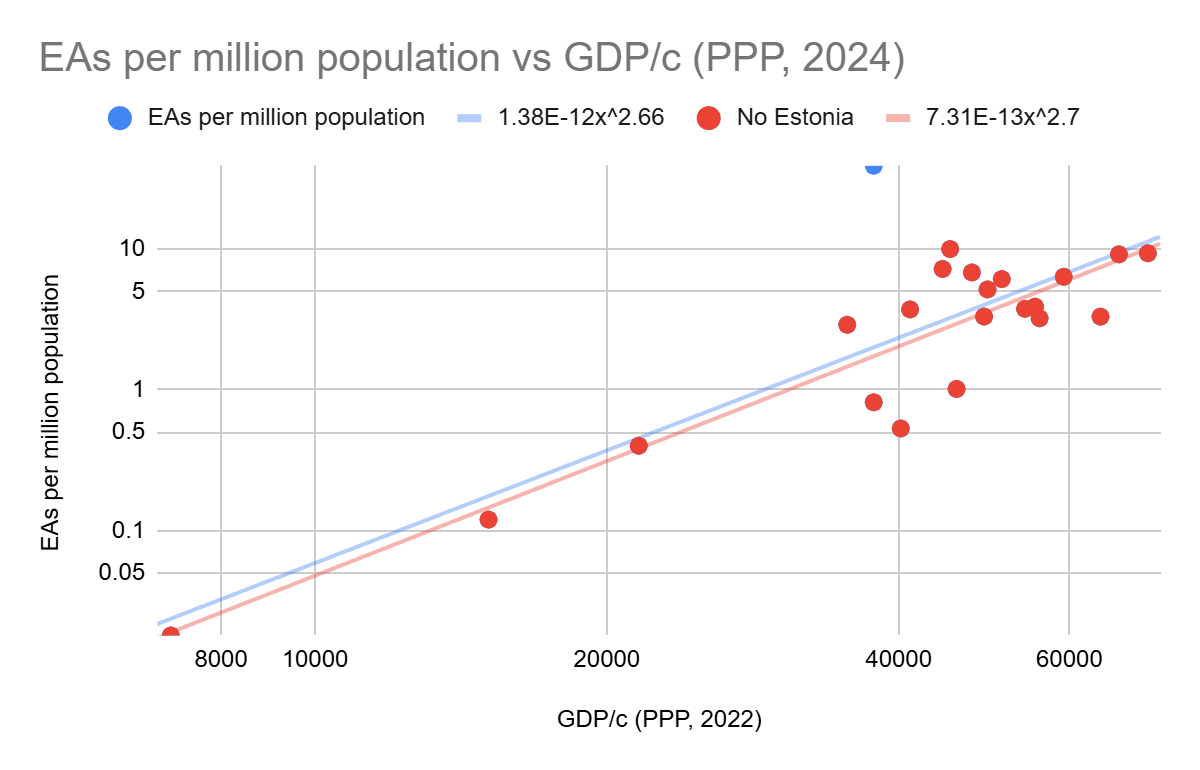
The main surprising thing to me is that English-speaking countries are less dominant than I expected, in this per capita framing. My vague sense was that the EA community was notably more popular in the Anglosphere than even in other rich countries, but eyeballing this data makes me think I was wrong: Northern/Western Europe seems to have quite comparable rates of EAs.
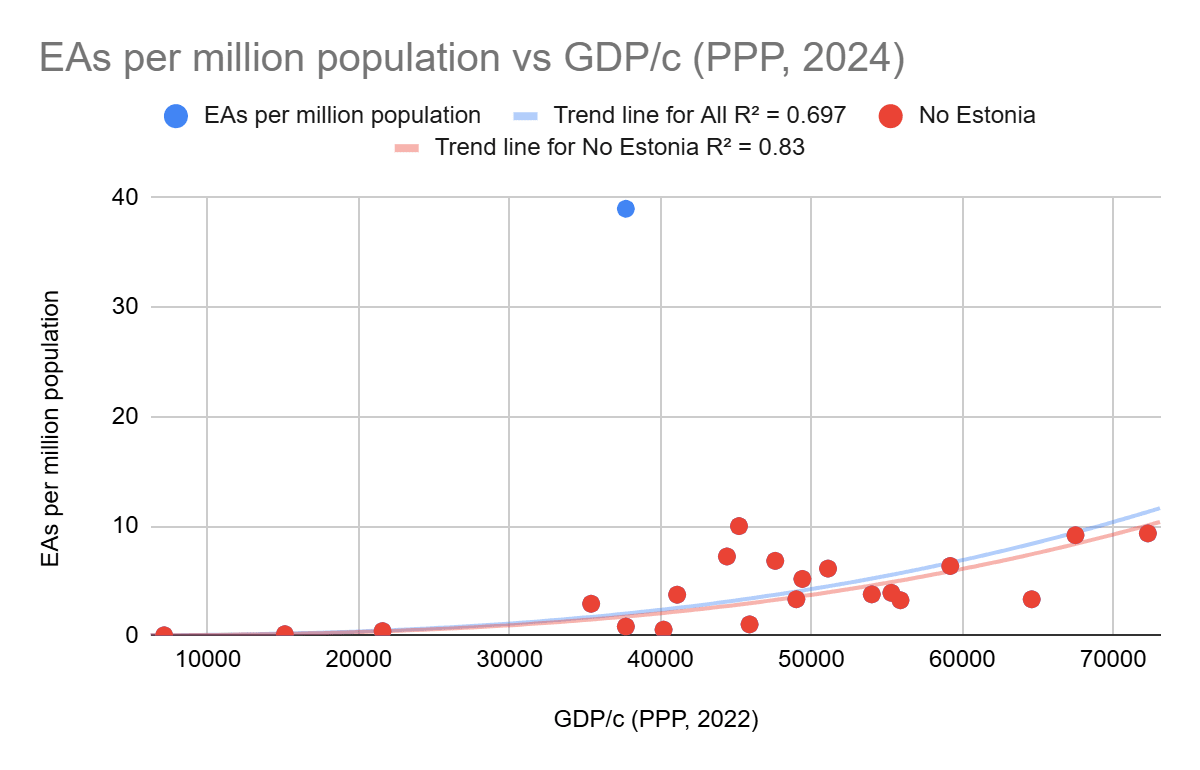
And what on earth is happening in Estonia? Perhaps some Estonian EAs can tell us all what you are doing that works so well!
- ^
Maybe there are quite different response rates by country, and this could explain some of the variance but I assume there isn't a large or systematic effect here.
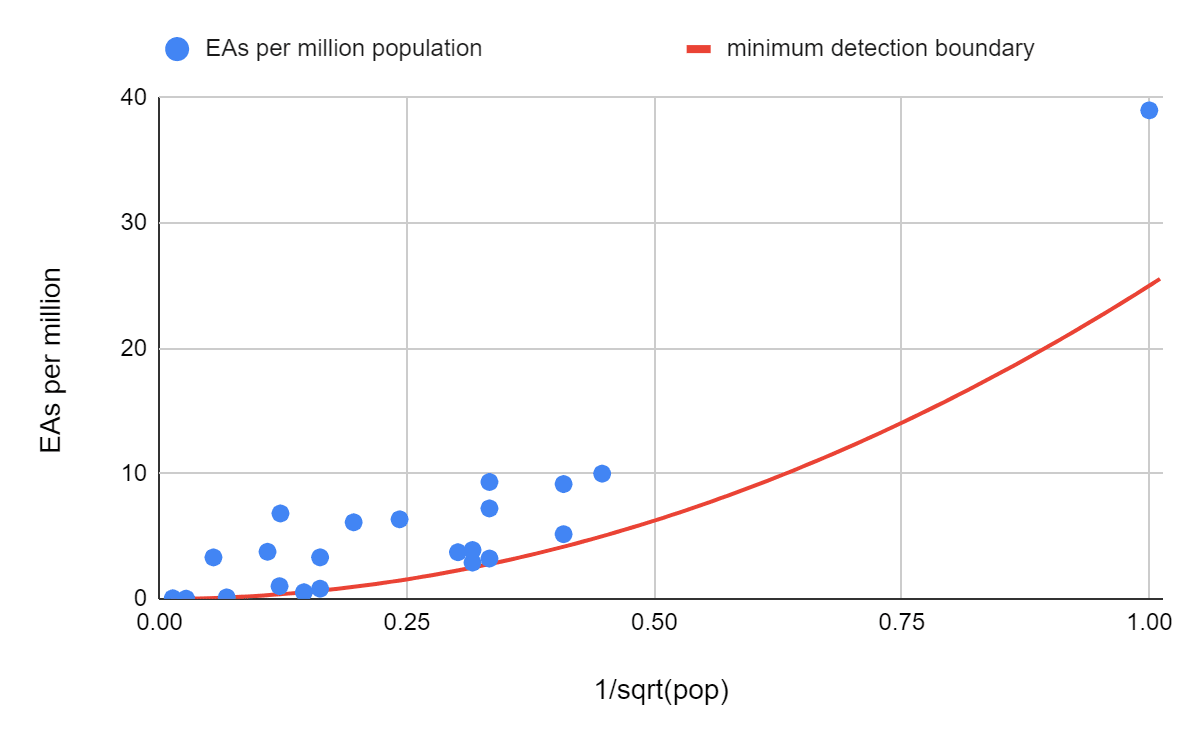
This is great! I think the survey team didn't do a per capita visualisation because response rates will probably vary a lot between countries for reasons other than the number of EAs per capita.
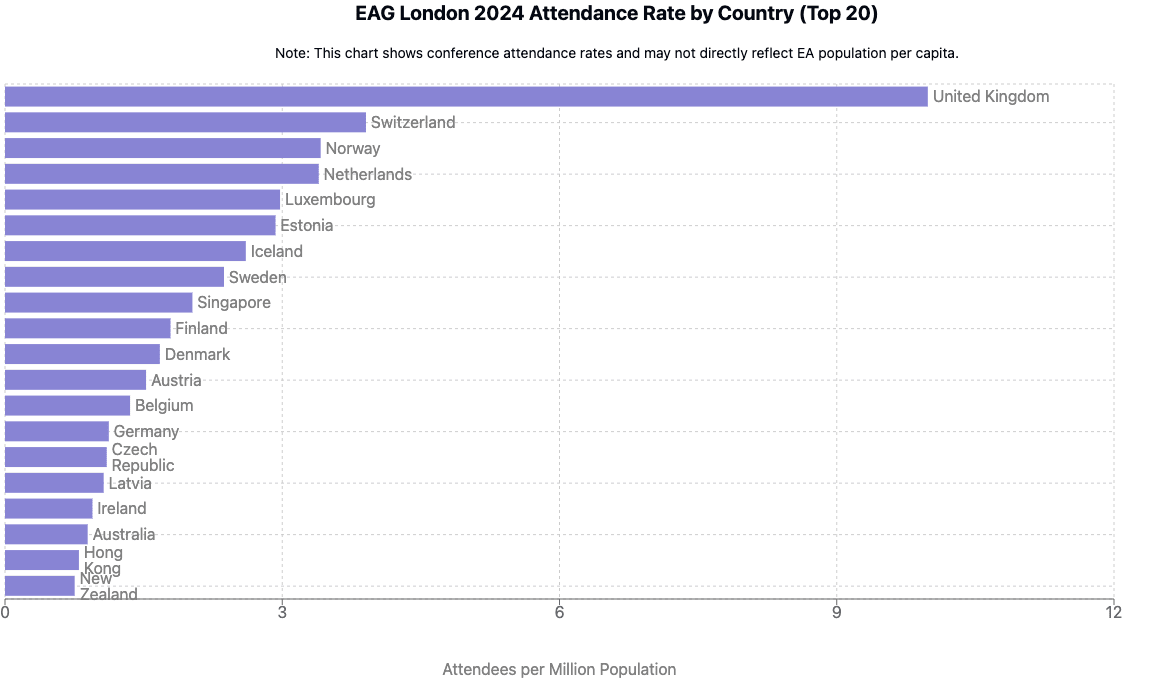
To provide another data point, @Alix Pham from EA Switzerland put together a sheet with attendees per capita for EAG London this year and just now I made a quick chart.
Obviously, due to the location of the event, some countries will be over-represented and others under-represented, but I think it might be a more accurate representation of per capita rates in Europe (with the exception of the UK).
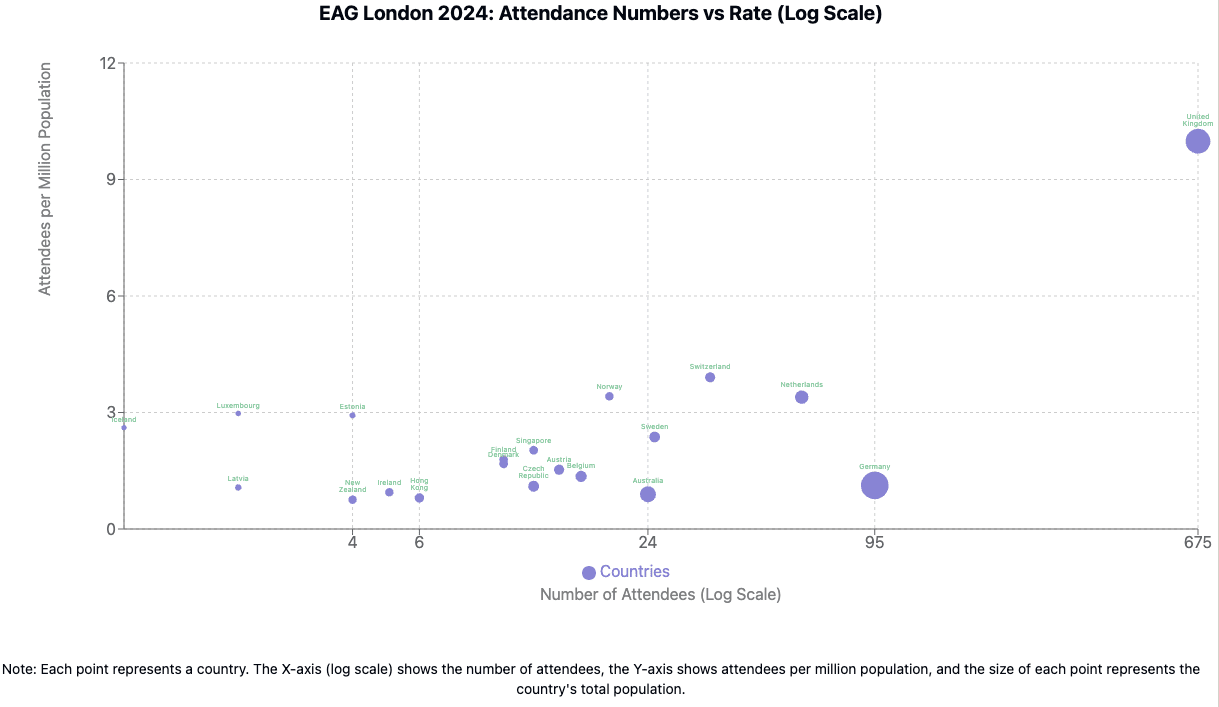
NB some of these countries have a very low number of attendees, e.g. Iceland only had one attendee. I made the below to visualise this.
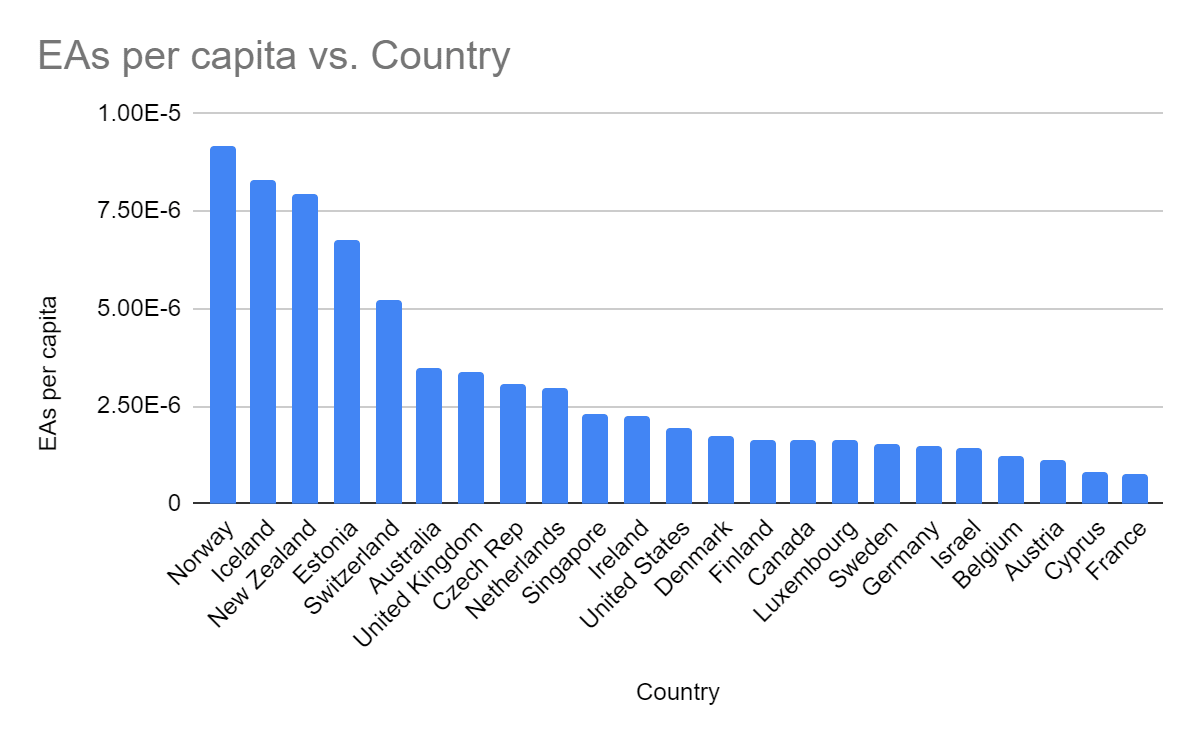
Yeh, as we note here:
The last time we reported this was 2020, with the caveat that "Iceland, Luxembourg and Cyprus, neverth... (read more)