Late Edit: This post received way more attention than I expected. For important context, please see David Moss's first comment, especially his helpful visualization. "One thing worth bearing in mind is that these are very small proportions of the responses overall..." I am ultimately talking about small groups of people within the total number of survey respondents, and although I think my claims are true, I believe they are trivially so; I created this post largely for fun and practice, not for making important claims.
Note to EA Forum users: Please pardon the introductory content; this post is for sharing with my classmates and professors who are otherwise unaware of the EA movement.
Content warning: Frequentist statistics
The effective altruism community is a group of nerds, but instead of nerding out about train engines, Star Wars, or 18th-century sword-fighting, they nerd out about one question: Given limited resources and all of humanity's accumulated knowledge about the social and physical sciences, what is the most cost-effective way to improve the world?
While the focus began on figuring out which charity is the best place to spend your marginal dollar, and much work still focuses on how to do that, the EA community has expanded to questions of how analytic, altruistic-minded people should best allocate their time and social capital, as well.
People in the community have settled on several possible answers to the question, "Of all the problems to work on, what should members of the EA community focus on the most?" Some examples of those answers include improving animal welfare, global poverty reduction, and improving biosecurity measures against engineered or accidental pandemics. (Notably, members of the community personally prepared for COVID weeks before their governments enacted emergency orders.)
For years, I've assumed that the differences in cause area selection are determined solely by people's prior beliefs, i.e. if you believe animals are "moral patients" in the philosophy lingo, then you're more likely to prioritize animal welfare; if you believe currently living people are moral patients and people who haven't been born yet are not, then you're more likely to prioritize global poverty reduction (over e.g. existential risk reduction).
However, with the fresh acquisition of some basic data science skills and some anonymized survey data, I thought of an interesting question: Do a person's personality traits affect which cause area they're likely to prioritize? And if so, how?
You see, in 2018, the EA-affiliated (but not me-affiliated!) organization Rethink Charity included optional questions at the end of their annual community survey which recorded people's scores on the Big Five personality traits, so we have rough data on how nearly 1200 members of the EA community score on traits of openness, extroversion, conscientiousness, agreeableness, and "emotional stability" (in the survey data and in this analysis, the opposite of the trait usually labeled "neuroticism" in Big Five inventories).
If you're already familiar with the EA community, then just for fun, you could try making some guesses about the relationships between personality traits and cause prioritization before you scroll down any further.
In the interest of transparent calibration, I'll divulge the three conjectures I jotted down prior to running any of my statistical tests. I expected higher openness to correlate with AI safety prioritization, higher conscientiousness to correlate with animal welfare prioritization, and lower emotional stability to correlate with prioritizing mental health interventions. None of my predictions were borne out by my analysis.
This post won't say anything about how survey respondents differed from the general public. This post only compares groups within the EA community to each other. The overlap of personality trait scores between any two groups I compared was always greater than differences between the groups.
(Epistemic notes: Obviously, I was hoping for something interesting to write about, and tried two unproductive tacks before settling on the following statistical tests, but I was also prepared for an answer affirming the null hypothesis, i.e. that there is no correlation between personality traits and cause prioritization, and was furthermore prepared to write a blog post with that message. My confidence interval cutoff was the common Schelling point of 95% for non-medical research. Out of 55 2-sample t-tests, we would expect 2 to come out "statistically significant" due to random chance, but I found 10, so we can expect most of these to point to actually meaningful differences represented in the survey data.)
Within the 2018 survey, respondents had to assign an importance level to each of 11 potential cause areas: animal welfare, climate change, mental health, global poverty, overall rationality, "meta" causes like community building, cause prioritization research (i.e. what other cause areas have we not thought of yet?), biosecurity, nuclear security, AI safety, and a final catch-all cause area for other, unspecified existential risks.
Respondents had to assign one of the following importance levels, in descending order: "This cause should be the top priority," "This cause should be a near-top priority," "This cause deserves significant resources but less than the top priorities," "I do not think this is a priority, but should receive some resources," and "I do not think any resources should be devoted to this cause." Respondents could also select "Not sure" as a response.
There are many ways to approach this topic that I did not attempt. In this analysis, for each cause area, I pitted the group of people who picked the cause as their topmost priority against the group of people who said the cause should receive zero resources. And I found some interesting stuff.
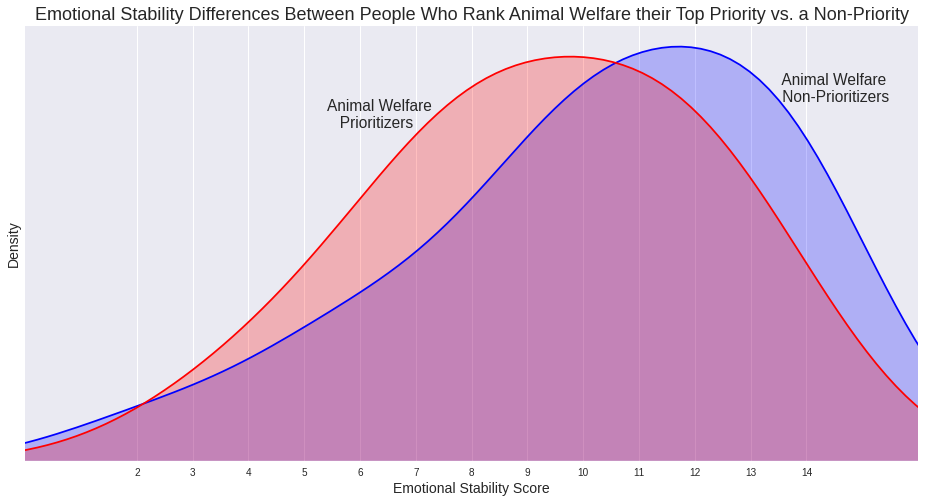
First of all: people who rate animal welfare their top priority on average have lower emotional stability scores than people who say no resources should be devoted to animal welfare, with a p-value of 0.026.
Sidebar: It's common to think of some of the Big Five personality traits as being straightforwardly desirable or undesirable, but I think it's the case that the goodness and badness of e.g. conscientiousness is actually context-dependent. For further reading, I recommend this essay by Eloise Rosen. In that vein, I hope these findings are the topic of EA Global after-party chitchat rather than the basis for acrimonious accusations! This is just for fun, guys.
Moving on!
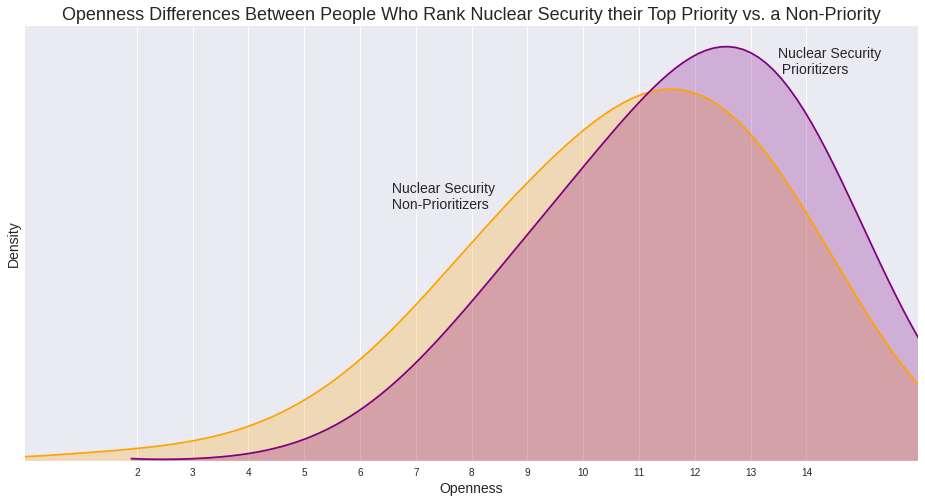
People who think nuclear security should be the top priority on average rank higher on openness than people who think the cause area of nuclear security should receive no resources (p=.046).
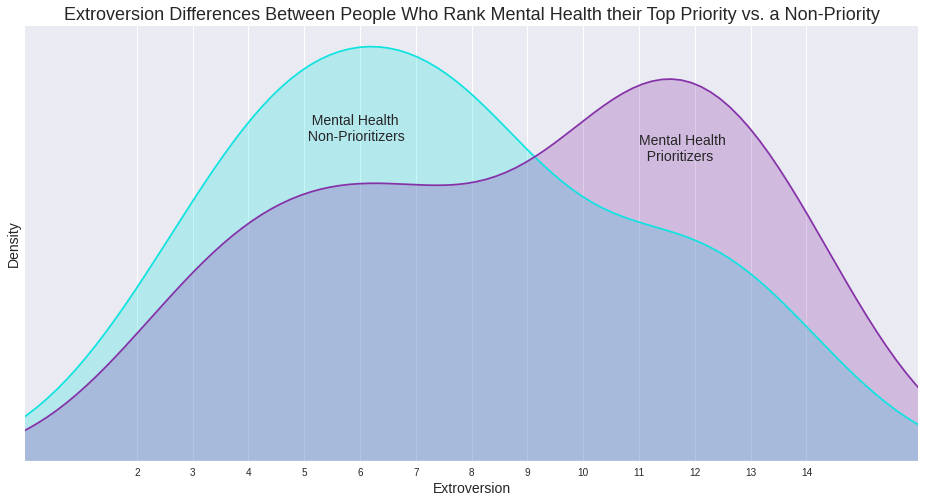
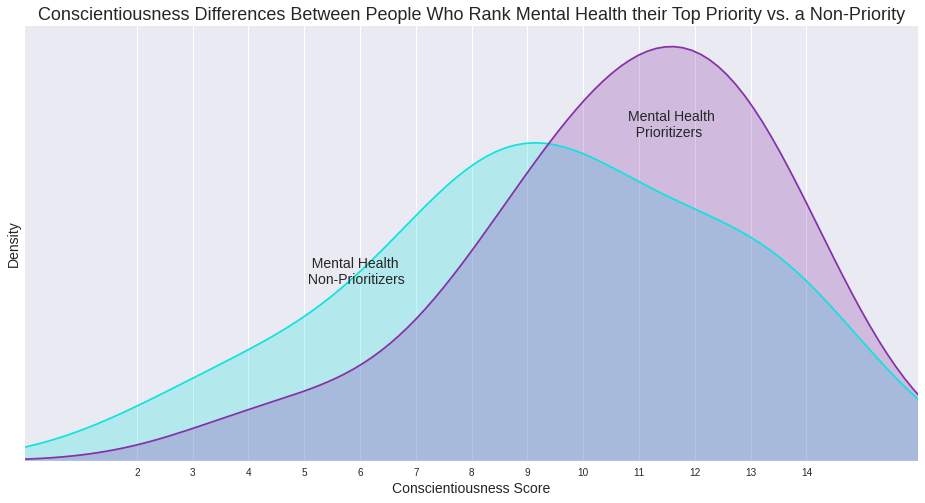
Remember my advance prediction about the correlation between emotional stability and rating mental health either a topmost priority or a non-priority? Well, that prediction wasn't just wrong, it was hilariously wrong. Those two groups of people had statistically significant differences on extroversion (p=.028), conscientiousness (.018), and agreeableness (.023) - but not emotional stability, the trait on which they were the most similar!
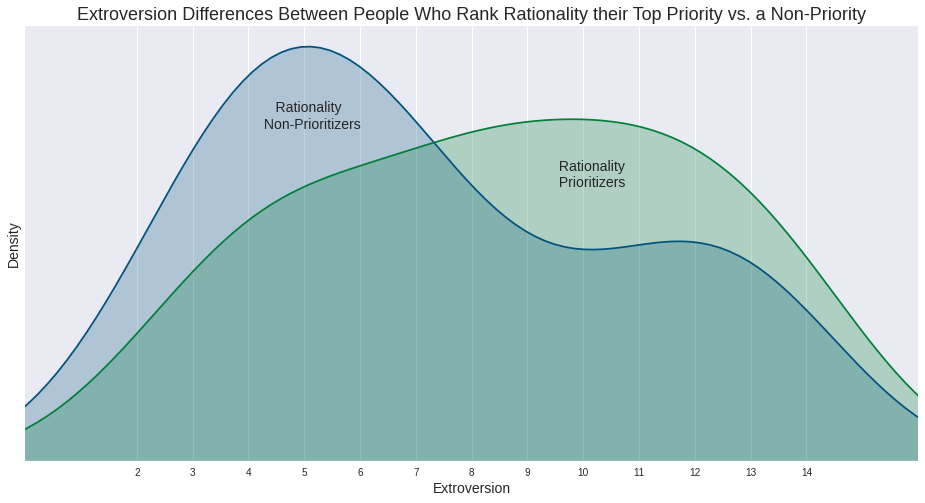
People who assign the highest priority to improving rationality in society and people who say no resources should be spent on such a herculean effort differ on extroversion (p=.026), emotional stability (.048), and openness (.017).
Finally, I'm going to leave you all with the most surprising-to-me graph, and also the result with the highest confidence level, a p-value of 0.009. This graph again compares people who rated climate change their top priority to people who said climate change should receive no resources. I expect this graph to generate some interesting speculation!
People who say climate change should be the top priority of the EA movement rank higher in conscientiousness than people who think no resources should be devoted to the cause.
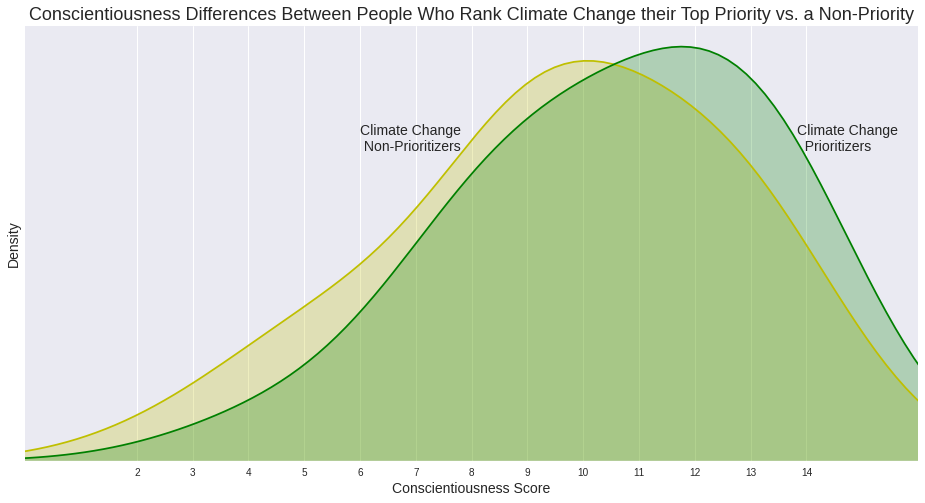
Each graph shows smoothed probability densities for the given personality score among survey respondents who answered the prioritization question in the specified way.
Here are all ten of the graphs I created showing between-group differences.
If you'd like to check my work, my code notebook for this little project lives here.
Special thanks to Alexander Rapp for his helpful comments on an earlier draft of this post, and thank you to several members of the EA Corner Discord server for encouraging me to host this content here.

Thanks a lot for looking at this! I'm also fascinated by possible links between Big 5 and other personality/psychometric measures, and EA related judgements, and think this kind of analysis could be quite informative about EA thinking, and perhaps prioritisation in particular. To echo another commenter, I also like the graphs.
Unfortunately, we had to drop all of our psychometric measures last year due to space constraints, but I hope that we may be able to reintroduce them at some point.
I recall that when I looked into possible relationships between our Big 5 measures and cause prioritisation, treating the response categories as an ordinal scale, and found mostly null results. One reason might have been low reliability of some of the measures: we used an established short form measure of the Big 5, the Ten Item Personality Inventory, which often seems to face low reliability issues.
It's interesting that you found such strong results looking at the difference between people who indicated that the cause should receive no resourcess versus those who indicated that it is the top priority. One thing worth bearing in mind is that these are very small proportions of the responses overall. Unfortunately the Forum now formats our 2018 post weirdly, with all the images really small, but you can see the distribution here:
It seems possible to me that 'extreme responders' indicating that a cause should receive no resources vs or it's the top priority might be a slightly unusual group overall (a priori, I might have expected 'no resources' respondents to be less agreeable and less conscientious). The results might also be influenced a little by the minority of respondents who selected multiple causes as "top cause", since these would disproportionately appear in your 'top cause' category.
It also seems likely that there might be confounders due to demographic differences which are associated with differences in Big 5. For example, there are big gender differences, which vary across the lifespan (see here), i.e. women are higher in Conscientiousness, Agreeableness, Openness, and Extraversion, although this varies at the aspect level (you can see the age x gender population norms for the TIPI specifically here and here), and we know that there were dramatic gender differences in cause prioritisation.
For example, women were much more supportive of Climate Change than men in our survey, so if women are more Conscientious, this would plausibly show up as a difference in Conscientiousness scores between supporters and opponents of Climate Change as a cause. So presumably you'd want to control for other differences in order to determine whether the difference in personality traits seems to predict the difference in cause prioritisation. Of course there could be other differences which are relevant, for example, I seem to recall that I found differences in the personality traits of LessWrong members vs non-LessWrong members (which could also be confounded by gender).
Thanks again for writing it! It's nudged me to go back and look at our data again when I have some time. I expect that we'll probably replicate at least some of your broad findings.