Hide table of contents

Summary

  • Historical terrorist attack deaths suggest the probability of a terrorist attack causing human extinction is astronomically low, 4.35*10^-15 per year according to my preferred estimate.
  • One may well update to a much higher extinction risk after accounting for inside view factors. However, extraordinary evidence would be required to move up sufficiently many orders of magnitude for an AI or bio terrorist attack to have a decent chance of causing human extinction.
  • I think it would be great if Open Philanthropy published the results of their efforts to quantify biorisk if/once they are available.
  • In the realm of the more anthropogenic AIbio and nuclear risk, I personally think underweighting the outside view is a major reason leading to overly high risk. I encourage readers to check David’s series exaggerating the risks, which includes subseries on climateAI and bio risk.

Introduction

I listened to Kevin Esvelt’s stories on The 80,000 Hours Podcast about how bioterrorism may kill billions. They sounded plausible, but at the same time I thought I should account for the outside view, which I knew did not favour terrorism being a global catastrophic risk. So I decided to look into historical terrorist attack deaths to estimate a prior probability for a terrorist attack causing human extinction.

Methods

Firstly, I retrieved data for the deaths in the 202 k terrorist attacks between January 1970 and June 2021 on the Global Terrorism Database (GTB). Then I computed some historical stats for such deaths.

Secondly, I relied on the Python library fitter to find the distributions which best fit to the top 1 %:

  • Terrorist attack deaths.
  • Logarithm of the terrorist attack deaths as a fraction of the global population[1].

I fitted the distributions to the 1 % most deadly attacks because I am interested in the right tail, which may decay faster than suggested by the less extreme points. fitter tries all the types of distributions in SciPy, 111 on 13 November 2023. For each type of distribution, the best fit is that with the lowest residual sum of squares (RSS), respecting the sum of the squared differences between the baseline and predicted probability density function (PDF). I set the number of bins to define the baseline PDF to the square root of the number of data points, and left the maximum time to find the best fit parameters to the default value in fitter of 30 s.

I estimated the probability of the terrorist attack deaths as a fraction of the global population being at least 10^-10, 10^-9, …, and 100 % multiplying:

  • 1 %, which is the probability of the attack being in the right tail.
  • Probability of the deaths as a fraction of the global population being at least 10^-10, 10^-9, …, and 100 % if the attack is in the right tail, which I got using the best fit parameters outputted by fitter.

I obtained the annual probability of terrorist attack extinction from 1 - (1 - “probability of the terrorist attack deaths as a fraction of the global population being at least 100 %”)^“terrorist attacks per year”.

I aggregated probabilities from different best fit distributions using the median. I did not use:

  • The mean because it ignores information from extremely low predictions, and overweights outliers.
  • The geometric mean of odds nor the geometric mean because many probabilities were 0.

The calculations are in this Sheet and this Colab.

Results

The results are in the Sheet.

Historical terrorist attacks stats

Terrorist attacks basic stats

Statistic

Terrorist attack deaths

Terrorist attack deaths as a fraction of the global population

Terrorist attack deaths in a single calendar year

Mean

2.43

3.74*10^-10

9.63 k

Minimum

0

0

173

5th percentile

0

0

414

Median

0

0

7.09 k

95th percentile

10

1.53*10^-9

31.1 k

99th percentile

30

4.74*10^-9

41.8 k

Maximum

1.70 k

2.32*10^-7

44.6 k

Terrorist attacks by severity

Terrorist attack deaths

Terrorist attacks

Terrorist attacks per year

Minimum

Maximum

0

Infinity

202 k

3.92 k

0

1

101 k

1.97 k

1

10

89.5 k

1.74 k

10

100

10.8 k

210

100

1 k

235

4.56

1 k

10 k

4

0.0777

10 k

Infinity

0

0

Tail distribution of the terrorist attack deaths

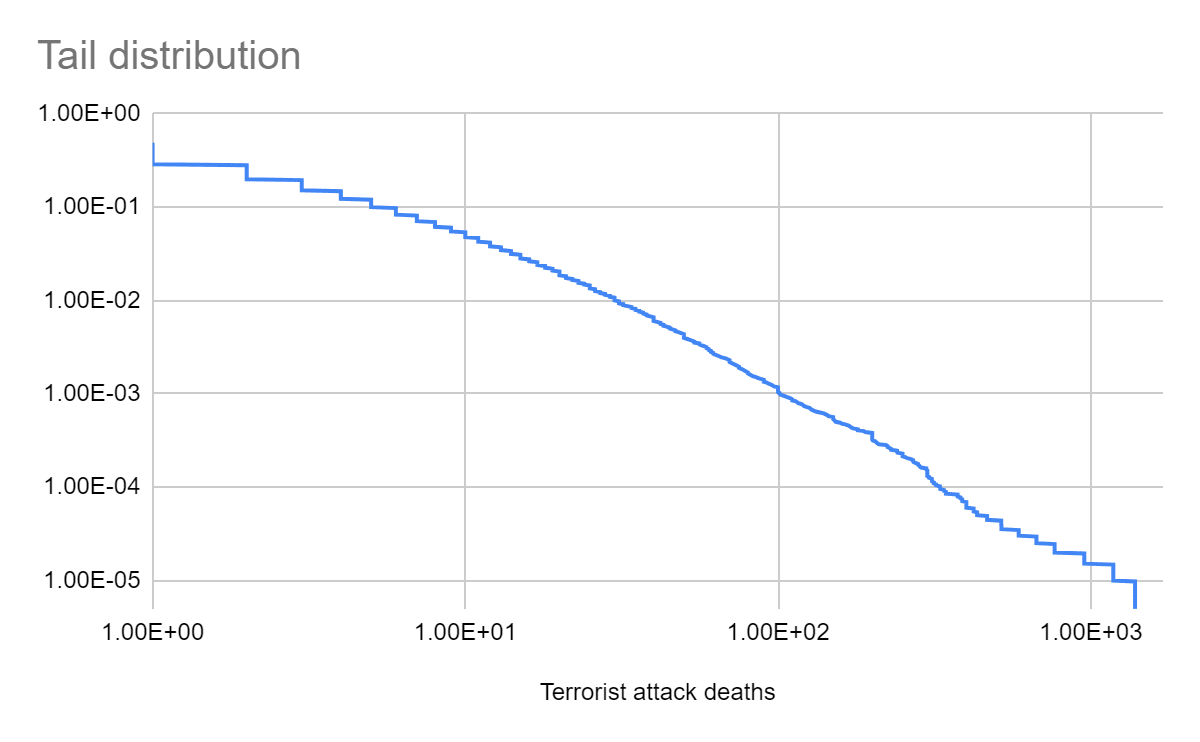
Terrorist attacks tail risk

Below are the median RSS, coefficient of determination[2] (R^2), probability of terrorist attack deaths as a fraction of the global population being at least 10^-10, 10^-9, …, and 100 %, and annual probability of a terrorist attack causing human extinction. The medians are taken across the best, top 10, and top 100 distributions according to 3 fitness criteria, lowest RSS[3], Akaike information criterion (AIC), and Bayesian information criterion (BIC). My preferred estimate is the median taken across the 10 distributions with lowest RSS, which is the default fitness criterion in fitter, fitted to the top 1 % logarithm of the terrorist attack deaths as a fraction of the global population. The results for AIC and BIC are identical[4]. Null values may be exactly 0 if they concern bounded distributions, or just sufficiently small to be rounded to 0 due to finite precision. I also show the annual probability of terrorist attack extinction as a function of R^2.

Best fit to the top 1 % terrorist attack deaths

Distributions

Median RSS

Median R^2

Best (RSS)

1.87*10^-6

99.6 %

Top 10 (RSS)

9.26*10^-6

98.0 %

Top 100 (RSS)

1.03*10^-4

78.1 %

Best (AIC)

4.71*10^-4

0

Top 10 (AIC)

4.65*10^-4

1.21 %

Top 100 (AIC)

8.77*10^-5

81.4 %

Best (BIC)

4.71*10^-4

0

Top 10 (BIC)

4.65*10^-4

1.21 %

Top 100 (BIC)

8.77*10^-5

81.4 %

Distributions

Median probability of terrorist attack deaths as a fraction of the global population being at least...

10^-10

10^-9

10^-8

10^-7

Best (RSS)

1.00 %

9.94*10^-3

9.89*10^-4

2.15*10^-6

Top 10 (RSS)

1.00 %

1.00 %

1.43*10^-3

2.21*10^-7

Top 100 (RSS)

1.00 %

1.00 %

2.10*10^-3

9.00*10^-7

Best (AIC)

1.00 %

1.00 %

9.71*10^-3

5.44*10^-3

Top 10 (AIC)

9.95*10^-3

9.94*10^-3

9.18*10^-3

5.20*10^-3

Top 100 (AIC)

1.00 %

1.00 %

2.10*10^-3

1.52*10^-6

Best (BIC)

1.00 %

1.00 %

9.71*10^-3

5.44*10^-3

Top 10 (BIC)

9.95*10^-3

9.94*10^-3

9.18*10^-3

5.20*10^-3

Top 100 (BIC)

1.00 %

1.00 %

2.10*10^-3

1.52*10^-6

Distributions

Median probability of terrorist attack deaths as a fraction of the global population being at least...

10^-6

0.001 %

0.01 %

0.1 %

Best (RSS)

4.64*10^-9

1.00*10^-11

2.17*10^-14

4.66*10^-17

Top 10 (RSS)

3.60*10^-12

3.05*10^-17

0

0

Top 100 (RSS)

0

0

0

0

Best (AIC)

0

0

0

0

Top 10 (AIC)

0

0

0

0

Top 100 (AIC)

0

0

0

0

Best (BIC)

0

0

0

0

Top 10 (BIC)

0

0

0

0

Top 100 (BIC)

0

0

0

0

Distributions

Median probability of terrorist attack deaths as a fraction of the global population being at least...


Median annual probability of terrorist attack extinction

1 %

10 %

100 %

Best (RSS)

0

0

0

0

Top 10 (RSS)

0

0

0

0

Top 100 (RSS)

0

0

0

0

Best (AIC)

0

0

0

0

Top 10 (AIC)

0

0

0

0

Top 100 (AIC)

0

0

0

0

Best (BIC)

0

0

0

0

Top 10 (BIC)

0

0

0

0

Top 100 (BIC)

0

0

0

0

Best fit to the top 1 % logarithm of the terrorist attack deaths as a fraction of the global population

Distributions

Median RSS

Median R^2

Best (RSS)

0.113

98.4 %

Top 10 (RSS)

0.123

98.2 %

Top 100 (RSS)

0.654

90.5 %

Best (AIC)

6.88

0

Top 10 (AIC)

6.87

1.77*10^-3

Top 100 (AIC)

0.654

90.5 %

Best (BIC)

6.88

0

Top 10 (BIC)

6.87

1.77*10^-3

Top 100 (BIC)

0.654

90.5 %

Distributions

Median probability of terrorist attack deaths as a fraction of the global population being at least...

10^-10

10^-9

10^-8

10^-7

Best (RSS)

1.00 %

1.00 %

2.75*10^-3

3.48*10^-5

Top 10 (RSS)

1.00 %

1.00 %

2.74*10^-3

3.65*10^-5

Top 100 (RSS)

1.00 %

1.00 %

2.89*10^-3

6.85*10^-5

Best (AIC)

1.00 %

1.00 %

8.08*10^-3

2.16*10^-3

Top 10 (AIC)

1.00 %

1.00 %

7.18*10^-3

2.40*10^-3

Top 100 (AIC)

1.00 %

1.00 %

2.89*10^-3

6.81*10^-5

Best (BIC)

1.00 %

1.00 %

8.08*10^-3

2.16*10^-3

Top 10 (BIC)

1.00 %

1.00 %

7.18*10^-3

2.40*10^-3

Top 100 (BIC)

1.00 %

1.00 %

2.89*10^-3

6.81*10^-5

Distributions

Median probability of terrorist attack deaths as a fraction of the global population being at least...

10^-6

0.001 %

0.01 %

0.1 %

Best (RSS)

4.21*10^-7

5.09*10^-9

6.15*10^-11

7.44*10^-13

Top 10 (RSS)

4.46*10^-7

5.26*10^-9

6.05*10^-11

6.85*10^-13

Top 100 (RSS)

4.19*10^-8

5.65*10^-11

2.34*10^-14

4.11*10^-17

Best (AIC)

0

0

0

0

Top 10 (AIC)

0

0

0

0

Top 100 (AIC)

3.95*10^-8

5.22*10^-11

1.09*10^-14

1.55*10^-17

Best (BIC)

0

0

0

0

Top 10 (BIC)

0

0

0

0

Top 100 (BIC)

3.95*10^-8

5.22*10^-11

1.09*10^-14

1.55*10^-17

Distributions

Median probability of terrorist attack deaths as a fraction of the global population being at least...


Median annual probability of terrorist attack extinction

1 %

10 %

100 %

Best (RSS)

9.00*10^-15

1.09*10^-16

1.11*10^-18

4.35*10^-15

Top 10 (RSS)

7.71*10^-15

8.66*10^-17

1.11*10^-18

4.35*10^-15

Top 100 (RSS)

5.55*10^-19

0

0

0

Best (AIC)

0

0

0

0

Top 10 (AIC)

0

0

0

0

Top 100 (AIC)

0

0

0

0

Best (BIC)

0

0

0

0

Top 10 (BIC)

0

0

0

0

Top 100 (BIC)

0

0

0

0

Discussion

Historical terrorist attack deaths suggest the probability of a terrorist attack causing human extinction is astronomically low. According to my preferred estimate, the median taken across the 10 distributions with lowest RSS fitted to the top 1 % logarithm of the terrorist attack deaths as a fraction of the global population, the annual probability of human extinction caused by a terrorist attack is 4.35*10^-15. Across all my 18 median estimates, it is 4.35*10^-15 for 2, and 0 for the other 16. For context, in the Existential Risk Persuasion Tournament (XPT), superforecasters and domain experts[5] predicted a probability of an engineered pathogen causing human extinction by 2100 of 0.01 % and 1 %, which are much higher than the implied by my prior estimates.

I do not think anthropics are confounding the results. There would be no one to do this analysis if a terrorist attack had caused human extinction in the past, but there would be for less severe large scale attacks, and there have not been any. The most deadly attack since 1970 on GTB only killed 1.70 k people. As a side note, the most deadly bioterrorist incident only killed 200 people (over 5 years).

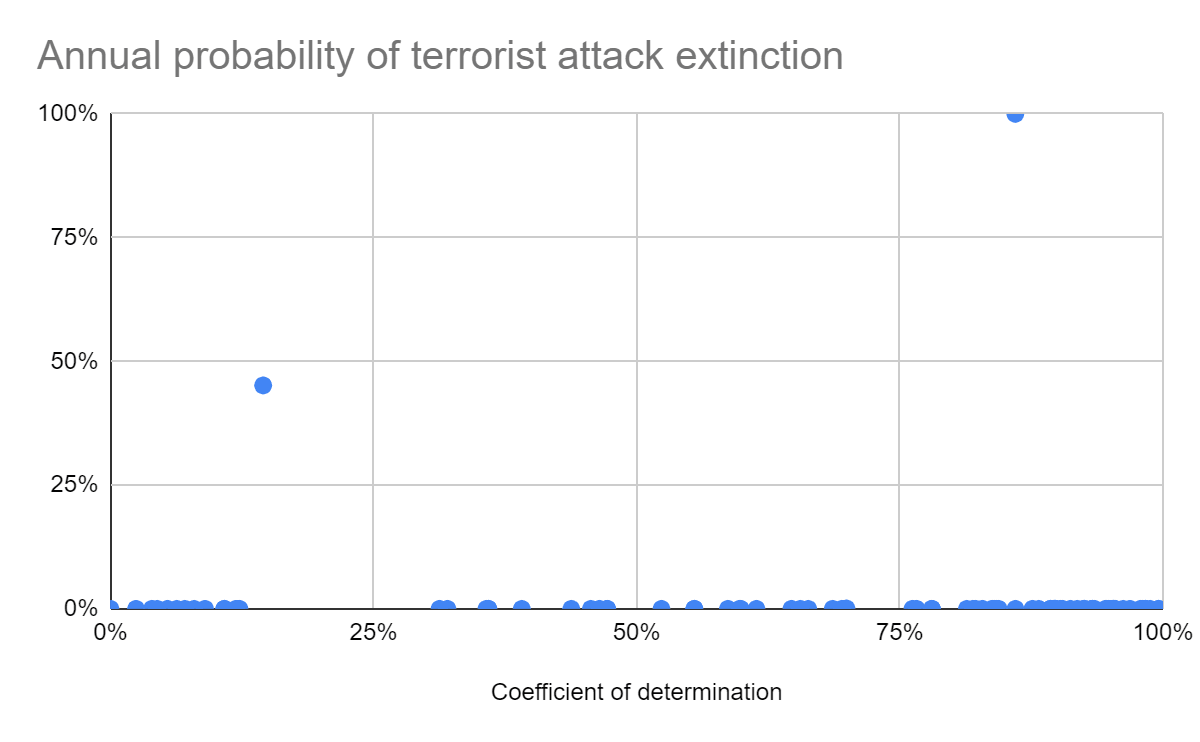
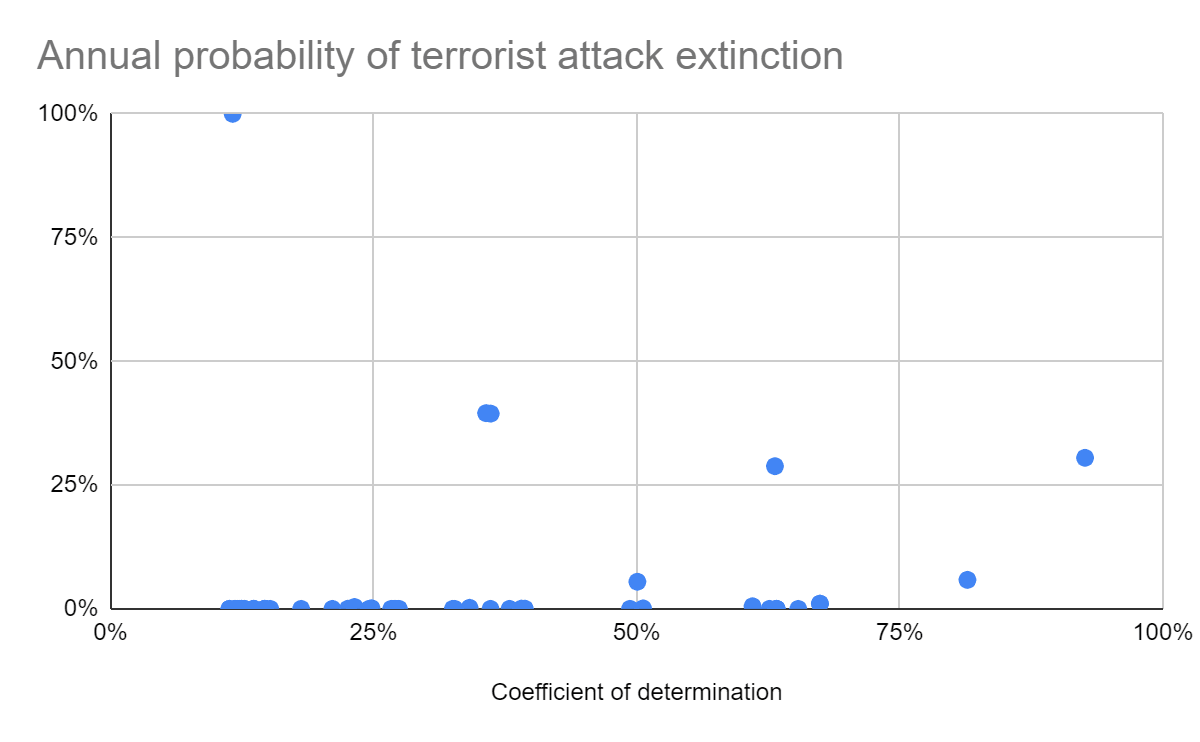
Interestingly, some best fit distributions led to an annual probability of human extinction caused by a terrorist attack higher than 10 % (see last 2 graphs), which is unreasonably high. In terms of the best fit distributions to:

  • The top 1 % terrorist attack deaths, a lognormal results in 45.1 %[6] (R^2 = 14.5 %).
  • The logarithm of the top 1 % terrorist attack deaths as a fraction of the global population (the following are ordered by descending R^2):

Nonetheless, I have no reason to put lots of weight into the distributions above, so I assume it makes sense to rely on the median. In addition, according to extreme value theory, the right tail should follow a generalised Pareto, whose respective best fit to the top 1 % terrorist attack deaths results in an annual probability of human extinction caused by a terrorist attack of 0 (R^2 of 94.5 %).

Of course, no one is arguing that terrorist attacks with the current capabilities pose a meaningful extinction risk. The claim is that the world may become vulnerable if advances in AI and bio make super destructive technology much more widely accessible. One may well update to a much higher extinction risk after accounting for inside view factors, and indirect effects of terrorist attacks (like precipitating wars). However, extraordinary evidence would be required to move up sufficiently many orders of magnitude for an AI or bio terrorist attack to have a decent chance of causing human extinction. On the other hand, extinction may be caused via other routes, like a big war or accident.

I appreciate it is often difficult to present compelling evidence for high terrorism risk due to infohazards, even if these hinder good epistemics. However, there are ways of quantifying terrorism risk which mitigate them. From Open Philanthropy’s request for proposal to quantify biorisk:

One way of estimating biological risk that we do not recommend is ‘threat assessment’—investigating various ways that one could cause a biological catastrophe. This approach may be valuable in certain situations, but the information hazards involved make it inherently risky. In our view, the harms outweigh the benefits in most cases.

A second, less risky approach is to abstract away most biological details and instead consider general ‘base rates’. The aim is to estimate the likelihood of a biological attack or accident using historical data and base rates of analogous scenarios, and of risk factors such as warfare or terrorism.

As far as know, there is currently no publicly available detailed model of tail biorisk. I think it would be great if Open Philanthropy published the results of their efforts to quantify biorisk if/once they are available. The request was published about 19 months ago, and the respective grants were announced 17 months ago. Denise Melchin asked 12 months ago whether the results would be published, but there has been no reply.

In general, I agree with David Thorstad that Toby Ord’s guesses for the existential risk between 2021 and 2120 given in The Precipice are very high. In the realm of the more anthropogenic AIbio and nuclear risk, I personally think underweighting the outside view is a major reason leading to overly high risk. I encourage readers to check David’s series exaggerating the risks, which includes subseries on climateAI and bio risk.

Acknowledgements

Thanks to Anonymous Person 1 and Anonymous Person 2 for feedback on the draft.

  1. ^

     fitter has trouble finding good distributions if I do not use the logarithm, presumably because the optimisation is harder / fails with smaller numbers.

  2. ^

     Fraction of the variance of the baseline PDF explained by the predicted PDF. I computed this fraction from 1 minus the ratio between the residual and total sum of squares.

  3. ^

     Equivalent to lowest R^2.

  1. ^

     Although the results I present are identical, the rankings for AIC and BIC are not exactly the same.

  2. ^

     The sample drew heavily from the Effective Altruism (EA) community: about 42% of experts and 9% of superforecasters reported that they had attended an EA meetup.

  3. ^

     In addition, the best fit normal-inverse Gaussian to the top 1 % terrorist attack deaths results in 100 % (R^2 = 86.0 %). I did not mention this in the main text because there must be an error in fitter (or, less likely, in SciPy's norminvgauss) for this case. The respective cumulative distribution function (CDF) increases until terrorist attack deaths as a fraction of the global population of 10^-7, but then unexpectedly drops to 0, which cannot be right.

Show all footnotes
Comments9


Sorted by Click to highlight new comments since:

Hi Vasco, nice post thanks for writing it! I haven't had the time to look into all your details so these are some thoughts written quickly.

I worked on a project for Open Phil quantifying the likely number of terrorist groups pursuing bioweapons over the next 30 years, but didn't look specifically at attack magnitudes (I appreciate the push to get a public-facing version of the report published - I'm on it!). That work was as an independent contractor for OP, but I now work for them on the GCR Cause Prio team. All that to say these are my own views, not OP's.

I think this is a great post grappling with the empirics of terrorism. And I agree with the claim that the history of terrorism implies an extinction-level terrorist attack is unlikely. However, for similar reasons to Jeff Kaufman, I don't think this strongly undermines the existential threat from non-state actors. This is for three reasons, one methodological and two qualitative:

  1. The track record of bioterrorism in particular is too sparse to make empirical projections with much confidence. I think the rarity of bioterror and general small magnitudes of attacks justifies a prior against bioterror as a significant threat, but only a weak one. It also justifies a prior that we should expect at least a handful of groups to attempt bioterror over the next 10-30 years. To take the broader set of terror attacks as having strong implications for future bioterror, one would need to think that 'terrorism' is a compelling reference class for bio x-risk - which my next two points dispute.
  2. The vast majority of terror groups ('violent non-state actors' is a more generally applicable handle) would not want to cause extinction. Omnicidality is a fairly rare motivation - most groups have specific political aims, or ideological motivations that are predicated on a particular people/country/sect/whatever thriving and overcoming its enemies. Aiming for civilisational collapse is slightly more prevalent, though still uncommon. And for all of history, there hasn't been a viable path to omnicide or x-risk anyway. So the kind of actor that presents a bio x-risk is probably going to be very different to the kinds of actor that make up the track record of terrorism.
  3. The vast majority of terror attacks are kinetic - involving explosives, firearms, vehicles, melee weapons. The exceptions are chemical and biological weapons. The biological weapons chosen are generally non-transmissible - anthrax, botulinum toxin, ricin, etc. This means that chem and bio attacks also rely on delivery mechanisms that have to get each individual victim to come into contact with the agent. An attack with a pandemic-class agent would not rely on such delivery. It would be strikingly different in complexity of development, attack modality, targeting specificity, and many other dimensions. I.e. it would be very unlike almost all previous terrorist attacks. The ability to carry out such an attack is also fairly unprecedented - it may only emerge with subsequent developments in biotechnology, especially from the convergence of AI and biotechnology.

So overall, compared to the threat model of future bio x-risk, I think the empirical track record of bioterrorism is too weak (point 1), and the broader terrorism track record is based on actors with very different motivations (point 2) using very different attack modalities (point 3). The latter two points are grounded in a particular worldview - that within coming years/decades biotechnology will enable biological weapons with catastrophic potential. I think that worldview is certainly contestable, but I think the track record of terrorism is not the most fruitful line of attack against it.

On a meta-level, the fact that XPT superforecasters are so much higher than what your model outputs suggests that they also think the right reference class approach is OOMs higher. And this is despite my suspicion that the XPT supers are too low and too indexed on past base-rates.

You emailed asking for reading recommendations - in lieu of my actual report (which will take some time to get to a publishable state), here's my structured bibliography! In particular I'd recommend Binder & Ackermann 2023 (CBRN Terrorism) and McCann 2021 (Outbreak: A Comprehensive Analysis of Biological Terrorism).

Hi Ben, I'm curious if this public-facing report is out yet, and if not, where could someone reading this in the future look to check (so you don't have to repeatedly field the same question)?

> I appreciate the push to get a public-facing version of the report published - I'm on it!

Great points, and thanks for the reading suggestions, Ben! I am also happy to know you plan to publish a report describing your findings.

I qualitatively agree with everything you have said. However, I would like to see a detailed quantitative model estimating AI or bio extinction risk (which handled well infohazards). Otherwise, I am left wondering about how much higher extinction risk will become accounting not only for increased capabilities, but also increased safety.

On a meta-level, the fact that XPT superforecasters are so much higher than what your model outputs suggests that they also think the right reference class approach is OOMs higher. And this is despite my suspicion that the XPT supers are too low and too indexed on past base-rates.

To clarify, my best guess is also many OOMs higher than the headline number of my post. I think XPT's superforecaster prediction of 0.01 % human extinction risk due an engineered pathogen by 2100 (Table 3) is reasonable.

However, I wonder whether superforecasters are overestimating the risk because their nuclear extinction risk by 2100 of 0.074 % seems way too high. I estimated a 0.130 % chance of a nuclear war before 2050 leading to an injection of soot into the stratosphere of at least 47 Tg, so around 0.39 % (= 0.00130*75/25) before 2100. So, for the superforecasters to be right, extinction conditional on at least 47 Tg would have to be around 20 % (= 0.074/0.39) likely. This appears extremely pessimistic. From Xia 2022 (see top tick in the 3rd bar from the right in Fig. 5a):

With the most optimistic case—100% livestock crop feed to humans, no household waste and equitable global food distribution—there would be enough food production for everyone under the 47 Tg case.

This scenario is the most optimistic in Xia 2022, but it is pessimist in a number of ways (search for "High:" here):

  • “Scenarios assume that all stored food is consumed in Year 1”, i.e. no rationing.
  • “We do not consider farm-management adaptations such as changes in cultivar selection, switching to more cold-tolerating crops or greenhouses31 and alternative food sources such as mushrooms, seaweed, methane single cell protein, insects32, hydrogen single cell protein33 and cellulosic sugar34”.
  • “Large-scale use of alternative foods, requiring little-to-no light to grow in a cold environment38, has not been considered but could be a lifesaving source of emergency food if such production systems were operational”.
  • “Byproducts of biofuel have been added to livestock feed and waste27. Therefore, we add only the calories from the final product of biofuel in our calculations”. However, it would have been better to redirect to humans the crops used to produce biofuels.

So 20 % chance of extinction conditional on at least 47 Tg does sound very high to me, which makes me think superforecasters are overestimating nuclear extinction risk quite a lot. This in turn makes me wonder whether they are also overestimating other risks which I have investigated less.

So overall, compared to the threat model of future bio x-risk, I think the empirical track record of terrorism is too weak (point 1)

Nitpick. I think you meant bioterrorism, not terrorism which includes more data.

Nitpick. I think you meant bioterrorism, not terrorism which includes more data.

Thanks! Fixed.

I don't know the nuclear field well, so don't have much to add. If I'm following your comment though, it seems like you have your own estimate of the chance of nuclear war raising 47+ Tg  of soot, and on the basis of that infer the implied probability supers give to extinction conditional on such a war. Why not instead infer that supers have a higher forecast of nuclear war than your 0.39% by 2100? E.g. a ~1.6% chance of nuclear war with 47+ Tg and a 5% chance of extinction conditional on it. I may be misunderstanding your comment. Though to be clear, I think it's very possible the supers were not thinking things through in similar detail to you - there were a fair number of questions in the XPT.
 

I am left wondering about how much higher extinction risk will become accounting not only for increased capabilities, but also increased safety

I don't think I follow this sentence? Is it that one might expect future advances in defensive biotech/other tech to counterbalance offensive tech development, and that without a detailed quant model you expect the defensive side to be under-counted?

Why not instead infer that supers have a higher forecast of nuclear war than your 0.39% by 2100? E.g. a ~1.6% chance of nuclear war with 47+ Tg and a 5% chance of extinction conditional on it.

Fair point! Here is another way of putting my point. I estimated a probability of 3.29*10^-6 for a 50 % population loss due to the climatic effects of nuclear war before 2050, so around 0.001 % (= 3.29*10^-6*75/25) before 2100. Superforecasters' 0.074 % nuclear extinction risk before 2100 is 74 times my risk for a 50 % population loss due to climatic effects. My estimate may be off to some extent, and I only focussed on the climatic effects, not the indirect deaths caused by infrastructure destruction, but my best guess has to be many OOMs off for superforecasters prediction to be in the right OOM. This makes me believe superforecasters' are overestimating nuclear extinction risk.

Is it that one might expect future advances in defensive biotech/other tech to counterbalance offensive tech development [?]

Yes, in the same way that the risk of global warming is often overestimated due to neglecting adaptation.

without a detailed quant model you expect the defensive side to be under-counted?

I expect the defensive side to be under-counted, but not necessarily due to lack of quantitative models. However, I think using quantitative models makes it less likely that the defensive side is under-counted. I have not thought much about this; I am just expressing my intuitions.

extraordinary evidence would be required to move up sufficiently many orders of magnitude for an AI or bio terrorist attack to have a decent chance of causing human extinction.

How extraordinary does the evidence need to be? You can easily get many orders of magnitude changes in probabilities given some evidence. For example, as of 1900 on priors the probability that >1B people would experience powered flight in the year 2000 would have been extremely low, but someone paying attention to technological developments would have been right to give it a higher probability.

I've written something up on why I think this is likely: Out-of-distribution Bioattacks. Short version: I expect a technological change which expands which actors would try to cause harm.

(Thanks for sharing a draft with me in advance so I could post a full response at the same time instead of leaving "I disagree, and will say why soon!" comments while I waited for information hazard review!)

Thanks for the comment, Jeff!

How extraordinary does the evidence need to be?

I have not thought about this in any significant detail, but it is a good question! I think David Thorstad's series exagerating the risks has some relevant context.

You can easily get many orders of magnitude changes in probabilities given some evidence.  For example, as of 1900 on priors the  probability that >1B people would experience powered flight in the year 2000 would have been extremely low, but someone paying attention to technological developments would have been right to give it a higher probability.

Is that a fair comparison? I think the analogous comparison would involve replacing terrorist attack deaths per year by the number of different people travelling by plane per year. So we would have to assume, in the last 51.5 years, only:

  • 9.63 k different people travelled by plane in a random single calendar year.
  • At most 44.6 k different people travelled by plane in a single calendar year.

Then, analogously to asking about a terrorist attack causig human extinction next year, we would ask about the probability that every single human (or close) would travel by plane next year, which would a priori be astronomically unlikely given the above.

I've written something up on why I think this is likely: Out-of-distribution Bioattacks. Short version: I expect a technological change which expands which actors would try to cause harm.

I am glad you did. It is a useful complement/follow-up to my post. I qualitatevely agree with the points you make, although it is still unclear to me how much higher the risk will become.

(Thanks for sharing a draft with me in advance so I could post a full response at the same time instead of leaving "I disagree, and will say why soon!" comments while I waited for information hazard review!)

You are welcome, and thanks for letting me know about that too!

I think the analogous comparison would involve replacing terrorist attack deaths per year by the number of different people travelling by plane per year. So we would have to assume, in the last 51.5 years, only:

  • 9.63 k different people travelled by plane in a random single calendar year.
  • At most 44.6 k different people travelled by plane in a single calendar year.

I don't really understand what you're getting at here? Would you be able to spell it out more clearly?

(Or if someone else understands and I'm just missing it, feel free to jump in!)

Sorry for the lack of clarity. Basically, I was trying to point out that the structure of the data we had on people travelling by plane in 1900 (only in 1903) is different from that we have on terrorist attack deaths now. Then I described hypothetical data on travelling by plane with a similar structure to that we have on terrorist attack deaths now.

One could argue no people having travelled by plane until 1900 is analogous to no people having been killed in terrorist attacks, which would set an even lower prior probability of human extinction due to a terrorist attack (I would just be extrapolating based on e.g. 50 or so 0s, respecting 50 or so years of no terrorist attack deaths), whereas apparently 45 % of people in the US travelled by plane in 2015.

However, in the absence of data on people travelling by plane, it would make sense to use other reference class instead of extrapolating based on a bunch of 0s. Once one used an appropriate reference class, it is possible lots of people travelling now by plane does not seem so surprising. In addition, one may be falling prey to hindsight bias to some extent. Maybe so many people travelling by plane (e.g. instead of having more remote work) was not that likely ex ante.

Curated and popular this week
 ·  · 23m read
 · 
Or on the types of prioritization, their strengths, pitfalls, and how EA should balance them   The cause prioritization landscape in EA is changing. Prominent groups have shut down, others have been founded, and everyone is trying to figure out how to prepare for AI. This is the first in a series of posts examining the state of cause prioritization and proposing strategies for moving forward.   Executive Summary * Performing prioritization work has been one of the main tasks, and arguably achievements, of EA. * We highlight three types of prioritization: Cause Prioritization, Within-Cause (Intervention) Prioritization, and Cross-Cause (Intervention) Prioritization. * We ask how much of EA prioritization work falls in each of these categories: * Our estimates suggest that, for the organizations we investigated, the current split is 89% within-cause work, 2% cross-cause, and 9% cause prioritization. * We then explore strengths and potential pitfalls of each level: * Cause prioritization offers a big-picture view for identifying pressing problems but can fail to capture the practical nuances that often determine real-world success. * Within-cause prioritization focuses on a narrower set of interventions with deeper more specialised analysis but risks missing higher-impact alternatives elsewhere. * Cross-cause prioritization broadens the scope to find synergies and the potential for greater impact, yet demands complex assumptions and compromises on measurement. * See the Summary Table below to view the considerations. * We encourage reflection and future work on what the best ways of prioritizing are and how EA should allocate resources between the three types. * With this in mind, we outline eight cruxes that sketch what factors could favor some types over others. * We also suggest some potential next steps aimed at refining our approach to prioritization by exploring variance, value of information, tractability, and the
 ·  · 5m read
 · 
[Cross-posted from my Substack here] If you spend time with people trying to change the world, you’ll come to an interesting conundrum: Various advocacy groups reference previous successful social movements as to why their chosen strategy is the most important one. Yet, these groups often follow wildly different strategies from each other to achieve social change. So, which one of them is right? The answer is all of them and none of them. This is because many people use research and historical movements to justify their pre-existing beliefs about how social change happens. Simply, you can find a case study to fit most plausible theories of how social change happens. For example, the groups might say: * Repeated nonviolent disruption is the key to social change, citing the Freedom Riders from the civil rights Movement or Act Up! from the gay rights movement. * Technological progress is what drives improvements in the human condition if you consider the development of the contraceptive pill funded by Katharine McCormick. * Organising and base-building is how change happens, as inspired by Ella Baker, the NAACP or Cesar Chavez from the United Workers Movement. * Insider advocacy is the real secret of social movements – look no further than how influential the Leadership Conference on Civil Rights was in passing the Civil Rights Acts of 1960 & 1964. * Democratic participation is the backbone of social change – just look at how Ireland lifted a ban on abortion via a Citizen’s Assembly. * And so on… To paint this picture, we can see this in action below: Source: Just Stop Oil which focuses on…civil resistance and disruption Source: The Civic Power Fund which focuses on… local organising What do we take away from all this? In my mind, a few key things: 1. Many different approaches have worked in changing the world so we should be humble and not assume we are doing The Most Important Thing 2. The case studies we focus on are likely confirmation bias, where
 ·  · 1m read
 · 
I wanted to share a small but important challenge I've encountered as a student engaging with Effective Altruism from a lower-income country (Nigeria), and invite thoughts or suggestions from the community. Recently, I tried to make a one-time donation to one of the EA-aligned charities listed on the Giving What We Can platform. However, I discovered that I could not donate an amount less than $5. While this might seem like a minor limit for many, for someone like me — a student without a steady income or job, $5 is a significant amount. To provide some context: According to Numbeo, the average monthly income of a Nigerian worker is around $130–$150, and students often rely on even less — sometimes just $20–$50 per month for all expenses. For many students here, having $5 "lying around" isn't common at all; it could represent a week's worth of meals or transportation. I personally want to make small, one-time donations whenever I can, rather than commit to a recurring pledge like the 10% Giving What We Can pledge, which isn't feasible for me right now. I also want to encourage members of my local EA group, who are in similar financial situations, to practice giving through small but meaningful donations. In light of this, I would like to: * Recommend that Giving What We Can (and similar platforms) consider allowing smaller minimum donation amounts to make giving more accessible to students and people in lower-income countries. * Suggest that more organizations be added to the platform, to give donors a wider range of causes they can support with their small contributions. Uncertainties: * Are there alternative platforms or methods that allow very small one-time donations to EA-aligned charities? * Is there a reason behind the $5 minimum that I'm unaware of, and could it be adjusted to be more inclusive? I strongly believe that cultivating a habit of giving, even with small amounts, helps build a long-term culture of altruism — and it would