Interesting list! I had a quick look at the papers for three areas not covered by major EA funders: my thoughts below
e-Government procurement - IT systems to manage government tenders/purchases - making it easy for private sector companies to sell to governments, reducing prices through increased competition and reducing opportunities for corruption.
Looks very attractive because of a high benefit to cost ratio and relatively tractable problem,
benefit-to-cost ratio could be as low as 8 for small, low income countries like Liberia and over 300 for a mid size, lower middle income country - a pretty wide range!
The paper estimates that in the long-term implementing across half of all government procurement saves an average of 6.75% on prices paid by government for goods and services, providing some evidence from real world programs.
Their estimated implementation costs look very low for complex projects (but on the other hand they also don't estimate costs of manual processes replaced, which might balance out somewhat)
The problem isn't as tractable as it first looks because you have to convince (many levels of) the governments to change their ways. Theoretical ways to tackle:
advocacy promoting move to e-procurement
but IT firms capable of delivering already commercially incentivised to do this
and governments with pervasive corruption incentivised to ignore!
fund development of "best practice" IT procurement solutions
but in practice the IT solution isn't the hard or expensive bit; it's the integrating with local laws and language, and getting govt departments to adopt it
capacity building and upfront funding for bodies trying to deliver.
if you believe the paper's numbers, could be funded for as little as $22m over 12 years (and may even repayable in later years based on KPIs)
Not a traditional EA opp, but paying a government to implement an IT system to save themselves money is the sort of thing that's so counterintuitive maybe only an EA org would consider it!
The financial side stacks up on paper, but the net impact in terms of things EAs care about like utility is less obvious. Reduced government procurement costs can allow them to do more for less, but it also means local firms earning less. Not all cost savings will be due to corruption and not all of the money saved will be spent well.
Land tenure security - creating a registry of land ownership - making it easier for new landowners to sell or borrow against the value of their land, and enabling for them to spend money improving it without the risk of being dispossessed.
The actual mechanisms by which householders and farmers benefit varies between studies and countries, with some finding no effect
The benefits take some time to accrue (the paper assumes typically 6 to have any effect and estimates the NPV of benefits over 30 years) and meta analysis suggests timing may explain some of the "no effect" results
EA organisations could promote the idea, or even subsidise it, but any actual action is contingent on government action
This idea is well known to development economists and has been heavily promoted by de Soto (I'm amazed the paper didn't namecheck or cite him) in Peru and various other places, so I'm not sure how much EA advocacy would add.
Organisations like the World Bank have supported land registration projects financially and there is some scope for a privately-funded NGO like De Soto's ILD to actually do the hard work of identifying informal landownerss with the local government's blessing
The paper assumes a surprisingly high cost per site to maintain the land registry, so it's not a one-time intervention
Trade - reducing tariffs and trade barriers
Free(r) trade can only be implemented by national governments. The cost/benefit analysis is looking at the costs to negatively affected industries vs the benefits to everyone else across multiples countries, so it's not comparable to GiveWell's estimates
The idea has been promoted/debated by economists since the 1700s and is promoted by multilateral bodies like the WTO/World Bank/IMF, so it's not really clear what EA advocacy would add.
How should we compare their (CCC's) cost-benefit estimates to GiveWell's (GW's) results?
I quickly spot two differences:
GW's benefit estimates are in units of doubling of consumption (interventions are compared to direct cash transfers through Give Directly, itself measured in terms of doubling of consumption), whereas CCC's estimates are in units of value of a statistical life.
CCC's analyses are for large-scale government operations, so
they don't account for counterfactual investments,
they encounter diminishing returns (compared to GW's focus on the marginal dollar).
Points 1. and 2.a. are both indications that CCC's cost-benefit ratios are higher than GW-esque's cost-effectiveness ratios, while 2.b. goes to the other direction.
From the Tuberculosis paper, regarding value of a statistical life (VSL):
The GDP growth in this group of countries outpaces the population growth, so that the VSL grows rapidly over time. In constant 2020 US$ values, the benefit of an averted death is US$ 98,700 (2020), US$ 149,800 (2025), US$ 212,000 (2030), US$ 276,300 (2035), US$ 338,100 (2040), US$ 396,800 (2045), and US$ 456,000 (2050).
In comparison, GW estimates that one can save a life (or have equivalent impact) at about $5000. That's a factor of ~20. [I think this is misleading, so I'd be interested in a more careful comparison here, directly comparing VSL to doubling of consumption].
I'm also not sure how exactly to account for the differences in 2.
GW's benefit estimates are in units of doubling of consumption (interventions are compared to direct cash transfers through Give Directly, itself measured in terms of doubling of consumption), whereas CCC's estimates are in units of value of a statistical life.
I think which metric to pick will depend on one's preferred heuristic for contributing to a better world (somewhat related draft; comments are welcome):
Units of doubling of consumption appear more strictly connected to improving nearterm welfare (as proxied by e.g. quality-adjusted life years).
Units of value of a statistical life, roughly proportional to units of consumption, appear more strictly connected to economic growth (as proxied by e.g. gross world product).
they [the papers] don't account for counterfactual investments,
The papers focus on large scale interventions with massive benefits, so the counterfactual benefits will be pretty small in comparison? There is a chance governments or international organisations go ahead with the interventions funded by GiveWell, but a seemingly much smaller chance that a big government investment has no counterfatual impact due to the potential intervention of other actors?
In comparison, GW estimates that one can save a life (or have equivalent impact) at about $5000. That's a factor of ~20. [I think this is misleading, so I'd be interested in a more careful comparison here, directly comparing VSL to doubling of consumption].
Your BOTEC looks good to me. GiveDirectly's unconditional cash transfers have a benefit-to-cost ratio of 2.4, and GiveWell's cost-effectiveness bar is 10 times that, which suggests a bar for the benefit-to-cost ratio of around 24 (= 10*2.4). So one should expect the cost-effectiveness of the interventions supported by GiveWell to have benefit-to-cost ratios in that ballpark. I agree a more careful comparison would be useful.
Thanks to Vasco for reaching out to ask whether GiveWell has considered:
e-Government procurement (benefit-to-cost ratio of 125)
Trade (95)
Land tenure security (21).
GiveWell has not looked into any of these three areas. We'd likely expect both the costs and the benefits to be fairly specific to the particular context and intervention. For example, rather than estimating the impact of reduced tariffs broadly, we'd ask something along the lines of: What is the intervention that can actually e.g., lead to a reduction in tariffs? On which set of goods/services would it apply? Which sets of producers would benefit from those lower tariffs? And thus, what is the impact in terms of increased income/consumption?
We think there's a decent chance that different methodologies between Copenhagen Consensus Center and GiveWell would lead to meaningfully different bottom line estimates, based on past experience with creating our own estimates vs. looking at other published estimates, although we can't say for sure without having done the work.
Are the numbers comparable to GiveWell, or is one of them more conservative? One data point could be Malaria. Is the Benefit-to-cost ratio GiveWell calculates for e.g. AMF around 48 as well?
>Scale up coverage of long-lasting insecticidal bed nets coverage to 10 percentage points above the 2019 level. Use of chlorfenapir to offset insecticide resistance and social and behavioral change communication to increase the usage including hang-up campaigns.
Thanks for asking, Milli! I have added the following to the post:
I expect the benefit-to-cost ratios of the papers to be overestimates:
The paper on malaria estimates a ratio of 48, whereas I infer GiveWell's is:
35.5 (= 14.8*2.4) for the Against Malaria Foundation (AMF), considering the mean cost-effectiveness across 8 countries of 14.8 times that of cash transfers.
40.8 (= 17.0*2.4) for the Malaria Consortium, considering the mean cost-effectiveness across 13 countries of 17.0 times that of cash transfers.
Actually 24.0 (= 10*2.4) for any intervention, given GiveWell's cost-effectiveness bar of 10 times that of cash transfers? I am confused about many of GiveWell's cost-effectiveness estimates being much higher than their bar. In theory, each intervention should be funded until the marginal cost-effectiveness reaches the bar.
The paper on malaria studies an annual investment of 1.1 G 2020-$, whereas GiveWell's estimates respect marginal donations.
Consequently, assuming diminishing marginal returns, and that GiveWell's estimates are more accurate, that of the paper on malaria is a significant overestimate.
I guess the same reasoning applies to other areas.
Executive summary: The Copenhagen Consensus Center published 12 papers analyzing the benefit-to-cost ratios of potential investments related to the SDGs. The ratios ranged from 18 to 125, much higher than cash transfers.
Key points:
The 12 papers examine investments like agricultural R&D, vaccination, and e-government procurement.
Benefit-cost ratios range from 18 for nutrition to 125 for e-government procurement.
Ratios are much higher than cash transfers and exceed GiveWell's cost-effectiveness bar.
Total annual investment is $41 billion with total benefits of $2.14 trillion.
New potential focus areas with high ratios include e-government procurement, trade, and land tenure.
Conclusions show investing in these areas could generate substantial economic and health benefits.
This comment was auto-generated by the EA Forum Team. Feel free to point out issues with this summary by replying to the comment, andcontact us if you have feedback.
All 12 ratios are much higher than the 2.4 estimated for GiveDirectly's cash transfers to poor households in Kenya.
2.4 refers to the integral of the increase in local real GDP over the 29 months after the transfer as a fraction of the transfer. The integral of an investment in global stocks over 29 months as a fraction of the initial investment is 2.56 (= ((1 + 0.05)^(29/12) - 1)/LN(1 + 0.05)) for the annual real growth rate from 1900 to 2022 of 5 %. So, over 29 months, I think investing in global stocks increases the integral of global real GDP 1.07 (= 2.56/2.4) times as much as GiveDirectly's cash transfers to poor households in Kenya increase the integral of local real GDP.
I think way more time has been invested into GiveWell's recommendations of AMF and Malaria Consortium than the time dedicated to producing the best investment paper on malaria:
A typical paper is written in a few months.
GiveWell has been doing doing cost-effectiveness analyses of AMF's interventions since 2012, and Malaria Consortium's since 2016.
From what I have seen, GiveWell often "goes beyond the papers" in order to really get at the best guess of the cost-effectiveness intervention, often adjusting the results found in the literature.
GiveWell understands well the limitations of naive cost-effectiveness estimates.
I should also note I meant more accurate conditional on a given set of values (namely, value of saving lives as a function of age and country, and value of income compared to health):
GiveWell has spent much more time studying the interventions than figuring out their moral weights.
I tend to think economic growth is a better proxy for contributing to a better world than GiveWell's moral weights, which I suspect put too much weight on health, and do not account for saving lives in low income countries contributing less to the global economy.
I suggest being highly skeptical of the work coming from the Copenhagen Consensus Center. It's founder, Bjorn Lomborg, has on several occasions been found to have committed scientific dishonesty. I wouldn't use this report to make an determinations of what are the "best investments" without independently verifying the data and methodology.
I suggest being highly skeptical of the work coming from the Copenhagen Consensus Center. It's founder, Bjorn Lomborg, has on several occasions been found to have committed scientific dishonesty.
For reference, readers interested in digging further into Bjorn's case can search for "Cases Nos. 4, 5 and 6" in this report. Here is a relevant passage:
If the book [The Skeptical Environmentalist by Bjorn] was intended to be evaluated as science and not as a contribution to the general debate, then in addition the scientific message had been so distorted that the objective criteria for establishing scientific dishonesty had been met. DCSD [The Danish Committees on Scientific Dishonesty] did not find a sufficient basis, however, on which to establish that the defendant had misled his readers with intent or gross negligence. DCSD noted, in this context, that in the preface to the book the defendant had himself drawn attention to the fact that he was no expert in environmental issues.
For what it is worth, none of the papers has Bjorn as one of authors, and all were published in a peer-reviewed journal.
I wouldn't use this report to make an determinations of what are the "best investments" without independently verifying the data and methodology.
I would say that checking the methodology of papers makes sense in general to see how much one can trust their conclusions, regardless of who are the authors.
This is a linkpost for Copenhagen Consensus Center's 12 best investment papers for the sustainable development goals (SDGs), which were published in the Journal of Benefit-Cost Analysis in 2023. Some notes:
Each paper does a cost-benefit analysis which accounts for health and economic benefits. The benefit-to-cost ratios across the 12 papers range from 18 (nutrition) to 125 (e-Government procurement).
All 12 ratios are much higher than the 2.4 estimated for GiveDirectly's cash transfers to poor households in Kenya.
4 are similar to and 8 are higher than GiveWell's cost-effectiveness bar of around 24 (= 10*2.4), equal to 10 times the above.
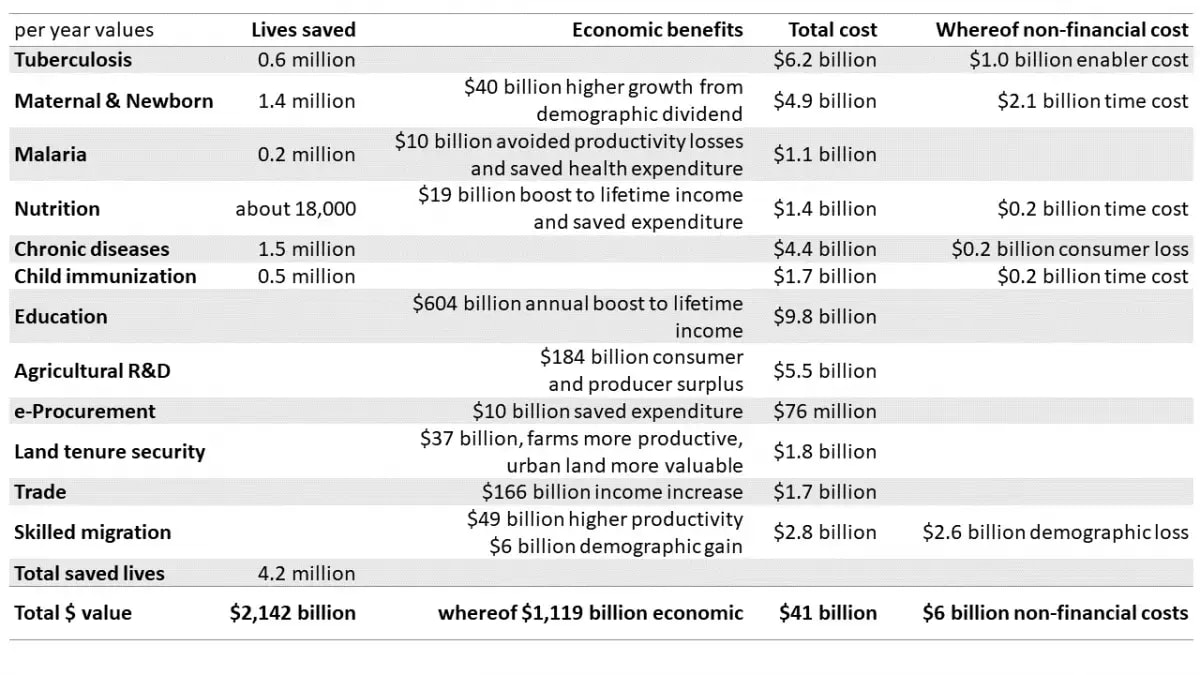
Cash transfers are often preferred due to being highly scalable, but the 12 papers deal with large investments too. As can be seen in the table below, taken from a companion post, all 12 interventions together have:
An annual cost of 41 G 2020-$ (41 billion 2020 USD).
Annual benefits of 2.14 T 2020-$ (2.14 trillion 2020 USD), of which 1.12 T 2020-$ are economic benefits corresponding to 14.6 % (= 1.12*1.13/(8.17 + 0.528)) of the gross domestic product (GDP) of low and lower-middle income countries in 2022.
A benefit-to-cost ratio of 52.2 (= 2.14/0.041), 21.8 (= 52.2/2.4) times that of GiveDirectly's cash transfers to poor households in Kenya.
I expect the benefit-to-cost ratios of the papers to be overestimates:
The paper on malaria estimates a ratio of 48, whereas I infer GiveWell's is:
35.5 (= 14.8*2.4) for the Against Malaria Foundation (AMF), considering the mean cost-effectiveness across 8 countries of 14.8 times that of cash transfers.
40.8 (= 17.0*2.4) for the Malaria Consortium, considering the mean cost-effectiveness across 13 countries of 17.0 times that of cash transfers.
Actually 24.0 (= 10*2.4) for any intervention, given GiveWell's cost-effectiveness bar of 10 times that of cash transfers? I am confused about many of GiveWell's cost-effectiveness estimates being much higher than their bar. In theory, each intervention should be funded until the marginal cost-effectiveness reaches the bar.
The paper on malaria studies an annual investment of 1.1 G 2020-$, whereas GiveWell's estimates respect marginal donations.
Consequently, assuming diminishing marginal returns, and that GiveWell's estimates are more accurate, that of the paper on malaria is a significant overestimate.
I guess the same reasoning applies to other areas.
I think 3 of the papers focus on areas which have not been funded by GiveWell nor Open Philanthropy[2]:
e-Government procurement (benefit-to-cost ratio of 125).
Basic research and development, including capacity building, and technical and policy support with special focus on Low- and Lower Middle-Income countries. Research outcomes are difficult to predict, but an example could be crop yield increases using precision genetic technologies.
Raise immunization coverage from 2022 levels to 2030 target for pentavalent vaccine, HPV, Japanese encephalitis, measles, measles-rubella, Men A, PCV, rotavirus, and yellow fever.
Sufficient staff and resources at all birth facilities to deliver a package of basic emergency obstetric and newborn care and family planning services, including bag and mask for neonatal resuscitation, removal of retained products of conception, clean cord care, uterotonics, pills and condoms etc.
IT systems to manage procurement activities of works, goods, and services required by the public sector resulting in for example more transparent and less corruption-prone project budgeting, submission of bids, bid evaluation, auctions, publication of contract award results, and vendor payments.
Scaling up diagnosis and care, such as modern diagnostics, integration of screening with other health services for early detection, and prevention. Partnering with the community and private sector. Accelerating development of new tools.
Complementary feeding promotion for mothers with children 6−23 months. Multi-micronutrients and calcium supplements to the 40% of pregnant women, that currently take iron and folic acid supplementation.
Regulations, taxes, and information to reduce smoking, consumption of alcohol, salt, and trans-fats. Scale-up eight highly cost-effective clinical interventions, for example basic treatment of cardiovascular disease, depression, and early-stage breast cancer.
Urban and rural land registration, digitizing land registries to improve efficiency and transparency, strengthening institutions and systems to resolve land disputes and manage expropriations over a ten-year implementation period, and land administration operations and land records maintenance over 30 years.
Scale up coverage of long-lasting insecticidal bed nets coverage to 10 percentage points above the 2019 level. Use of chlorfenapir to offset insecticide resistance and social and behavioral change communication to increase the usage including hang-up campaigns.
Structured pedagogy, a coherent package of textbooks, lesson plans, and teacher training and coaching that work together to improve in-class teaching. Teaching according to learning level rather than age or grade, either technology-assisted learning with tablets, or teaching assistants by deploying ‘teaching-at-the-right level’.
I used AI to fix transcription errors, rerrarange the ideas, and suggest tweaks to the title and some sentences.
Three of the most exciting projects to come out of EA in recent years are, in a vague sense, CEA spinouts:
* Kairos is directly a spinout of CEA and now handles most support for university AI safety groups. Basically everyone I've found who knows them is really excited about what they do
* NEST is an opinionated ideas-fi...
This post presents the executive summary from Giving What We Can’s impact evaluation for 2025. At the end of this post we share links to more information, including the full report and...


Interesting list! I had a quick look at the papers for three areas not covered by major EA funders: my thoughts below
e-Government procurement - IT systems to manage government tenders/purchases - making it easy for private sector companies to sell to governments, reducing prices through increased competition and reducing opportunities for corruption.
Looks very attractive because of a high benefit to cost ratio and relatively tractable problem,
The problem isn't as tractable as it first looks because you have to convince (many levels of) the governments to change their ways. Theoretical ways to tackle:
The financial side stacks up on paper, but the net impact in terms of things EAs care about like utility is less obvious. Reduced government procurement costs can allow them to do more for less, but it also means local firms earning less. Not all cost savings will be due to corruption and not all of the money saved will be spent well.
Land tenure security - creating a registry of land ownership - making it easier for new landowners to sell or borrow against the value of their land, and enabling for them to spend money improving it without the risk of being dispossessed.
Trade - reducing tariffs and trade barriers
Thanks for the investigation, David! Strongly upvoted. It does look like the benefit-to-cost ratios are overestimates.