Very nice analysis. One potential confounder could be the unusually strong performance of startups and tech stocks since 2014 due to expansionary monetary policy. I’d be curious to see these numbers broken down by different timeframes: say, the performance of startups founded in 1995-2001, 2001-2008, 2008-2014, and 2014-2022. Perhaps success over the last decade depends strongly on the macro environment — or, maybe building a startup takes long enough that you can outlast any particular business cycle and achieve stable returns.
Although potentially the value of having an additional person wanting to do direct work could also vary based on the similar economic factors. To take a trivial example, that value is basically zero if there is no funding. And if funding is a significant constraint, the worker who the hypothetical worker pushes out by choosing to do direct work was probably pretty effective themselves.
So we should be careful not to adjust the effectiveness of GTE strategies downward based on economic trends without considering whether to adjust the projected benefit of a decision to pursue a direct-work career path for similar factors.
Yeah, this is one of the things I'd like to see, although you could take Ryan's analysis (which focused on 2005-2009) as partially doing what you want.
It's interesting to note that Airbnb was founded in 2008 and Stripe in 2009; these are currently the two most valuable YCombinator companies, which seems like some evidence that you can outlast business cycles (or maybe even that it's good to start in a recession).
When this amount is discounted by 12%/year (average S&P 500 returns)
I believe it would make more sense to calculate the certainty-equivalent return, since entrepreneurship is much riskier than an index fund. A worse but simpler method is to discount by the return of an index fund that's levered up to match the volatility of entrepreneurship, which I'd guess is somewhere around 4–5x leverage, implying a 40–50% annual discount. On the other hand, a startup will have lower correlation to other EAs' portfolios, which argues in favor of starting a startup.
Another approach, which I used in a similar post here, is to estimate the alpha relative to the EA portfolio of a startup vs. a public investment. I came to the same conclusion as you that entrepreneurship looks pretty good (although I was looking at joining a startup as an employee, not founding one).
Could picking small cap stocks or investing in private companies achieve similarly lower correlation with other EAs' portfolios (assuming we don't all pile into the same companies)?
It's possible. Companies all tend to correlate with each other somewhat so you can't get zero correlation, but if you can fund non-startup companies that other EAs don't invest in, then it could make sense to overweight those. One thing that comes to mind is EAs probably overweight certain countries (US, UK, Switzerland) and especially underweight emerging markets.
Thanks! Can you say more about why comparisons to leveraged index funds are useful?
It's not obvious to me that discount rates for capital and labor should be the same; I included the S&P 500 since it was simple, but I don't think there are many people who are going to decide whether or not to start a company based on S&P 500 returns.
Can you say more about why comparisons to leveraged index funds are useful?
It's convenient because it lets you ignore your risk preferences. Making up some numbers, if entrepreneurship has a 20% return, and a leveraged index fund has a 25% return at the same level of risk*, then the leveraged index fund is better no matter how risk averse you are. It doesn't matter how much you care about risk because the two investments are equally risky.
(It's less helpful if the comparison comes out the other way. If a leveraged index fund has only a 15% return, then sufficiently risk-accepting investors prefer the 20% return of entrepreneurship, but risk-averse investors might still prefer an index fund with less leverage.)
*And we assume the returns follow the same distribution and there's no non-financial reason to prefer one over the other.
Sure, my question was more about using the returns to capital as a way to estimate the returns to labor. I see no particular reason why these should be the same (though I understand that if you do make this assumption, leveraged index funds are a reasonable thing to use.)
I'm not entirely sure I understand what you're saying but this is how I think about it:
You have two options (really more, but just two that are relevant): you can start a startup or you can earn to give at a salaried job. If you start a startup, you expect to get paid $X in N years, and you get nothing (or not much) until then. If you work a salaried job, you get paid $Y per year. You can invest that money in public equities. To compare entrepreneurship vs. salaried job, you can look at the expected payoff from entrepreneurship vs. how much money you'd have if you took your salary at the salaried job and invested it in a leveraged index fund, where you add enough leverage to match the risk level of entrepreneurship. These two choices are equally risky, so you can compare them directly in terms of which one has better expected return.
I don't know what you mean about return on capital vs. labor but I hope that makes sense.
Sure, but the salaried job has the added confusion that you get paid annually. It's not the same as investing $X for N years (or (1−d)NX dollars for N years).
I worry that this presents the case for entrepreneurship as much stronger than it is[1]
The sample here is companies that went through Y-Combinator, which has a 2% acceptance rate[2]
As stated in the post, roughly all of the value comes from the top 8% of these companies
To take it one step further, 25% of the total valuation comes from the top 0.1%, i.e. the top 5 companies (incl. Stripe & Instacart)
So at best, if a founder is accepted into YC, and talented enough to have the same odds of success as a random prior YC founder, $4M/yr might be a reasonable estimate of the EV from that point. But I guess my model is more like Stripe and Instacart had great product market fit and talented founders, and this can make a marginal YC startup look much more valuable than it is.
I know you're not explicitly saying that the EV of quitting one's job to start a company is $4M/yr, but I think it's worth spelling out more explicitly how far removed this reference class is from that hypothetical.
A couple of nitpicky things, which I don't think change the bottom line, and have opposing sign in any case:
In most cases, quite a bit of work has gone in prior to starting the YC program (perhaps about a year on average?) This might reduce the yearly value by 10-20%
I think the 12% SP500 return cited is the arithmetic average of yearly returns. The geometric average, i.e. the realized rate of return should be more like 10.4%
#1 seems like a bigger deal if the optimal strategy is to do some startup work, then discontinue if you're not in the top 2 percent as evaluated by YC (because that assessment heavily updates your EV). Presumably there is some cost there -- at a minimum, the discontinuers could have been earning-to-give at a higher-paying job during that time. So I think the analysis could critically hinge on how accurately one can gauge their odds of being in the top 2 percent in a low-cost manner.
I don't want to put words in your mouth, but I think you might be modeling this as something like "2.5% chance of $4M, 97.5% chance of zero, therefore all numbers should be multiplied by 0.025", and that's not correct. E.g. I was rejected from YCombinator, but still had returns roughly similar to what's estimated here.
I think you might also be implying that the average EA is less qualified than the average YCombinator participant, even conditional on them being accepted to YCombinator. I have less data here, but of the two EA-ish companies I know that went through YCombinator, one had a ~$0 exit, and the other $500 million. At least within this (admittedly tiny) data set, the returns look pretty good.[1]
You list Stripe's founders as being exceptional, which they surely are, but I could imagine Patrick explicitly earning to give if he had been born 10 years later.
I'm definitely not suggesting a 98% chance of zero, but I do expect the 98% rejected to fare much worse than the 2% accepted on average, yes. The data as well as your interpretation show steeply declining returns even within that top 2%.
I don't think I implied anything in particular about the qualification level of the average EA. I'm just noting that, given the skewedness of this data, there's an important difference between just clearing the YC bar and being representative of that central estimate.
If someone is just graduating and interested in entrepreneurship, what do you think is the probability that they will be accepted into YC? The original article mentions a 2.5% acceptance rate at YC of those who apply. Do you need prior success in order to apply?
No, you don't need prior success to apply (it's specifically targeted at people without prior startups), but it is highly selective. A suggestion that I've heard and think seems reasonable is to spend 6-12 months trying to build up enough of a company to be accepted to YC (or another top incubator), and then shut down the business if you don't get in.
Note that I'm using YCombinator here as a convenience sample – it's not the right choice for everyone (I didn't go through it with either of my companies, and think that was the correct decision in both cases).
The period from which your data comes is anomalous. 2014-2021 was a massive financial asset bubble and VC backed startups were at the center of it. It will go down as one of the craziest periods of speculative mania and loose financial conditions in history.
Entrepreneurship is about to revert to its norm of being A LOT more challenging than people today currently appreciate. Do not make a career decision to become an entrepreneur based on an overly rosy view of your probability of success that is informed by recent times. Financial conditions are cyclical.
Can you say more about the 20% per year discount rate for community building?
In particular, is the figure meant to refer to time or money? I.e. does it mean that
you would trade at most 0.8 marginal hours spent on community building in 2024 for 1 marginal hour in 2023?
you would trade at most 0.8 marginal dollars spent on community building in 2024 for 1 marginal dollar spent on community building in 2023?
something else? (possibly not referring to marginal resources?)
(For money a 20% discount rate seems very high to me, barring very short timelines or something similar. It would presumably imply that you think Open Phil should be spending much more on community building until the marginal dollar doesn't have such high returns anymore?)
Note that these numbers include illiquid (pre-exit) valuations.
2021 and early 2022 was a huge bull market — many private companies raised money in insane valuations that aren’t realistic today. Suppose they didn’t raise money again or go public in mid/late 2022. In that case, it’s likely that their valuations were last updated around the bull market's peak, in which case they're almost certainly systematically inflated.
Do we have partial data from which we could hazard a guess on what percentage of income generated by a hypothetical group of people who started businesses with an EtG plan would ultimately be donated to effective charities? In addition to taxes, living expenses, etc., I assume some people will give less than they had planned going in.
It doesn't seem like this analysis include probablilities of Entrepreneurship and Startups working out (don't know percentages here, maybe 10-20%?. And among those that do work out only a small proportion would reach this level of Y-combinator success)
Would be interested in a head-to-head analysis vs. high ability people getting say a tech job for 150k a year (and increasing) with 100% probability of the money?
The denominator is all YCombinator startups (including ones that failed), but it doesn't include people who tried to get into YCombinator but didn't succeed.
I would also be interested in the analysis you propose.
This is a great writeup, and I generally agree we might be underestimating entrepeneurship for ETG.
However, as others said, 2014 onwards seems like a macroeconomic anomaly, and an even bigger anomaly if you focus on just tech startups. YC is predominantly tech, and I think the returns on tech will regress to the mean, so your numbers are inflated there.
The bigger issue is using YC as a baseline. It's incredibly hard to get into YC (they are currently at a <1% acceptance rate) and YC focuses on tech. The average entrepeneur is likely to make significantly less than the entrepeneur who got into YC with a tech startup. I would like to see someone (I'm too busy, sorry) run the numbers on the average entrepeneur/founder in north america or europe, and I think the numbers will be significantly lower.
This is anecdotal, but many incubators and startup advisors mention it's better to work for a corporate or scaleup if you're looking to become rich, the vast majority of founders don't make it.
Having said that, I think entrepeneurship (especially EA entrepeneurship) is still a very compelling story in terms of ETG and expected impact.
I used an estimate of 2.3 people per founding team and average equity ownership of 35% from the original 80 K article. These numbers could probably use an update.
Unless it's a weighted average equity ownership, I would expect the numbers to be worse than this as generally you'd expect people to get more diluted the more successful the company was
Thanks! You can read Ryan's article for how he determined the weighting. He basically explicitly calculated it for some of the top companies, then made a guess about the rest.
Related thought: should we be trying harder to do outreach to early stage startup founders? Could potentially be very high-EV from a funding perspective
AI Use Note: Main body text entirely human written. Claude (Opus 4.8) helped develop models of animal life histories in the appendix.
Cross-posted from Good Structures.
Executive Summary
* Animal advocates sometimes make claims like “there are X of this animal...
“How long have you been v*g*n?”
This is one of the most common icebreakers at animal protection events. It’s a baseline assumption, and it mostly holds true: if you’re out advocating for animals not to be tortured or abused, realistically these days you are v**n, or close. And it makes for good conversation. It seems fairly safe to assume when you meet strangers.
But this assumption is hurting the movement in a way which we don’t always notice: someone new comes into the sp...
Summary
Back in November 2023 I posted here to launch Spiro and raise our first $198k. Two and a half years later this is an update and a fundraiser for the next step.
The short version: we've now reached over-5,900 people with TB preventive medicine, including over 3,000 children under five years old. Our early results have held up well an...
I repeat his analysis, and find that this number is now substantially higher: $3.8-9.9M/year
When this amount is discounted by 12%/year (average S&P 500 returns) this falls to $1.9-4.3M/y, and with a 20%/year discount (a number I've heard for returns to community building) it falls to $1.1-2.9M/y.
Note that these numbers include illiquid (pre-exit) valuations.
Major Results
Discount
All companies
Excluding post-2019
0% discount
$3.77M/y
$8.17M/y
12% discount
$1.98M/y
$4.28M/y
20% discount
$1.34M/y
$2.90M/y
Average founder income under different discount rates. “All companies” includes in the denominator every company incubated by YCombinator; “excluding post-2019” excludes companies incubated after 2019 (which presumably are less likely to make it to the list of top YCombinator companies by valuation, and therefore arguably should be excluded from consideration).
This table is the same as the above except it e.g. counts a company which has been around for 4 years twice as much as one which has been around for 2 years. I.e. this table is the expected value of a founder-year, whereas the previous table is the expected annual value of founding a company. I’m not sure which is more intuitive.
Commentary
Background: See this 80k article for the basic case behind considering entrepreneurship for earning to give reasons.
These numbers seem fairly high, and may indicate that earning to give through entrepreneurship is a good path for those who have solid personal fit (with the usual caveats about only pursuing ethical startup careers; see also my analysis of YCombinator fraud rates).
With a 20% annual discount the numbers are not that far off from what I've heard as higher-end estimates of the value of direct work, and I expect that there is a fairly strong correlation between being at the higher end of entrepreneurship returns and being at the higher end of direct work, so this doesn't seem like that strong of an argument for entrepreneurship ETG over direct work.
My impression is that these numbers are roughly similar to average quantitative finance income, so I’m not sure there’s much of an argument for one over the other based on this data (from an income perspective).
Note that the vast majority of founders who apply to YCombinator are rejected, and this is not considered in these estimates.
Appendix A: Methods and Data
Note: if you know Python, reading the Jupyter notebook might be easier than following this document.
Methods
Used this list of YCombinator top companies and tried to find public information about their most recent valuation. Importantly, note that this is including pre-exit valuations.
For publicly traded companies, I used their market capitalization at the time of writing (rather than when they IPO’d).
I used an estimate of 2.3 people per founding team and average equity ownership of 35% from the original 80 K article. These numbers could probably use an update.
The discount was calculated using a straightforward geometric discount, i.e. receiving $N in Y years with discount rate d has a net present value of (1-d)^Y * N.
I assume that everything not on that list is valued at zero. This is obviously an underestimate; but I think it’s not too far off:
I estimate the value of the company at the bottom of the list (Karbon Card) at $60M
If the 1,788 companies started after 2019 who are not in this list were all valued at $60M, this would increase the total valuation by $107B = 19.5%
This is a very conservative upper bound, my guess is that the actual increase would be closer to 5%
But this is something I would appreciate more people doing research into
Missing Data
I wasn’t able to find public valuation information for about 20 of the companies in that top list.
I assumed that these were valued at zero – this is probably overly conservative, and perhaps doing some sort of linear interpolation based on the company’s rank would make more sense.
These companies tended to be smaller though, so I’m guessing it won’t affect the final results by too much.
Data and Code
Data is here, in both human and machine-readable formats.[2]
A notebook containing all the calculations can be found here.
You should be able to replicate all these results by just running the notebook with the data: download the “machine readable” tab as a CSV and then upload it to the notebook.
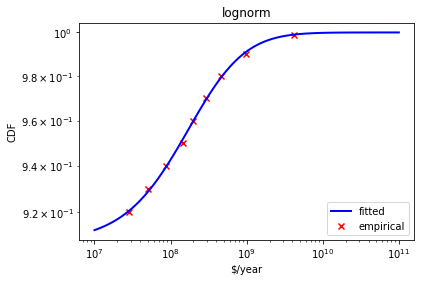
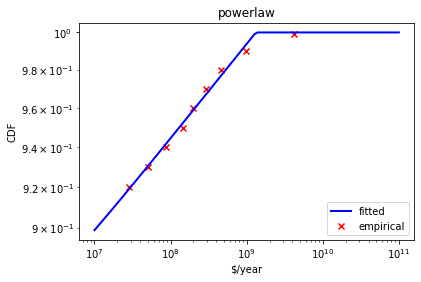
Appendix B: Alternative Approach: Distribution Fitting
An alternative approach I considered was trying to fit a theoretical distribution to the empirical data. Unfortunately, I couldn’t make this work.
I attempted to fit various probability distributions to these data by assuming my empirical data set matched the top 10% of YCombinator companies and then matching the cumulative distribution function to my results. I was able to fit several distributions reasonably well, but their parameter values were implausible, and I think this is just an example of how you can fit any data if you give yourself enough parameters. (Although you can see that the normal distribution does not at all fit the data, indicating that this isn’t complete over fitting.)
These graphs can be replicated by running the notebook. I would appreciate improvements to this work by others (see “Future Work” below).
Appendix C: Comparison to Ryan’s Analysis
Step
My Factor
My Analysis
Ryan’s Factor
Ryan’s Analysis
Total Value
$561.50B
$26.00B
Per Company
3951
$142.12M
(unpublished)
Per founding team
2.8
$49.74M
2.8
$48.00M
Per Founder
2.3
$21.76M
2.2
$18.00M
Per Year
4.6
$4.67M/y
7
$2.50M/y
Differences in calculation in this analysis versus Ryan’s. At each step of the table, you successively divide the previous row by the given factor. Note that the final result in “my analysis” is slightly off from the above results because this table just uses the global average company age (to be consistent with what Ryan did) instead of the more precise measure of calculating the value per year on a per company basis.
The major difference between my and Ryan’s estimates appears to be that the average company age is 4.6 years in my sample, versus 7 in his. I’m not sure if this is because companies are growing faster than they used to, or if this is just some quirk of the data.
Appendix D: Future Work
There are several weekend projects that I would be interested for people to do:
Get better data on average founding team size and company ownership percentage, and redo my calculations using those numbers
Replicate this with TechStars or another incubator
Sensitivity analysis: I’ve made a bunch of assumptions about how to handle missing data etc. – Try making different assumptions and see how much this changes the data
Try to fit a theoretical distribution to this empirical data (see “Distribution Fitting” above)
Repeat this but only use liquid assets (or apply some discount to illiquid assets). I’m not entirely sure what you do here with companies that have substantial illiquid assets – it’s weird to e.g. value having founded Stripe at 0, but I’m not sure what the appropriate discount factor is.[3]
Repeat this but assume that people work on startups for some amount of time (6 to 24 months seems reasonable) before starting YCombinator
Ryan Carey notes that many people who try to get into YCombinator fail, so you may additionally want to incorporate that into the value calculation.
Collect some other useful statistics from this or adjacent data sets:
What’s the distribution of times to exit? Particularly for people who worry that things might get weird soon with AI, it’s helpful to know how quickly they could exit.
What’s the total/average value of each YCombinator batch?
Repeat this but calculate the geometric mean, instead of the arithmetic one.
If you are (or are friends with) a venture capitalist, they probably have access to databases which are way better than the publicly available stuff, and you could repeat this process with better data. Notably: you could examine the entire distribution of outcomes, not just the top ~10%.
This analysis assumes that founders are risk neutral and have linear utility in money. Neither assumption is really accurate – you could repeat this analysis while modifying those assumptions.
Thanks to Ryan Carey for many helpful comments on a draft of this.


Very nice analysis. One potential confounder could be the unusually strong performance of startups and tech stocks since 2014 due to expansionary monetary policy. I’d be curious to see these numbers broken down by different timeframes: say, the performance of startups founded in 1995-2001, 2001-2008, 2008-2014, and 2014-2022. Perhaps success over the last decade depends strongly on the macro environment — or, maybe building a startup takes long enough that you can outlast any particular business cycle and achieve stable returns.
Although potentially the value of having an additional person wanting to do direct work could also vary based on the similar economic factors. To take a trivial example, that value is basically zero if there is no funding. And if funding is a significant constraint, the worker who the hypothetical worker pushes out by choosing to do direct work was probably pretty effective themselves.
So we should be careful not to adjust the effectiveness of GTE strategies downward based on economic trends without considering whether to adjust the projected benefit of a decision to pursue a direct-work career path for similar factors.
Yeah, this is one of the things I'd like to see, although you could take Ryan's analysis (which focused on 2005-2009) as partially doing what you want.
It's interesting to note that Airbnb was founded in 2008 and Stripe in 2009; these are currently the two most valuable YCombinator companies, which seems like some evidence that you can outlast business cycles (or maybe even that it's good to start in a recession).