Comments
Predicting the Value of Small Altruistic Projects: A Proof of Concept Experiment.

tl;dr^2: We could continuously forecast the value of small projects, choose the most valuable and informative ones, carry them out, and then make better forecasts and choose better projects with each round. I have a small experiment which does that. If this sounds like something you might want to participate in, sign up here.
tl;dr: I conducted an experiment to forecast the impact of small altruistic projects. Forecasters attempted to predict upvotes, because I initially thought that they would correlate more robustly with impact, and because upvotes are appealingly simple as a metric, and thus easy to forecast. Forecasters proved somewhat able to produce predictions which discriminated between projects with more upvotes, and projects with less upvotes, but were generally too optimistic. And, in hindsight, upvotes aren't that great a metric for impact, so, going forward, I'd probably have forecasters predict a scoring rubric, i.e., an aggregate of different metrics, graded by more than one judge. Nonetheless, I think that the forecasting pipeline in this experiment is interesting, and might help the EA community more systematically identify valuable small projects to carry out, in contrast with today, where individuals or EA groups carry out projects more idiosyncratically. Because the experiment was very underpowered, I'm looking for volunteer participants to expand it.
I report the outcomes of a forecasting experiment in which 10 forecasters predicted the value of 20 potential altruistic projects. I then carried out 8, of which I made 5 public–an additional project developed into my Summer Research Fellowship at FHI.
Overall, the experiment was underpowered (n=10 forecasters, n=5 published projects, n=135 predictions (246 including bots, more on that below)). Nonetheless, I think that the idea is promising, and I elaborate on some interesting properties of the prediction setup, the problems in the EA community it may solve, and why I'm personally excited about it. I'm considering scaling it up somewhat; thoughts and ideas are welcome.
If you'd be interested in participating in a scaled-up version of this experiment or in later forecasting experiments, fill out this form.
Previous literature on the EA forum:
Thanks to Andis Draguns, terraform, Ray, Ozzie Gooen, Misha Yagudin, Cadillion, Gavin Leech, Datscilly and Holomanga for taking part in this project as forecasters; congratulations to Gavin Leech for overall being the most accurate forecaster. Thanks to Ozzie Gooen et. al. for creating foretold, to Jaime Sevilla for providing feedback on ideas, and to terraform for encouragement and funding. Thanks to various people on the EA Editing and Review Facebook group for feedback.
The setup of the experiment was as follows:
This setup can be understood as having two steps, similar to those in Babble and Prune (a sequence on LW):
The forecasts for this experiment were made in foretold, a prediction platform geared towards performing experiments, which made this experiment easier. In particular, it was more convenient than sharing thoughts using Google Docs, or Google Sheets. Besides reducing the hassle in carrying out the experiment, it is possible that foretold may have acted as a tool for thought, such that it existing may make it easier to come up with experiments like this, in the same way that Guesstimate makes the thought "I'll conduct a Monte Carlo simulation to quantify my uncertainty" easier to think.
Scoring rule
(Some familiarity with scoring rules is assumed in this section. See: Brier score and Proper scoring rule)
Forecasters labored under a collaborative scoring rule I created, inspired by Shapley Values, such that I first produced a prior by instantiating different perspectives (see below), and each forecaster was rewarded in proportion to:
1/2 * (The information they added over that prior, excluding other forecasters) + 1/2 * (The information other forecasters added over that prior).
Note that this scoring rule is both roughly proper and solves all incentive problems in Incentive Problems in Current Forecasting Tournaments.
In this particular case, "information added" is defined in terms of the Kullback–Leibler divergence between a prediction and the resolution. However, the spirit might be easier to understand (and compute) in terms of the Brier score. That is, the scoring rule could have been
1/2 * (The forecaster's Brier score - the Brier score of the prior) + 1/2 * (The aggregate without the forecaster's Brier score - the Brier score of the prior).
In practice, when converting the score into a monetary reward, a constant would have to be added so that the reward is never less than $0, but I didn't think about that beforehand.
I also had a payout for insightful comments, such that the nth most upvoted comment would get $36*(2/3)^(n-1). Total payouts were $259 (or an average payout of $25.9 per forecaster), of which around $100 were given out for comments, which was a larger proportion than I expected. One forecaster didn’t receive a payout because he didn’t make a prediction on any project which was then carried out.
Note that the projects were not chosen so as to maximize impact, but rather as to maximize information about whether their value could be predicted.
We observe that:
Project 1: Write up further thoughts on Shapley values.
Output: Here are the further thoughts. I provide some further thoughts after my first post on Shapley values, including a procedure for allowing two philanthropic funders with slightly different values to share the burden of funding interventions they value differently, and an impossibility theorem for value attribution.
Outcome: Nothing much happened, but I do keep the idea of Shapley values in my head and occasionally use it (e.g., when thinking about designing better incentives for forecasters.)
Predictions:
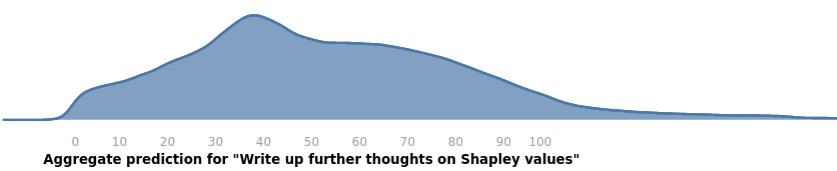
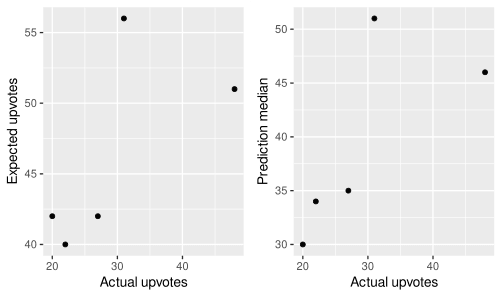
Actual upvotes after one month: 31
Project 2: Identify previous examples of technological projects with clear long-term goals, and then produce estimates of the time required to achieve those goals to varying degrees.
Output: Here is a LW post about this. This then gave me intuitions about technological progress, but led me to realize that what I actually wanted was something more systematic, so I ended up writing a post on A prior for technological discontinuities, which I think was significantly more valuable.
Outcome: Better personal intuitions about technological progress, a rough prior for technological discontinuities.
Predictions:
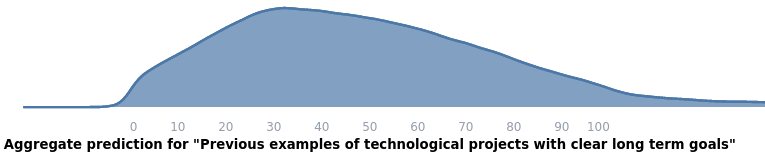
Actual upvotes after one month: 20 for the first post, 49 for the second one. I'm taking 49 as the resolution.
Project 3: Investigate international supply chain accountability as cause X.
Output: Here is an EA forum post.
Outcome: Unfortunately I posted this on April Fools' day together with other "New Top EA Cause Area" posts, and it didn't get taken too seriously. But I do still think that this cause could potentially use many millions of dollars per year from the EA community.
Predictions:
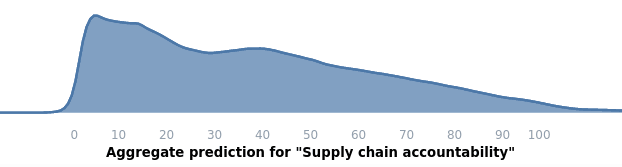
Actual upvotes after one month: 22
Project 4: Look into EA literature.
Output: I looked into some past examples of literature which might have influenced the world in some way, available as a comment here. Originally this was part of a longer piece, which I ended up not posting.
Outcome: I became marginally more enlightened about the role of literature in history.
Predictions:
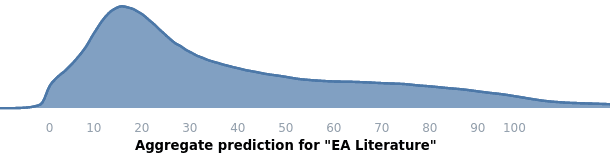
Actual upvotes after one month: 20
Project 5: Review two books on survey making.
Output: Here is the review.
Outcome: It spread the knowledge among some people that I was available to ask questions about survey-making. In particular, some people later reached out to me for help with surveys for their projects, and my help might have been valuable.
Predictions:
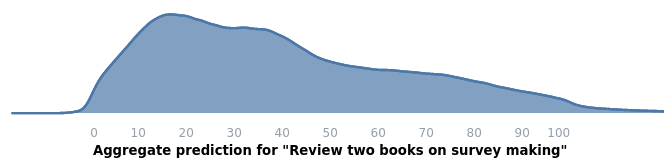
Actual upvotes after one month: 27
Other projects
There were three further projects which I carried out but which for various reasons didn't end up posting publicly: Some historical research was too sensitive, and I made two suggestions privately by email rather than by writing a post publicly.
A further idea was my proposal for my Summer Research Fellowship at FHI, though it changed upon execution. The predictions for that project were:
I take these data-points as further evidence that this setup is interesting or worth it; arguably a major take-away for this project is “a fairly simple forecasting system is able to produce a project which gets accepted to the FHI summer fellowship.” Because the program got ~300 applications, but only 27 participants were accepted, this puts this forecasting setup on the top 9% of applicants in terms of some fuzzy “optimization power” (though this is a simplification, because the project proposal was probably one of many factors.)
The value which the forecasters provided was distributed like a power-law, with the top few forecasters providing most of the value. For example, the most upvoted forecaster received 43% of upvotes. Comments by forecasters were fairly valuable, for example, some pointed to previous similar efforts, to possible research directions, or gave caveats and warnings.
I also recruited some participants from the LessWrong Slack group. One of them, who is a regular there and had made valuable comments in the past, turned out to behave like a troll and made somewhat unpleasant or unproductive comments (e.g., writing “I was looking at a tree outside and this is what it said” as a comment rationale), which in the end I decided not to censor. They also blatantly attempted to manipulate the market by inputting high predictions for the projects they personally wanted to be carried out, rather than making honest predictions.
As well as giving my all-things-considered forecast, I also forecasted using different perspectives, using foretold's bot functionality, and this defined a prior against which forecasters were compared. I created bots for the following perspectives:
It was disappointing, but not surprising, to see that the Bent Cynic, the part of me which I associate with being depressed, had the best score not only among all perspectives, but also among all participants. My interpretation is that this perspective is able to see through social fictions and sympathetic lies, which improves its accuracy. But other explanations are possible, such as forecasters giving too much weight to an out of distribution historical base rate.
Additionally, the presence of a "historical extrapolator", "unrepentant insider" and "uniform distribution" bots made the aggregate predictions be overly optimistic, and the presence of many bots made the aggregate slightly sticky; i.e., each individual prediction couldn’t change the aggregate all that much.
Initially, I thought that forecasting popularity on the Forum or LW would be a good enough proxy for the projects’ value, if perhaps far from perfect. I'd ideally want something like an efficient market in impact certificates populated by trustworthy altruists instead.
Here are some factors that might be reducing the correlation between upvotes and value, based on my own judgement and some light data analysis. Due to those limitations, in addition to forecasts of popularity, I also ended up paying attention to the comments under the forecasts, to whether a project could cause harm, and to personal taste when deciding which projects to carry out.
However, despite those limitations, the number of upvotes does discriminate between more and less valuable projects, to a certain extent. For example, I took 25 randomly selected EA forum posts posted during July, and rated them on a 1-10 scale according to how valuable I thought they were, and the correlation between that and upvotes had an R^2 = 0.2715 (subjectively, a small/medium correlation).
From where I'm standing now, one could have forecasted a rubric of measures, possibly decided by a group of trusted judges after the project is completed, in a way similar to what Charity Entrepreneurship does, or what 80k used to do. Alternatively, one could have tried to compare the value of each project to e.g., the value of a QALY, or to a set of previously completed projects (and forecast said value beforehand). Further, in hindsight it would have been more informative to forecast the value of a project per unit of time, rather than the total value.
I think that a setup like the above could develop into something more widely useful, though this first proof of concept was very under-powered and maybe not that informative. One reason I'm excited about this is that successive prediction → implementation cycles could each bring their own improvement:
Note that the loop is recursive, but it doesn't necessarily have to keep increasing forever. For example, there might be a ceiling to how good forecasts can be.
Further:
Overall, if it is the case that EA is vetting constrained, a prediction pipeline like the one in this experiment could be created to solve this problem by identifying both projects with high expected value and individuals who can carry them out. Note that many kinds of people could be used, not just forecasters:
In fact, the most time-consuming part of this project was not designing the experiment or doing the forecasting, but actually carrying the projects out. Nonetheless, it is not clear whether forecasting is currently cheap enough to be scalable.
If you would be interested in participating in a scaled-up version of this experiment (as a project-implementer, forecaster, etc.), or in later forecasting experiments, fill out this form. I'm unsure about whether to scale this experiment, but if I do, I expect both recruitment to be a bottleneck and this first proposal to be read by more people than any subsequent announcement, hence the link now.
Conflict of interest: I've worked in the past as a paid contractor for foretold/Ozzie Gooen. terraform provided 2/3rds of the payout funding.


This was interesting!
I do think that the forecasters seem to have been starting from a bad base rate (rather than using "sympathetic lies"). Relatively few posts about original topics (rather than e.g. org updates) hit 50 karma, and comments do so even less often. But the posts and comments we are most likely to read are unusually likely to be the high-karma ones; I wouldn't be surprised if people tend to overestimate their frequency.
As one extra data point: When I look at the EA Forum profile of users whose Forum posts are relatively well-known, I'm often quite surprised:
This seems pretty consistent with the explanation Aaron provides.
(Also, I too found this an interesting post!)
Then, there is Buck.