Conventional wisdom says charity cost-effectiveness obeys a power law. To my knowledge, this hypothesis has never been properly tested. So I tested it and it turns out to be true.
(Maybe. Cost-effectiveness might also be log-normally distributed.)
- Cost-effectiveness estimates for global health interventions (from DCP3) fit a power law (a.k.a. Pareto distribution) with α=1.11. [More]
- Simulations indicate that the true underlying distribution has a thinner tail than the empirically observed distribution. [More]
Cross-posted from my website.
Fitting DCP3 data to a power law
The Disease Control Priorities 3 report (DCP3) provides cost-effectiveness estimates for 93 global health interventions (measured in DALYs per US dollar). I took those 93 interventions and fitted them to a power law.
You can see from this graph that the fitted power law matches the data reasonably well:
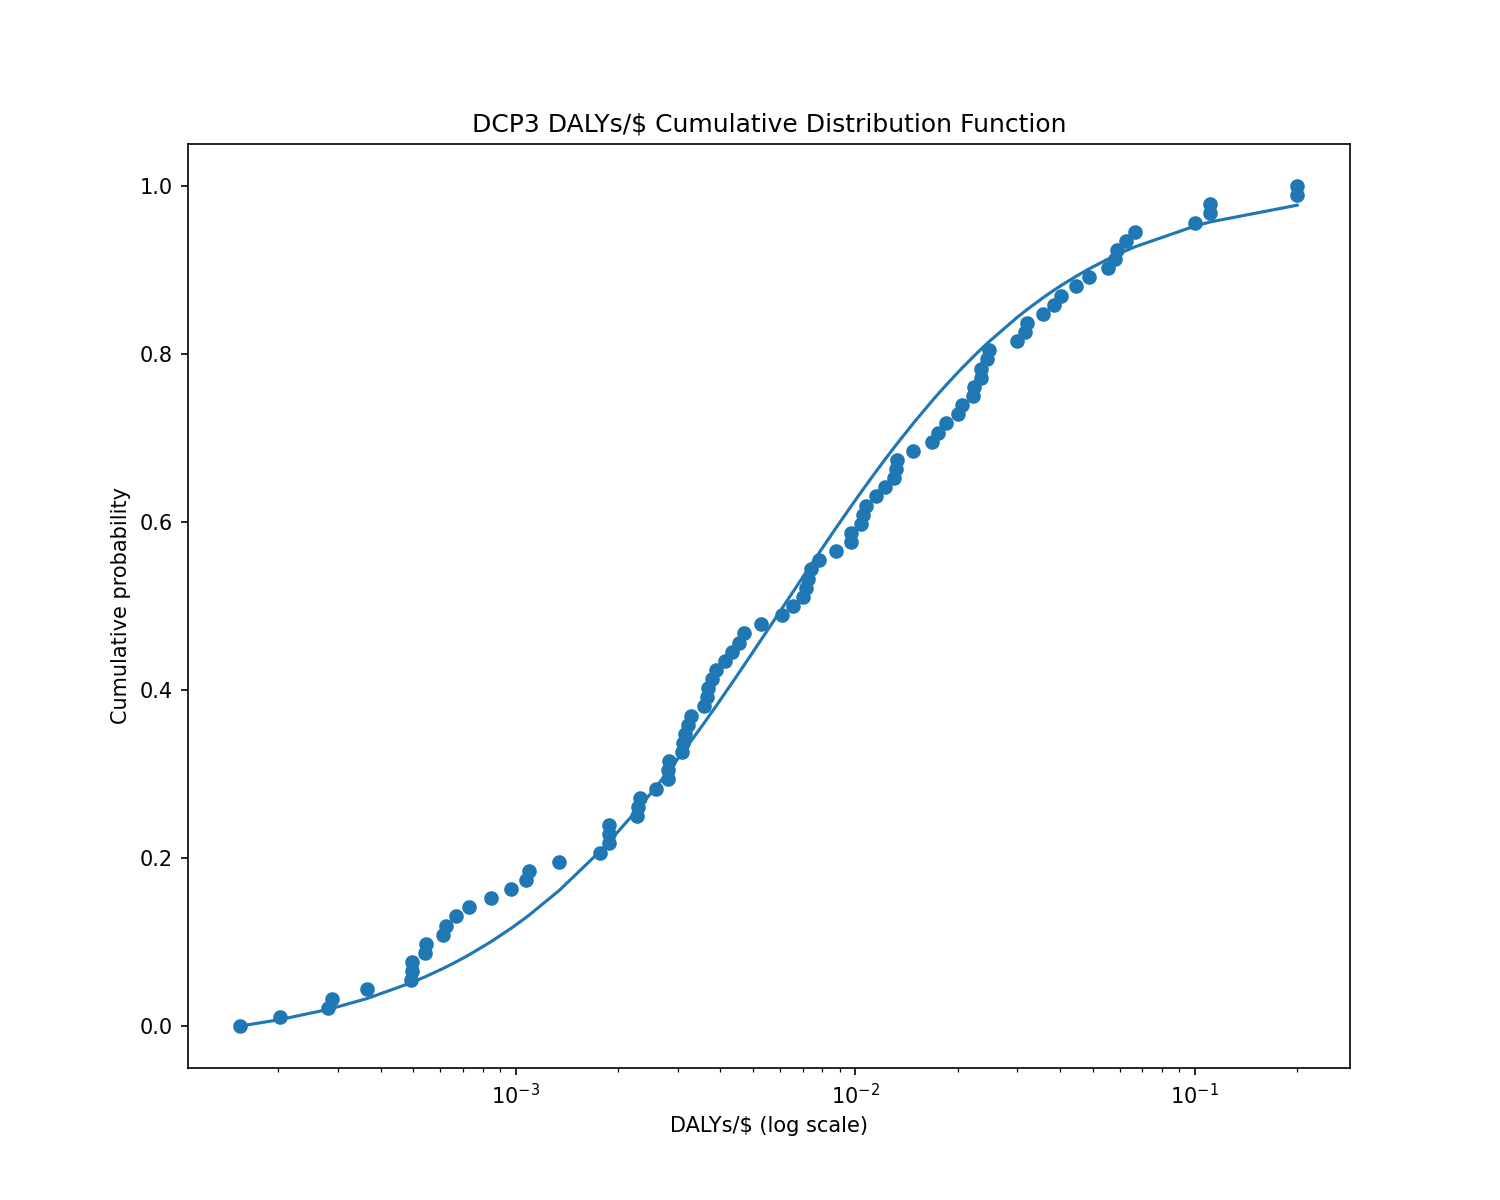
To be precise: the probability of a DCP3 intervention having cost-effectiveness x is well-approximated by the probability density function f(x)=1.11x2.11, which is a power law (a.k.a. Pareto distribution) with α=1.11.
It's possible to statistically measure whether a curve fits the data using a goodness-of-fit test. There are a number of different goodness-of-fit tests; I used what's known as the Kolmogorov-Smirnov test. This test essentially looks at how far away the data points are from where the curve predicts them to be. If many points are far to one side of the curve or the other, that means the curve is a bad fit.
I ran the Kolmogorov-Smirnov test on the DCP3 data, and it determined that a Pareto distribution fit the data well.
The goodness-of-fit test produced a p-value of 0.79 for the null hypothesis that the data follows a Pareto distribution. p = 0.79 means that, if you generated random data from a Pareto distribution, there's a 79% chance that the random data would look less like a Pareto distribution than the DCP3 data does. That's good evidence that the DCP3 data is indeed Pareto-distributed or close to it.
However, the data also fits well to a log-normal distribution.
Pareto and log-normal distributions look similar most of the time. They only noticeably differ in the far right tail—a Pareto distribution has a fatter tail than a log-normal distribution, and this becomes more pronounced the further out you look. But in real-world samples, we usually don't see enough tail outcomes to distinguish between the two distributions.
DCP3 only includes global health interventions. If we expanded the data to include other types of interventions, we might find a fatter tail, but I'm not aware of any databases that cover a more comprehensive set of cause areas.
(The World Bank has data on education interventions, but adding one cause area at a time feels ad-hoc and it would create gaps in the distribution.)
Does estimation error bias the result?
Yes—it causes you to underestimate the true value of α.
(Recall that the alpha (α) parameter determines the fatness of the tail—lower alpha means fatter tail. So estimate error makes the tail look fatter than it really is.)
There's a difference between cost-effectiveness and estimated cost-effectiveness. Perhaps estimation error follows a power law, but the true underlying cost-effectiveness numbers don't. And even if they do, our cost-effectiveness estimates might produce a bias in the shape of the fitted distribution.
I tested this by generating random Pareto-distributed data to represent true cost-effectiveness, and then multiplying by a random noise variable to represent estimation error. I generated the noise as a log-normally-distributed random variable centered at 1 with σ=0.5 (colloquially, that means you can expect the estimate to be off by 50%).
I generated 10,000 random samples at various values of alpha, applied some estimation error, and then fit the resulting estimates to a Pareto distribution. The results showed strong goodness of fit, but the estimated alphas did not match the true alphas:
true alpha 0.8  -->  0.73 estimated alpha (goodness-of-fit: p = 0.3)
true alpha 1.0  -->  0.89 estimated alpha (goodness-of-fit: p = 0.08)
true alpha 1.2  -->  1.07 estimated alpha (goodness-of-fit: p = 0.4)
true alpha 1.4  -->  1.22 estimated alpha (goodness-of-fit: p = 0.5)
true alpha 1.8  -->  1.54 estimated alpha (goodness-of-fit: p = 0.1)
To determine the variance of the bias, I generated 93 random samples at a true alpha of 1.1 (to match the DCP3 data) and fitted a Pareto curve to the samples. I repeated this process 10,000 times.
Across all generations, the average estimated alpha was 1.06 with a standard deviation of 0.27. That's a small bias—only 0.04—but it's highly statistically significant (t-stat = –15, p = 0).
A true alpha of 1.15 produces a mean estimate of 1.11, which equals the alpha of the DCP3 cost-effectiveness data. So if the DCP3 estimates have a 50% error (σ=0.5), then the true alpha parameter is more like 1.15.
Increasing the estimate error greatly increases the bias. When I changed the error (the σ parameter) from 50% to 100%, the bias became concerningly large, and it gets larger for higher values of alpha:
true alpha 0.8  -->  0.65 mean estimated alpha
true alpha 1.0  -->  0.78 mean estimated alpha
true alpha 1.2  -->  0.87 mean estimated alpha
true alpha 1.4  -->  0.96 mean estimated alpha
true alpha 1.6  -->  1.03 mean estimated alpha
true alpha 1.8  -->  1.11 mean estimated alpha
If the DCP3 samples have a 100% error then the true alpha is 1.8—much higher than the estimated value of 1.11.
In addition, at 100% error with 10,000 samples, the estimates no longer fit a Pareto distribution well—the p-value of the goodness-of-fit test ranged from 0.005 to <0.00001 depending on the true alpha value.
Curiously, decreasing the estimate error flipped the bias from negative to positive. When I reduced the simulation's estimate error to 20%, a true alpha of 1.1 produced a mean estimated alpha of 1.14 (standard deviation 0.31, t-stat = 13, p = 0). A 20% error produced a positive bias across a range of alpha values—the estimated alpha was always a bit higher than the true alpha.
Future work I would like to see
- A comprehensive DCP3-esque list of cost-effectiveness estimates for every conceivable intervention, not just global health. (That's probably never going to happen but it would be nice.)
- More data on the outer tail of cost-effectiveness estimates, to better identify whether the distribution looks more Pareto or more log-normal.
Source code and data
Source code is available on GitHub. Cost-effectiveness estimates are extracted from DCP3's Annex 7A; I've reproduced the numbers here in a more convenient format.

In 2011, GiveWell published the blog post Errors in DCP2 cost-effectiveness estimate for deworming, which made me lose a fair bit of confidence in DCP2 estimates (and by extension DCP3):
I agree with their key takeaways, in particular (emphasis mine)
That said, my best guess is such spreadsheet errors probably don't change your bottomline finding that charity cost-effectiveness really does follow a power law — in fact I expect the worst cases to be actively harmful (e.g. PlayPump International), i.e. negative DALYs/$. My prior essentially comes from 80K's How much do solutions to social problems differ in their effectiveness? A collection of all the studies we could find, who find:
Regarding your future work I'd like to see section, maybe Vasco's corpus of cost-effectiveness estimates would be a good starting point. His quantitative modelling spans nearly every category of EA interventions, his models are all methodologically aligned (since it's just him doing them), and they're all transparent too (unlike the DCP estimates).
Thanks for the suggestion, Mo! More transparent methodologically aligned estimates:
Estimates from Rethink Priorities' cross-cause cost-effectiveness model are also methodologically aligned within each area, but they are not transparent. No information at all is provided about the inputs.
AIM's estimates respecting a given stage of a certain research round[3] will be especially comparable, as AIM often uses them in weighted factor models to inform which ones to move to the next stage or recommend. So I think you had better look into such sets of estimates over one covering all my estimates.
Meanwhile, they have published more recommended for the early 2025 incubation program.
Only in-depth reports of recommeded interventions are necessarily published.
There are 3 research rounds per year. 2 on global health and development, and 1 on animal welfare.
Are you talking about this post? Looks like those cost-effectiveness estimates were written by Ambitious Impact so I don't know if there are some other estimates written by Vasco.
I'm thinking of all of his cost-effectiveness writings on this forum.
Thanks for the interest, Michael!
I got the cost-effectiveness estimates I analysed in that post about global health and development directly from Ambitious Impact (AIM), and the ones about animal welfare adjusting their numbers based on Rethink Priorities' median welfare ranges[1].
I do not have my cost-effectiveness estimates collected in one place. I would be happy to put something together for you, such as a sheet with the name of the intervention, area, source, date of publication, and cost-effectiveness in DALYs averted per $. However, I wonder whether it would be better for you to look into sets of AIM's estimates respecting a given stage of a certain research round. AIM often uses them in weighted factor models to inform which ones to move to the next stage or recommend, so they are supposed to be specially comparable. In contrast, mine often concern different assumptions simply because they span a long period of time. For example, I now guess disabling pain is 10 % as intense as I assumed until October.
I could try to quickly adjust all my estimates such that they all reflect my current assumptions, but I suspect it would not be worth it. I believe AIM's estimates by stage of a particular research round would still be more methodologically aligned, and credible to a wider audience. I am also confident that a set with all my estimates, at least if interpreted at face value, much more closely follow a Pareto, lognormal or loguniform distribution than a normal or uniform distribution. I estimate broiler welfare and cage-free campaigns are 168 and 462 times as cost-effective as GiveWell’s top charities, and that the Shrimp Welfare Project (SWP) has been 64.3 k times as cost-effective as such charities.
AIM used to assume welfare ranges conditional on sentience equal to 1 before moving to estimating the benefits of animal welfare interventions in suffering-adjusted days (SADs) in 2024. I believe the new system still dramatically underestimates the intensity of excruciating pain, and therefore the cost-effectiveness of interventions decreasing it. I estimate the past cost-effectiveness of SWP is 639 DALY/$. For AIM’s pain intensities, and my guess that hurtful pain is as intense as fully healthy life, I get 0.484 DALY/$, which is only 0.0757 % (= 0.484/639) of my estimate. Feel free to ask Vicky Cox, senior animal welfare researcher at AIM, for the sheet with their pain intensities, and the doc with my suggestions for improvement.