Comments

The Frontier in 2025 (data), by Gavin Leech, Lauren Gilbert, and Ulkar Aghayeva, rated 202 of the biggest breakthroughs of last year. Some favorites, mainly public health- and society-related:
- Diagnostics on a phone with no doctor needed (source)
- Murder rates worldwide have fallen 25% since 2000 (source) ("On average! Potentially some confounding from improved trauma emergency care converting murders into attempted murders")
- 5 factors explain most of the genetic variance in common mental illnesses (source)
- Large effect for 5-MeO-DMT for treatment-resistant depression (source) ("Recall that major depression is maybe 2% of the total global burden of disease")
- For the first time in recent history, China’s emissions might be falling (source)
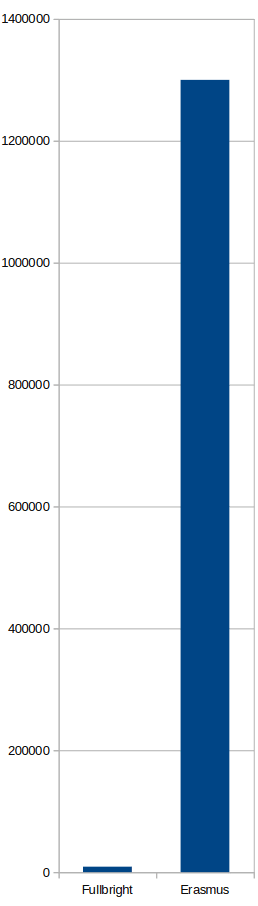
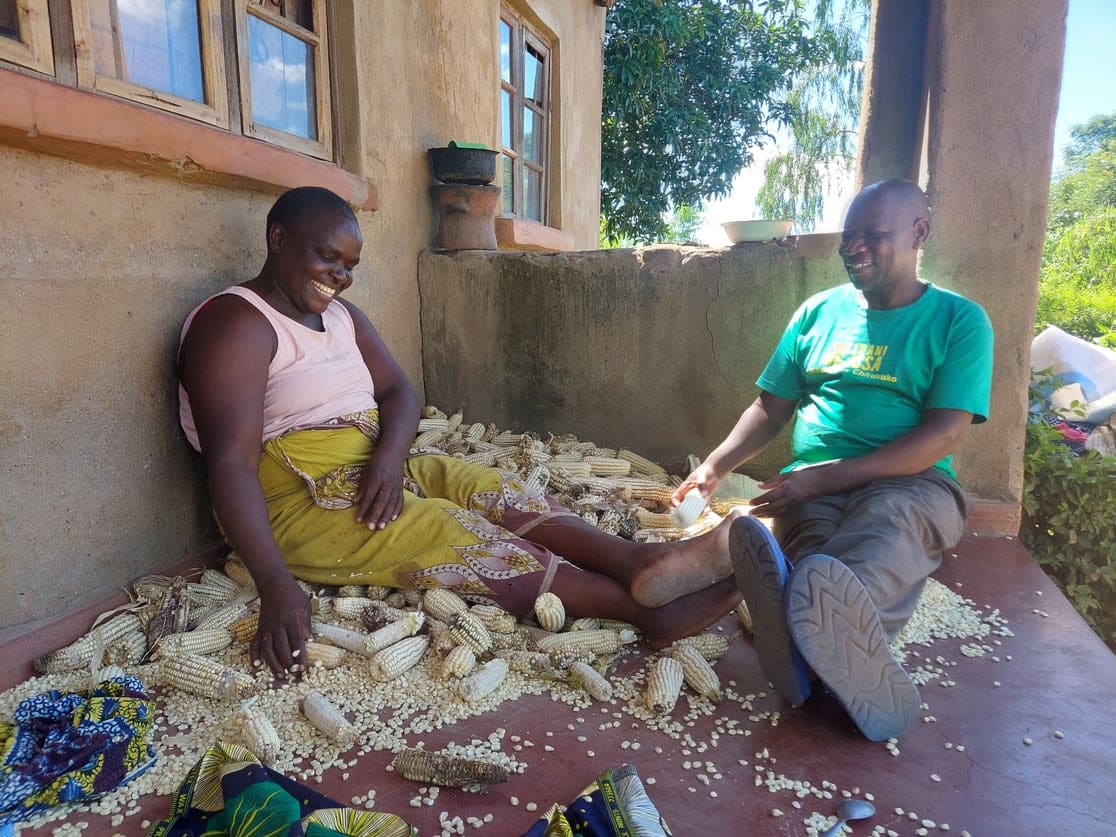
- The first evidence of a solar take-off in Africa (source)
- A tiny number of people are functionally cured of HIV. The antibodies responsible may have been identified (source)
- An E. coli vaccine is currently undergoing Phase III human testing (source): "E. coli is the second-most lethal bacterium in the world, with about a million deaths a year. There are currently no effective vaccines for it"
- Extreme poverty drops from 27% of India to 5% in one decade (source)
- Observational follow-up on the Covid vaccines shows a large decrease in all-cause mortality (source)
- First-in-human 'prime editing' gene therapy. Cured an inherited immune disease (source)
- Last year's biannual HIV shot available in low-income countries, $40/year (source)
- AI designs antibodies that can turn on or off membrane signaling proteins implicated in many diseases (source)
- AI for antibiotic design (source): "7 of 24 AI-designed and custom-synthesized compounds show selective antibacterial activity, including against N. gonorrhoeae and S. aureus"
- AI generator for antibodies against specific protein targets (source)
- Two promising drugs to prevent secondary and post-surgical stroke (source)
- Challenge trial on a salmonella vaccine showed roughly 70% effectiveness (source)
- Tiny demo of a 90% effective malaria vaccine which only takes one dose (source) ("However, the Leiden study was n=15. The followup PfSPZ-LARC2 study won't be finished until 2027 and is also n=22(!). Last year's R21 vaccine was 75% effective but takes 4 doses")
- A candidate "gene drive" for eliminating malaria reduced parasite hosting from 80% to 30% (source)
- A new class of treatment for malaria: 97% cured and it shouldn't suffer existing drug resistances (source): "the first new class of malaria drug approved in more than 25 years"
- Three new countries certified malaria-free (source): Georgia, Suriname, and Timor-Leste
- Four countries eliminated trachoma, a disease that causes blindness (source): Senegal, Egypt, Mauritania and Fiji
- The cost to treat drug-resistant TB drops below $300 (source): "bedaquiline now available at $63 per treatment course, bringing the price of the complete BPaLM treatment to $284"
- First successful transplant of a non-human lung into a human (source)
- The oldest baby in history: an embryo frozen in 1994 was brought to term and resulted in a healthy baby boy (source): "The biological mother of the baby was 62 years old at the time of his birth. While incremental, this points towards eventually allowing for delayed IVF, which would be socially transformative"
- First human infant cured of a lethal genetic disease with a personalized gene therapy (source)
- Trevogrumab could potentially prevent muscle loss in the sedentary (source)
- Approval of a strong non-opioid painkiller targeting a pathway specific to pain neurons (source): "It's strong, as strong as hydrocodone or low-dose morphine. It is claimed to be nonaddictive, which is the somewhat unlikely part. It does hit the brain much less, which might work"
- Tooth regrowing procedure enters human trials (source)
- Rising Internet access reduces prevalence of female genital mutilation (source)
Why they did this:
A couple of years ago, Gavin became frustrated with science journalism. No one was pulling together results across fields; the articles usually didn’t link to the original source; they didn't use probabilities (or even report the sample size); they were usually credulous about preliminary findings (“...which species was it tested on?”); and they essentially never gave any sense of the magnitude or the baselines (“how much better is this treatment than the previous best?”). Speculative results were covered with the same credence as solid proofs. And highly technical fields like mathematics were rarely covered at all, regardless of their practical or intellectual importance. So he had a go at doing it himself.
This year, in partnership with Renaissance Philanthropy, we took a more systematic approach. So, how did the world change this year? What happened in each science? Which results are speculative and which are solid? Which are the biggest, if true?


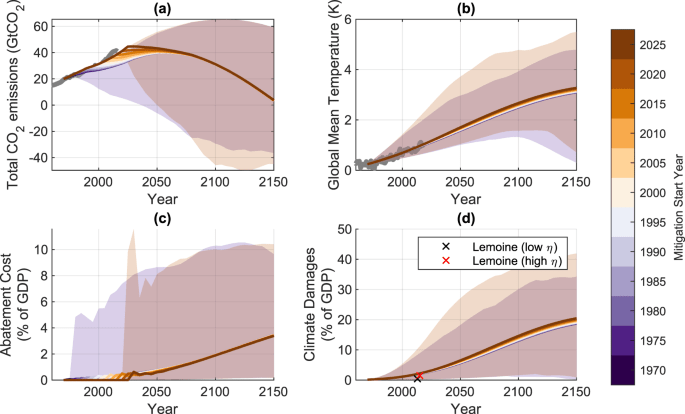

 Modelling the rise in global mean surface temperature (GMST) as a function of carbon burned is already very hard; Parncutt doesn't try to model premature deaths as a function of GMST but just makes a semi-quantitative order-of-magnitude estimation anchored extensively at the lower and upper ends to various catastrophic outcomes discussed in the literature on climate change, and assumes a lognormal distribution around a billion future deaths with a 10x range for worst-vs-best case scenario, which over time looks 'very approximately' like this:
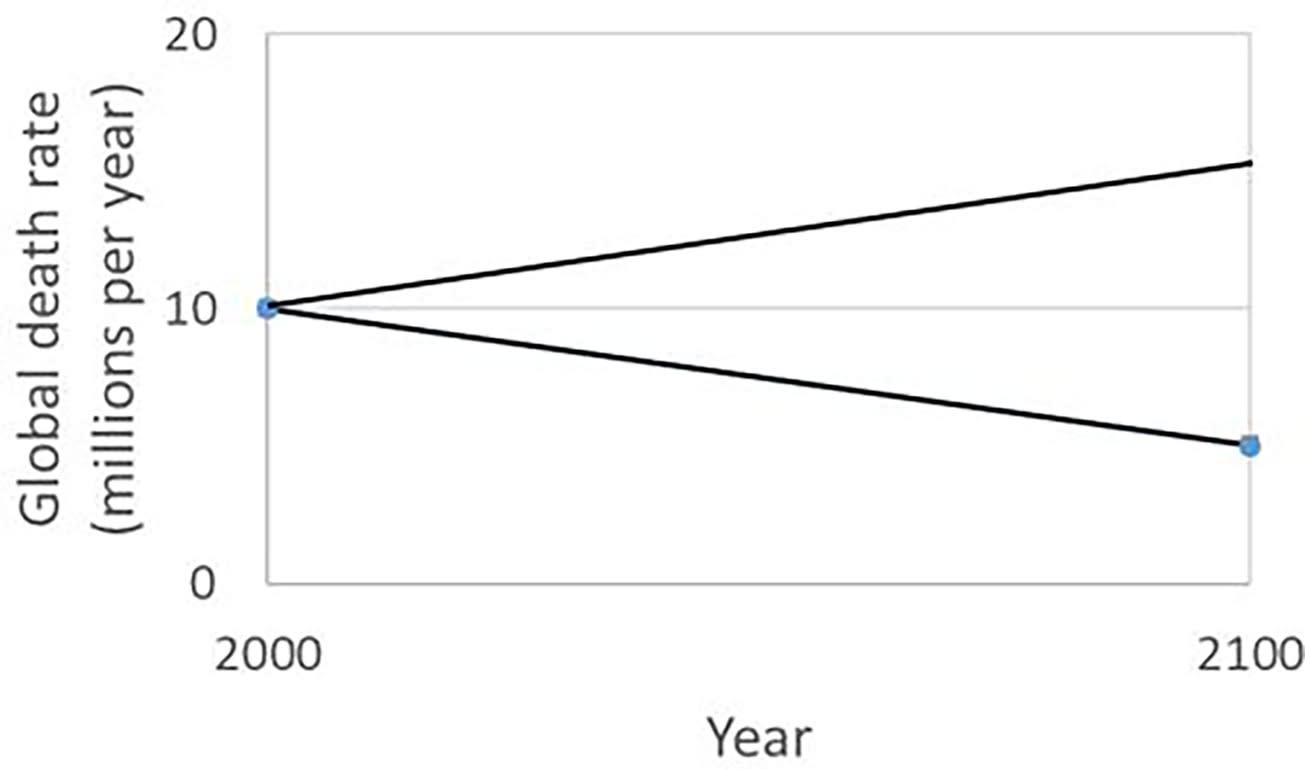


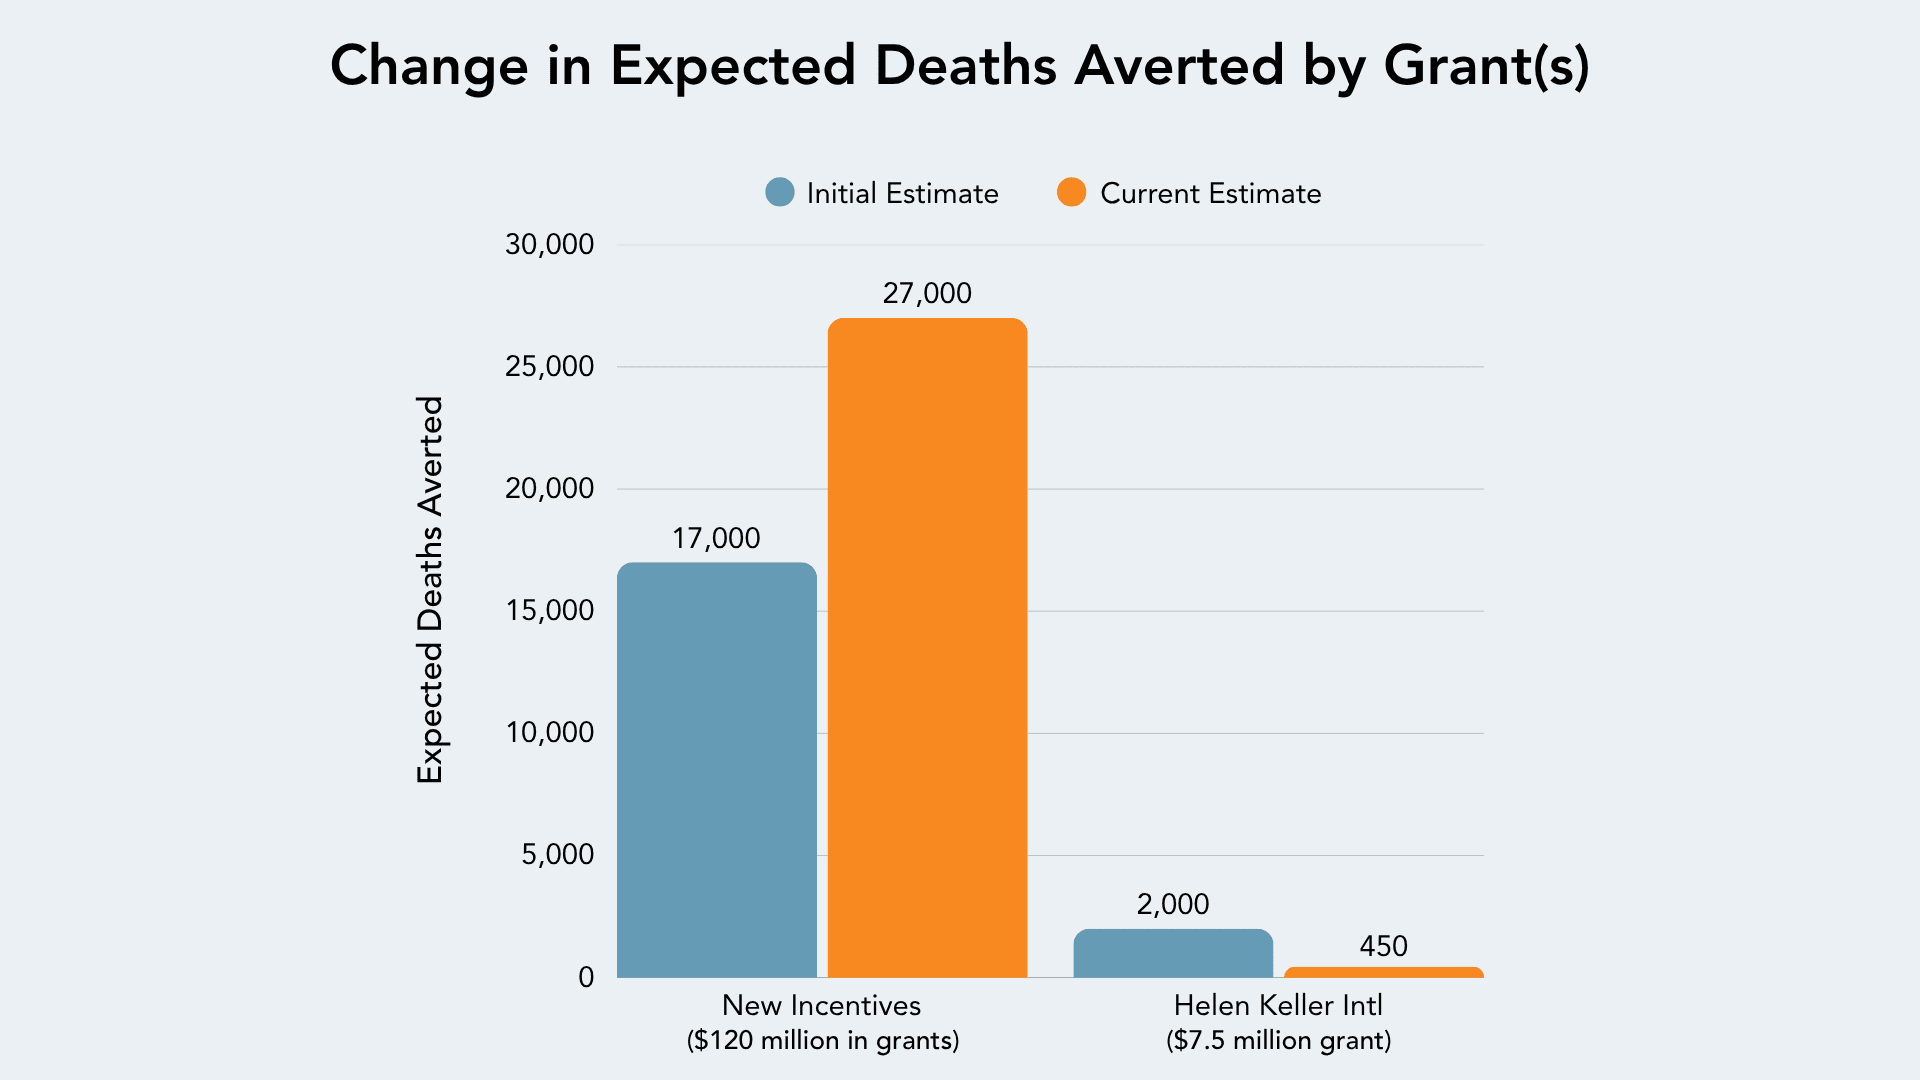
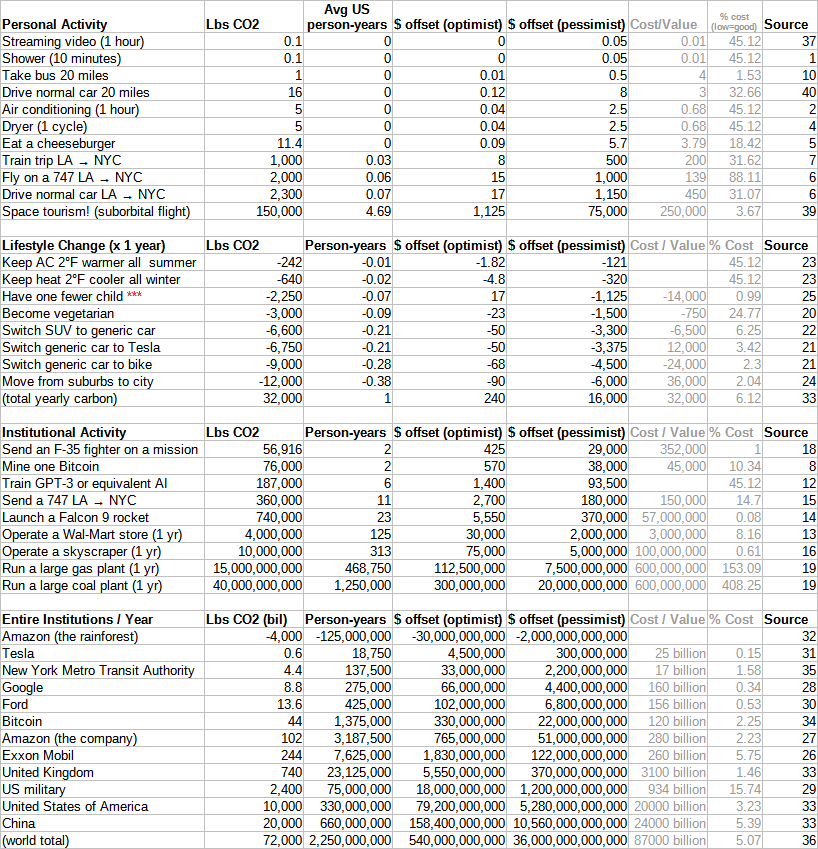
Abi Olvera's Golden rice delay dashboard, includes BOTEC calculations and sources, supplement to her Substack article A blocked GMO rice could have saved 100,000 children. The same tech makes pineapples pink:
This is a super important cause, but I think these numbers are hugely overblown.
That 125,000 to 250,000 deaths following blindness an old figure from the 90s, deaths from vitamin A deficiency have hugely dropped since then.
I think also from 2010 to 2015 golden rice was also a little lower yielding which contributed to the lack of uptake along with the GMO vitriol? So uptake was never going to be overwhelming until well after 2015 I don't think bans nonwithstanding
GBD estimated around 17,000 deaths from VAD in 2021
https://www.frontiersin.org/journals/nutrition/articles/10.3389/fnut.2025.1689903/full
Its a nice idea for a counter, but might be like 3-10x off or something? Have messaged the author directly.
Very much appreciate the spot-check, thanks!
Want to add that the writer Abi has been great and responded really well to feedback.