Comments
Sure seems like animal welfare could use some more spending!
Sure seems like animal welfare could use some more spending!
Worth joining forces with Hamish and effectivealtruismdata.com (see post).
This stuff should be able to be automated, I think/hope.
I also added some tags to this post. with this stuff it’s good to coordinate where we can.
Many of the sources used here can't be automated, but the spreadsheet is simple to update
Fair point but still may be worth joining force or coordinating with Hamish
A data-point on this - today I was looking for and couldn't find this graph. I found effectivealtruismdata.com but sadly it didn't have these graphs on it. So would be cool to have it on there, or at least link to this post from there!
Hamish applied for funding for that website but was rejected. Seems like something we'd pay $100k to exist, right?
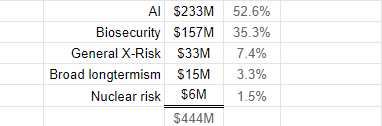
This data is very valuable - thanks! Saves me the time of collecting it (or asking someone else to do so). If possible, I think it would be very helpful to also distinguish between biorisk, nuclear risk, AI, and other -- I'd be really curious how this is distributed.
Also I think it could be useful to add data from Longview and Effective Giving, if they ever make data available.
Me too, same for other areas as well!
Kind of bad we didn't have this overview before. Seems very basic to have! So thanks for doing it
Thanks! This is for 2014-2022? If so, does it include 2022 projection?
2012-Pres. (first longtermist grant was in 2015) no projection
In light of this, it's interesting to look back at the March 2021 post by Applied Divinity Studies "Why Hasn't Effective Altruism Grown Since 2015?" The post (reasonably enough) used money moved as a key metric of EA growth, and argued that EA as a movement had been stagnating. The massive increase in EA-aligned funds in the past couple years would seem to suggest otherwise.
(See also the discussion in GiveWell's 2021 year-end report, which noted: "In 2021, GiveWell continued to enjoy a huge amount of growth in the funds we were able to raise. Overall, our funds raised grew by over 100%, from $293 million in 2020 to $595 million in 2021—the largest absolute increase in funding we've ever experienced.")
Thanks for doing and sharing this, really interesting!
Random curiosity, how did your spreadsheet make it into the time.com article about EA?
Naina (the Time journalist) and I were chatting about the aggregate funding data but couldn’t quickly find a source. I connected Naina and Tyler to work on this together. Tyler pulled together the data in part for the Time article.
Are the grants adjusted for inflation? If not, doing it might be a good idea, such that the values are more comparable across years.
I'm not sure that inflation makes sense—this money isn't being spent on bread :) I think most of these funds would alternatively be invested, and returning above inflation on average.
From Investopedia, "inflation is the rate at which prices for goods and services rise". So my understanding is that it is a broad measure of the purshasing power of money, and matters even if the money is not (directly) going towards buying food.
It seems to me like these amounts would be most useful if they were adjusted for inflation (alternatively, if you want to be fancy possibly even adjusted for an index of the wages of knowledge workers). As it is effective funding dispersed in the early years is being understated.
Yes, sorry, on reflection that seems totally reasonable
Can this spreadsheet be linked on a page on the EA website?
I know I'm late to the party, but thanks for the data!
One question: Why does your number for 2019 so different from 80K's estimates (https://80000hours.org/2021/08/effective-altruism-allocation-resources-cause-areas/)?
Both posts contain a more detailed breakdown of inputs, but in short:
Ooh I <3 data. Late to the party, but I cleaned up the raw data by throwing away a small amount of information and stacking into a few columns (variable names self-explanatory). I also adjusted dollar amounts for inflation using that month's CPI. Don't count on this to be absolutely solid just yet!
I must have messed with some settings bc can't embed links, but:
Neat! Do you want to make a graph using the inflation-adjusted data?
Thank you for putting this together! It's interesting to think about overall trends in volume and direction of giving.
Effective animal charities will likely receive something like 5% of EA funding in 2022, the smallest figure since 2015 by a wide margin.
It would be interesting, though perhaps difficult, to see an analysis like this account for multi-year grants, assuming it isn't already. For instance, part of why animal welfare funding might look so much larger in 2021 compared to 2022 is that Open Phil, the biggest EA funder in the space as far as I know, made multiple large grants in 2021 that pay out over the course of two-three years (e.g., GFI, THL).
So, if I'm interpreting this correctly, lower 2022 numbers for animal welfare might not reflect a deprioritization or funding gap, but just multi-year grants for the largest organizations having been made recently.
I'm a bit surprised that there's ~200M in longtermist grantmaking in the first 8 months of 2022 alone! Where is most of that money going?
(I feel a bit dense in asking this, but where are you getting ~200M in the first 8 months from? In the sheet it's 139.5M; the ~200M is a projected estimate.)
The 139.5M for LTXR splits into
What jumps out to me is (1) FTX's LTXR grants seem broader than OPP's (2) FTX has so far granted 10x more to AI stuff than OPP. Looking into the latter a bit, OPP's 1.8M went to 1 grant (Open Phil AI Fellowship — 2022 Class supporting 11 ML researchers over 5 years) while FTX's 20M went to 76 grants, both big (e.g. 5M to Ought to build a language-model based research assistant) and small (e.g. 50k to one person to support 6 months of AI safety research). My sense is this is driven by some combination of VoI-maxing orientation and fast grant decisions (inspired by Fast Grants -- see this comment for more commentary on this parallel)
(I feel a bit dense in asking this, but where are you getting ~200M in the first 8 months from? In the sheet it's 139.5M; the ~200M is a projected estimate.)
I was just eyeballing the graph! Thanks ,your notes made sense. Cool stuff.
FTX has so far granted 10x more to AI stuff than OPP
This is not true, sorry the Open Phil database labels are a bit misleading.
It appears that there is a nested structure to a couple of the Focus Areas, where e.g. 'Potential Risks from Advanced AI' is a subset of 'Longtermism', and when downloading the database only one tag is included. So for example, this one grant alone from March '22 was over $13M, with both tags applied, and shows up in the .csv as only 'Longtermism'. Edit: this is now flagged more prominently in the spreadsheet.
BTW I'm guessing that you can't "project" OP giving by multiplying grants by 12/8, because OP has a pretty big delay in announcing their grants.
Yeah it looked like grants had been announced roughly through June, so the methodology here was to divide by proportion dated Jan-Jun in prior years (0.49)
Thanks, this is great!
I wonder why Open Philanthropy has not made available a similar analysis.
I may be interested in a more comprehensive analysis on this topic, e.g. using the full budget of every GiveWell-recommended charity.
I don't know about the full budget, but the Grants by funding opportunity tab in GiveWell's sheet on directed grants with impact information seems like a good start, although it only has figures from 2020 onwards. The Lifetime impact tab has figures from 2009, but not at grant-level granularity, just year / charity aggregated figures.
Thanks for putting this data together! Very useful
The growth in EA Infrastructure is huge in 2022. This should translate into an impressive takeover of the EA community and funding very soon. I’m looking forward to seeing the evolution in upcoming years.
Do we have any clue on why the donors started to pay so much attention to EA Infrastructure in 2022 when compared to the previous eight years?
Thanks for your response Tyler!
Shouldn't these FTX donations be included under "Longtermism and Catastrophic Risk Prevention" instead of under "EA infrastructure"? Maybe I'm missinterpreting the Cause Areas.
No he's right. FTX gave 34M in the linked report to "Effective Altruism", while "EA Meta" in 2020 and 2021 was "only" 30.4M
EDIT: Also LOL at Tyler's comment being downvoted before my explanation.
Thanks Linch for guiding me to the exact place where to find the information. Sorry that I didn't realize the information was already there from the start.
I put it together to understand where the additional 65,6 M$ are going to.
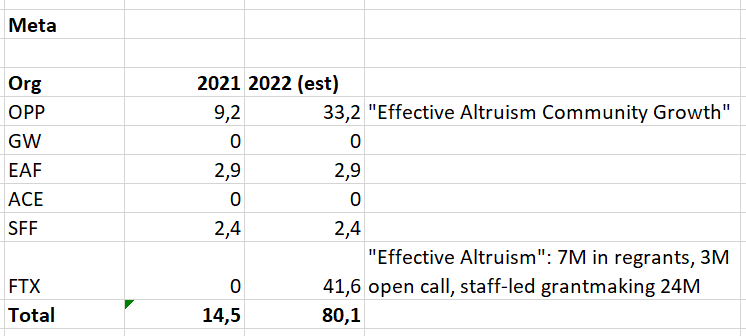
Welcome! I think there's a calculation error. How are you getting 41.6 for FTX? 7M+3M+24M = 34M. :)
In the spreadsheet there are two rows: "2022" and "2022 (est.)". I assume the "2022" is actual year to date and the "2022 (est.)" is the expectation for year end. I guess the detailed explanation is somewhere but I don't have the time now to search for it.
For FTX Meta the value for "2022" is 35, and the value for "2022 (est.)" is 41.6. I see two options here for the mismatch between 34 (7+3+24) in my post and 35 in the spreadsheet:
A) 35 is a typo and the value should be 34. I added a comment in the spreadsheet
B) 35 is the good number and there is other 1M$ FTX chapter that can be considered as Meta. Maybe "Research That Can Help Us Improve"?
In reallity it is not so important 1M$.
I also can't understand why Tyler's comment was downvoted.
This is hugely useful, thanks for putting it together!
Appreciate the effort that has gone into this.
Agree with others that automating this across the relevant organisations would be a good idea and probably very simple to implement.
At some point if you have enough donors, coordination becomes important.
Can someone explain what EA infrastructure covers?


I have consolidated publicly available grants data from EA organizations into a spreadsheet, which I intend to update periodically[1]. Totals pictured below.
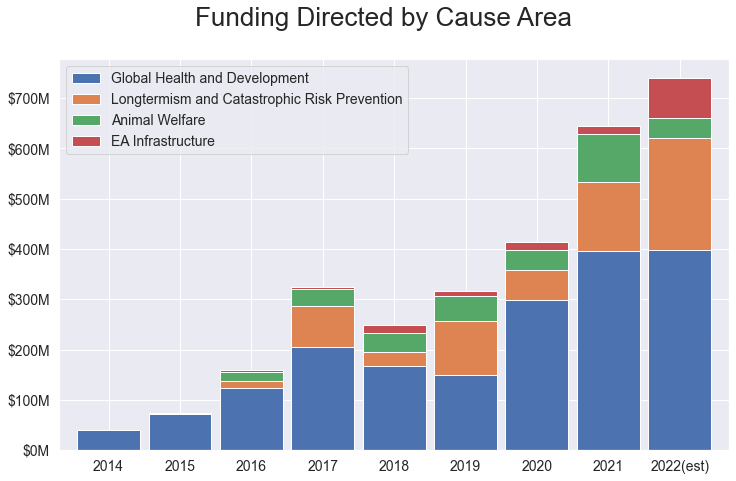
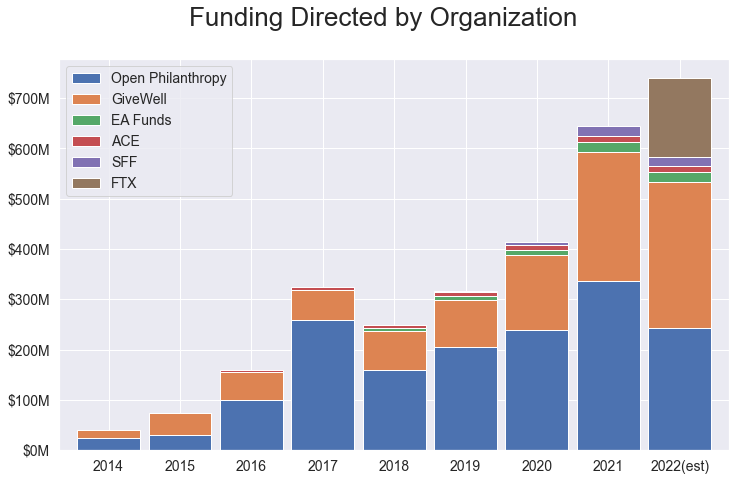
(edit: swapped color palette to make graphs easier to read)
NB: This is just one observer's tally of public data. Sources are cited in the spreadsheet; I am happy to correct any errors as they are pointed out.
If there is any presently available data that seems worth adding, let me know and I may consider it.
I may be interested in a more comprehensive analysis on this topic, e.g. using the full budget of every GiveWell-recommended charity. I'd be interested to hear if anyone has access to this type of data, or if this type of project seems particularly valuable.
Thanks to Niel Bowerman for helpful comments
Currently the bottleneck to synchronizing data is the GiveWell annual metrics report, which is typically published in the second half of the following year. I may update more often if that is useful.
Not sure it's worth the effort, but I'd find the charts easier to read if you used a wider variety of colors.
+1, I'd also recommend using colours that are accessible for people with colour vision deficiency.
The viridis package is good for colourblindness and is also pretty: https://cran.r-project.org/web/packages/viridis/index.html
I find this website helpful for picking colorblind friendly color schemes: https://colorbrewer2.org/
Fixed
Thanks!!