Hide table of contents

You can now integrate Our World in Data charts much more easily into forum posts. These new features work with any of our interactive charts – their URLs look like this:

https://ourworldindata.org/grapher/[name-of-the-chart]

Previews on hover

If you add a link to an OWID chart in your text, a preview window will automatically appear when readers hover over it. For example, here's the yearly number of deaths from malaria by age since 1990.

Embedded charts

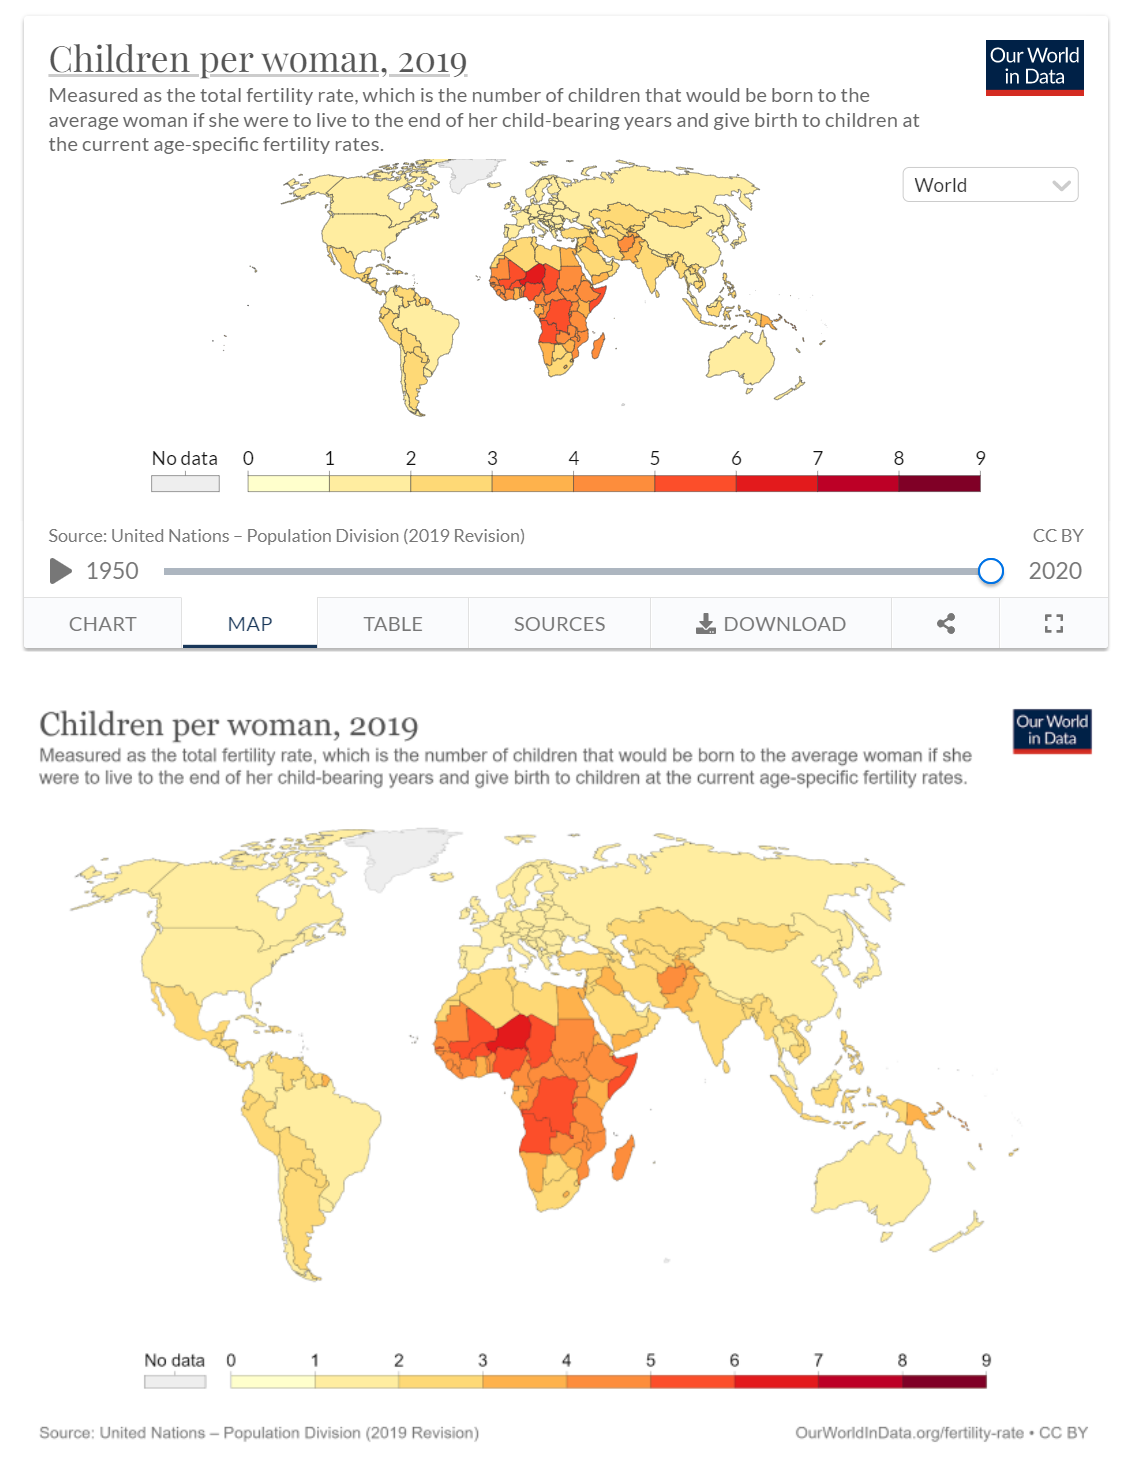
If you want to make a chart visible directly in your post, you can simply paste the URL and an embedded version of the chart should automatically appear. Here, for example, I'm pasting this:

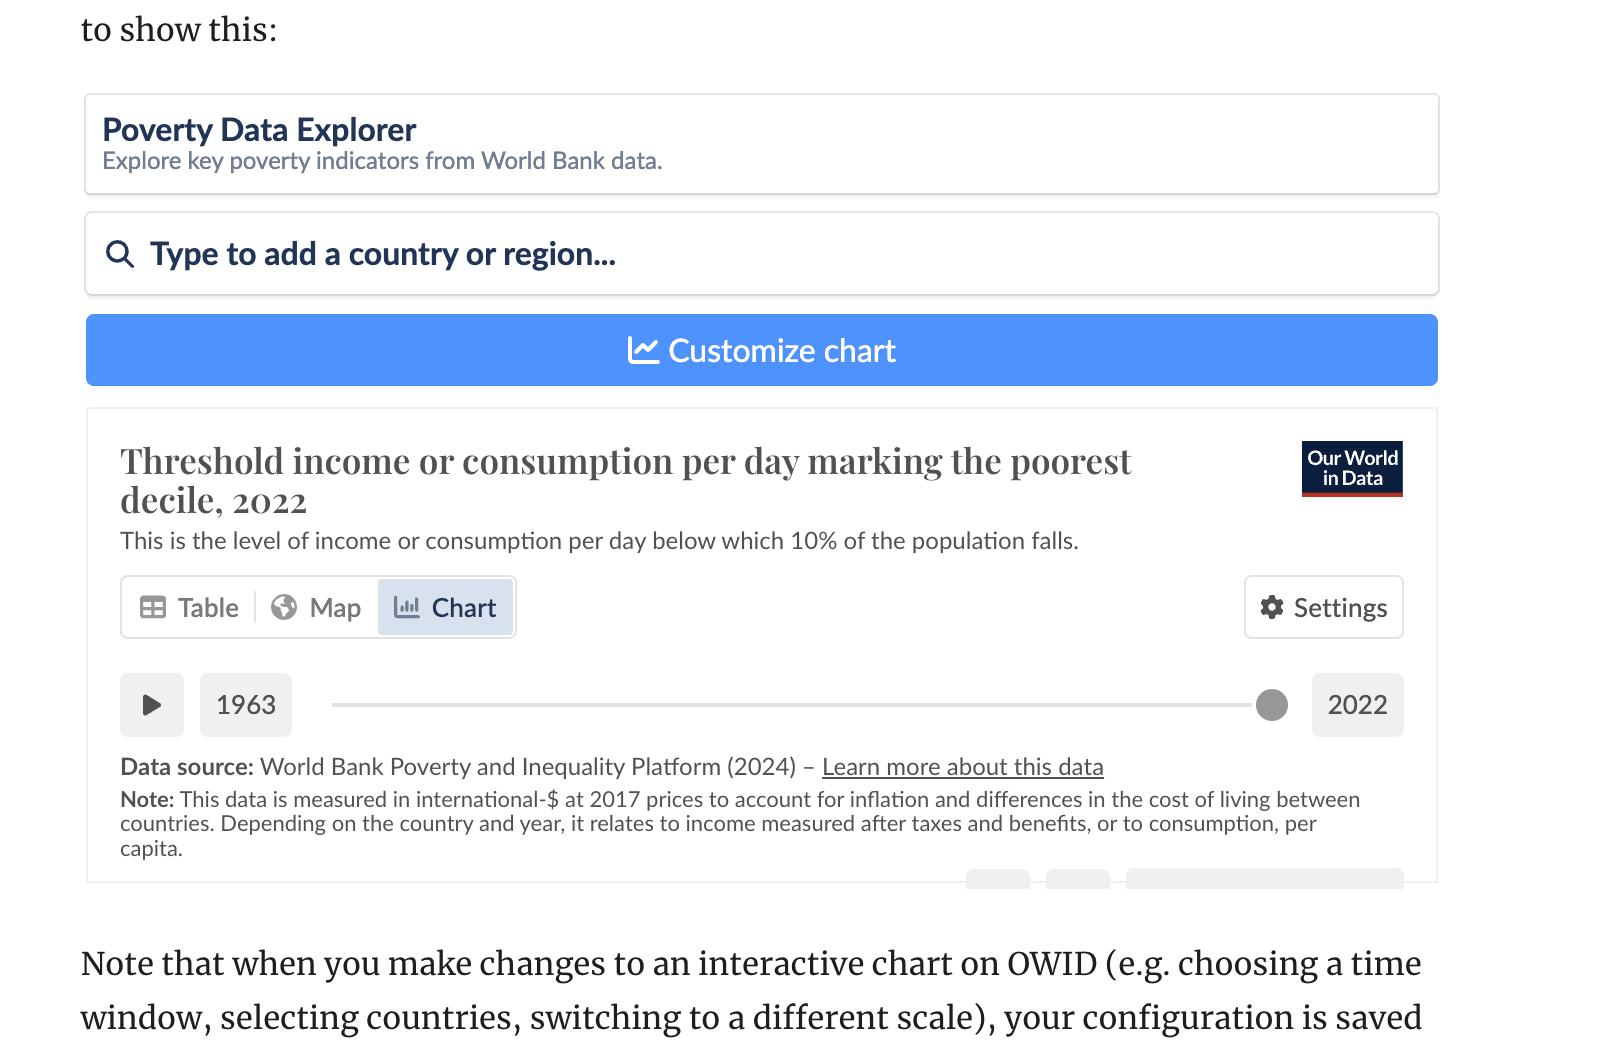
https://ourworldindata.org/grapher/cost-of-sequencing-a-full-human-genome

to show this:

Note that when you make changes to an interactive chart on OWID (e.g. choosing a time window, selecting countries, switching to a different scale), your configuration is saved in the URL. Starting from this chart of primary energy from nuclear, I can make a line chart for G7 countries, and copy the resulting URL from my browser:

https://ourworldindata.org/grapher/nuclear-primary-energy?tab=chart&country=FRA~DEU~USA~GBR~ITA~JPN~CAN

which I can paste here to embed this:


Many thanks to Adam Binks for coming up with this idea at EAGx Oxford!

Comments10


Sorted by Click to highlight new comments since:

This is slick, thank you! I don't use OWiD charts in my posts, but I might now that there's this feature.

drafting a post which uses this feature, and I'm a bit disappointed in terms of how much smaller the map is compared to using the downloaded figure from the OWiD. I think it would be better if the map were took up more of the available width. 

Are there plans to support OWID's explorer charts? For example this one doesn't render:

https://ourworldindata.org/explorers/poverty-explorer?tab=chart&time=latest&facet=none&country=USA~AUS~AUT~BEL~CAN~CHL~COL~CRI~CZE~DNK~EST~FIN~FRA~DEU~GRC~HUN~ISL~IRL~ISR~ITA~JPN~LVA~LTU~LUX~MEX~NLD~NOR~POL~PRT~SVK~KOR~SVN~SWE~CHE~ESP~TUR~GBR~OWID_WRL&Indicator=Income+or+consumption+of+the+poorest+10%25&Poverty+line=%242.15+per+day%3A+International+Poverty+Line&Household+survey+data+type=Show+data+from+both+income+and+consumption+surveys&Show+breaks+between+less+comparable+surveys=false

Screenshot:

I'll write down the request. I tried previewing what it would look like and it's not perfect

so we'd probably need OWID to make a dedicated preview page.

Great feature! Just wondering whether Our World in Data charts can be embedded into Substack and Ghost in a similar way.

You can implement them easily in Ghost by using the HTML embed. You find this when you click on the bottom right corner the share button and click "embed".

Thanks very much!

The current implementation doesn't include them. I guess it would be possible to do it, but they're quite larger than Grapher charts in terms of interface, so I'm not sure we would manage to find a user-friendly way to make them fit within the width of a forum post.

Love this feature! Very excited to use this in my next post.

Curated and popular this week
Ben_West🔸
 ·  · 1m read
 · 
> Summary: We propose measuring AI performance in terms of the length of tasks AI agents can complete. We show that this metric has been consistently exponentially increasing over the past 6 years, with a doubling time of around 7 months. Extrapolating this trend predicts that, in under a decade, we will see AI agents that can independently complete a large fraction of software tasks that currently take humans days or weeks. > > The length of tasks (measured by how long they take human professionals) that generalist frontier model agents can complete autonomously with 50% reliability has been doubling approximately every 7 months for the last 6 years. The shaded region represents 95% CI calculated by hierarchical bootstrap over task families, tasks, and task attempts. > > Full paper | Github repo Blogpost; tweet thread. 
 ·  · 2m read
 · 
Hi everybody! I'm Conor. I run the 80,000 Hours Job Board. Or I used to. As of today — April 1 — we are becoming Job Birds! We've been talking to users for the last few years about making this change, and people have overwhelmingly been in favour (remember, there are six or more birds for every human on Earth). Whether it's the daily emails asking me to finally switch, or the flocks of people accosting me at conferences to urge a migration to Job Birds, the demand is overwhelming! Luckily, the wait is over! I've included an FAQ below of the most common questions we receive. FAQ * Do these birds have jobs? * In a sense, no. In another, preferred sense, definitely! They have roles in ecological niches. * What's a good bird to get started with? * The peregrine falcon. * What's the theory of change? * Birds are fascinating creatures. * Birds are the only living animals with feathers. * Birds have hollow bones, which help facilitate flight. * Some bird species, such as parrots and corvids, display remarkable intelligence. * What was the question again? * Caw! Caw! * I have concerns about wild animal suffering. How does Job Birds intend to navigate promoting birds of prey? * The humans behind Job Birds share these concerns. Unfortunately, birds of prey we've spoken to overwhelmingly ascribe to an incompatible, sort of Avi-Nietzschean value system. Owl contractors are in the process of building a moral parliament tool in order to manage these conflicting normative claims. * I worry that sharing birds with people isn't as impactful as sharing jobs. * Okay, but consider this: you can click the media buttons to even hear the sounds of the bird! * I would like to do good with my career. Can Job Birds help me with that? * Users report that job hunting can be stressful and time-intensive. In light of this, we at Job Birds recommend breaking up your job hunts with some time learning about the wonders of over 1,000 bird species at 80,000
Joris 🔸
 ·  · 5m read
 · 
Last week, I participated in Animal Advocacy Careers’ Impactful Policy Careers programme. Below I’m sharing some reflections on what was a really interesting week in Brussels! Please note I spent just one week there, so take it all with a grain of (CAP-subsidized) salt. Posts like this and this one are probably much more informative (and assume less context). I mainly wrote this to reflect on my time in Brussels (and I capped it at 2 hours, so it’s not a super polished draft). I’ll focus mostly on EU careers generally, less on (EU) animal welfare-related careers. Before I jump in, just a quick note about how I think AAC did something really cool here: they identified a relatively underexplored area where it’s relatively easy for animal advocates to find impactful roles, and then designed a programme to help these people better understand that area, meet stakeholders, and learn how to find roles. I also think the participants developed meaningful bonds, which could prove valuable over time. Thank you to the AAC team for hosting this! On EU careers generally * The EU has a surprisingly big influence over its citizens and the wider world for how neglected it came across to me. There’s many areas where countries have basically given a bunch (if not all) of their decision making power to the EU. And despite that, the EU policy making / politics bubble comes across as relatively neglected, with relatively little media coverage and a relatively small bureaucracy. * There’s quite a lot of pathways into the Brussels bubble, but all have different ToCs, demand different skill sets, and prefer different backgrounds. Dissecting these is hard, and time-intensive * For context, I have always been interested in “a career in policy/politics” – I now realize that’s kind of ridiculously broad. I’m happy to have gained some clarity on the differences between roles in Parliament, work at the Commission, the Council, lobbying, consultancy work, and think tanks. * The absorbe
Recent opportunities in Building effective altruism
46
Ivan Burduk
· · 2m read