Comments
Good example of red teaming a paper!
Good example of red teaming a paper!
I agree! I added the Red teaming wiki tag but since that tag is a mix of meta-discussion and examples, it might also be nice to have a separate tag for red teaming examples.
Thanks for doing this! I liked the original paper but never did a deep dive on the robustness.
Take that, people who say "muzak and potatoes" as if it was a bad thing.
Hm, is it just through calories or maybe through micronutrients as well: potatoes are high in potassium, vitamin C, B6, and K1 compared to other staple foods? Footnote 6 tends to suggest that it's mostly about calories.
Great question. The paper does mention micronutrients but does not try to evaluate which of these advantages had a greater influence. I used the back-of-the-envelope calculation in footnote 6 as a sanity check that the effect size is plausible but I don't know enough about nutrition to have any intuition on this.
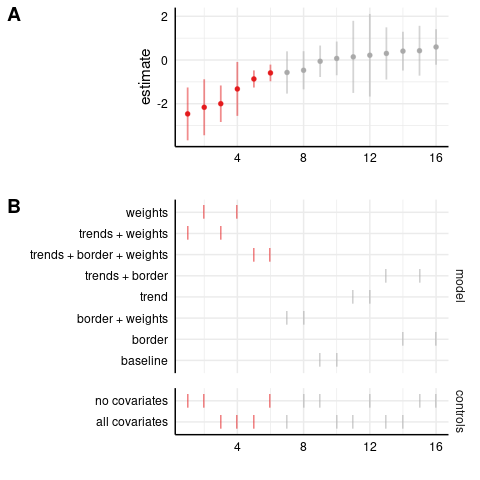
Did you run additional robustness checks? I like to see a multiverse analysis, aka specification curve, (see here). This involves running all combinations of control variables, since the order in which the controls are added matters, and the authors could have selected only the significant ones. (See also.)
(epistemic status: possibly dumb question by someone learning causal inference)
shouldn't you test only combinations of controls which are good conditioning strategies for a plausible causal DAG?
Showing these various specifications, with, as you point out, wonky or strange non-final specifications is sort of a "sanity check".
(Or alternatively, the authors are "selling" their work by trying to show a consistent story by incremental showing increasingly complex specifications, carefully embedded in a performative narrative).
So say, if you're measuring the effect of "education on wages", you might start with your raw, nearly simple regression of wage on years of schooling. Then, as the beginning step of many, you might proceed by showing a specification that includes controls for gender or parental SES (even though this isn't the actual favored specification).
This gives a sanity check.
For example, you expect that the effect of education to go down once you add parental social economic status. So if it goes up, something is probably very wrong. At the same time, the parameter values for controls have content in themselves which is useful.
In the end, most empirical economists are skeptical of any single specification, or entire paper really (in some cases, comically, ruthlessly skeptical, exceeding the most negative comment made by this account), so showing these specifications are good in this culture.
I like to see a multiverse analysis, aka specification curve, (see here). This involves running all combinations of control variables, since the order in which the controls are added matters, and the authors could have selected only the significant ones.
The parent comment here is recommending all "combinations of control variables". That's different than the normal aesthetic in most empirical econ papers. That might not be ideal in some situations. I haven't heard of this before[1]. Also, no one I know has ever used the term "multiverse analysis", that really gives the data, specification and model too much credit.
Also, in OLS and most variants, order doesn't matter. I think maybe he's talking about something else, but it's not clear from the paper. I find this confusing and not useful to most readers.
However, my PhD is from Nipissing Technical College of Agriculture, so if some Harvard dude comes in, they are probably right.
Also, in OLS and most variants, order doesn't matter
See the Gelbach paper linked above.
Yes, but there are often many plausible sets of control variables that (hopefully) get you conditional independence. I find it easier to plot everything, with the understanding that some specifications are better than others.
Fwiw, I have a set of slides by a very high profile growth economist (top 10 in the world in terms of citations in growth) on why this paper may be incorrect. They have a theoretical model with testable empirical implications.
If anyone is interested in collaborating on this, I'd be potentially interested in having early chats.
Searching the paper, I don't see any mention of common/parallel trends, even though they're using a difference-in-differences strategy. How should we think about that here?
How does their approach (interact cross-sectional potato suitability with time series variation) compare with the recent shift-share literature? It looks like they're not explicitly using instrumental variables.
Actually, it seems more related to the recent diff-in-diff literature, in particular, with a continuous treatment.
Also note that the Nunn & Qian food aid paper used a similar identification strategy ; critique here.
I don't think the recent diff-in-diff literature is a huge issue here -- you're computing a linear approximation, which might be bad if the actual effect size isn't linear, but this is just the usual issue with linear regression. The main problem the recent diff-in-diff literature addresses is that terrible things can happen if a) effects are heterogenous (probable here!) and b) treatment timing is staggered (I'm not super concerned here since the analysis is so course and assumes roughly similar timing for all units getting potatos.)
They try to establish something like a pretrends analysis in table II, but I agree that it would be helpful to have a lot more -- like an event-study type plot would be nice. In general diff-in-diff is a nice way to get information about really hard to answer questions, but I wouldn't take the effect size estimates too literally.
I don't think the recent diff-in-diff literature is a huge issue here -- you're computing a linear approximation, which might be bad if the actual effect size isn't linear, but this is just the usual issue with linear regression.
What is this referring to?
honestly re-reading my comment, that is a very fair question. That part was very poorly phrased.
I think what I had in mind is that the issue with continuous DID goes away if you assume constant effect sizes that are linear in treatment effect. When this doesn't hold, you start to estimate some weird parameter, which Goodman-Bacon, Sant'Anna, and Callaway describe in detail in the link you provided.
I like this paper because it tells us what happens under misspecification, which is exciting because in practice everything is misspecified all the time! But a concern I have with interpreting it is that I think the problem is inherent to linear regression, not the DID case specifically, which means we should really have this kind of problem in mind any time anybody linearly controls for anything.
(So maybe a better way of phrasing this would have been "we should be this nervous all the time, except in cases where misspecification doesn't matter" rather than "it isn't a huge issue here.")
This paper makes that point about linear regressions in general.
There is also this theory that wheat is the driver of the agricultural revolution which ostensibly was the start of human civillization, that I think I read in Sapiens. I also know that golden rice, which was genetically engineered to contain vitamin A, was predicted to improve the vision of hundreds of millions of children, though the intervention failed because of negative campaigns. Based on that, maybe an impactful intervention would be to find and engineer an even more effective crop to grow?


During the 18th and 19th centuries we saw rapid urbanisation and a drastic increase of population throughout the world. Some attribute this to industrialization; Nunn and Qian argue that we owe that to potatoes.
They are not coy about it either. “According to our most conservative estimates, the introduction of the potato accounts for approximately one-quarter of the growth in Old World population and urbanisation between 1700 and 1900”.
They back their hypothesis with data from several natural experiments, studying variability of city populations and adult heights between and within countries, and relate it to the timing when potatoes were introduced in different places.
In this article we will summarise, replicate and critically review Nunn and Qian’s paper. We follow the methods established in (Sevilla, 2021) to study whether their findings are robust and whether they successfully establish a causal relation.
Paper | Theory of causation (Historical exposure ⇒ mediator ⇒ long term outcome) | Correlation analysis Is there a non-spurious long term correlation? | Causality determination Is the correlation causal? |
The Potato's Contribution to Population and Urbanization: Evidence from a Historical Experiment (Nunn & Qian, 2011) | Countries suitability for cultivating potatoes => higher yields from potatoes => increased growth in population and urbanisation | DiD Main issue: correlation of Europe with both growth and potato cultivation | Controls, within-country and within-continent comparisons, multiple independent datasets. The finding is robust to all of these. |
The study purports to evaluate the causal impact of the introduction of potatoes in the Old World in population growth and urbanisation rates.
The theory is that potatoes are more nutritious and provide 3x more calories per acre, so when they started being cultivated in the Old World they produced a positive shock in agricultural productivity, enabling higher populations and wealth per capita.
A previous study by (Mokyr, 1981) estimated the causal effect of potatoes on population growth in Irish counties in 1845[1], finding an effect size of 0.7. This implies counties with high potato cultivation grew an extra 0.15% that year, compared to counties with low cultivation[2]. In comparison, Nunn and Qian’s study uses data of the whole Old World, from 1300 to 1900, instead of just Ireland in a single time slice, and looks at urbanisation rates in addition to population.
To estimate the causal impact of potatoes, the authors exploit two sources of variation[3] on each country’s ability to grow potatoes: the time of introduction and the suitability of the land for potato cultivation. In their baseline analysis they find that around a quarter of the growth in population and urbanisation rates in that time period can be attributed to potatoes.
The main pitfall of this strategy is that it relies on there being no other shocks during that time which are correlated with suitability for cultivation. Unfortunately, Europe is much more suitable for potato cultivation than other Old World regions, and the potato was introduced at the same time when Europe was diverging from other countries due to several unrelated factors.
To check that the effect is indeed causal, the authors use several strategies:
In all of those cases, they find a significant effect of potatoes on the outcome. For the within-continent and within-country analysis, the effect size is in the same order of magnitude as in the baseline regression.[4]
They also perform some analyses to determine which cutoff date to use for the introduction of potatoes:
I think the authors convincingly show that potatoes had a robust positive effect[5]. Moreover, the effect size is within what would be expected from theory and consistent with previous findings[6].
We tentatively conclude the main claim in the paper is broadly correct. That is, around a quarter of Old World population growth from 1700 to 1900 was caused by the introduction of potatoes.
While the significance and effect size is diminished when taking into account multiple hypotheses and within-continent variation only, this is not enough to make the effect non-significant or much smaller. Spatial autocorrelation does not seem to be an issue due to the characteristics of the analysis, as found by (Kelly, 2020)[7].
This analysis could be improved by a) finding other sources to estimate expected effect size, and b) verifying the correlated standard errors computed in (Kelly, 2020)[8].
This review has been commissioned by the Forethought Foundation.
Gelman, A. (2014). Beyond Power Calculations: Assessing Type S (Sign) and Type M (Magnitude) Errors. https://journals.sagepub.com/doi/10.1177/1745691614551642
Kelly, M. (2020). Understanding Persistence. https://economics.yale.edu/sites/default/files/understanding_persistence_ada-ns.pdf
Mokyr, J. (1981). Irish History with the Potato https://journals.sagepub.com/doi/abs/10.1177/033248938100800102
Nunn, N., Qian, N. (2011). The Potato's Contribution to Population and Urbanization: Evidence from a Historical Experiment https://scholar.harvard.edu/nunn/publications/potatos-contribution-population-and-urbanization-evidence-historical-experiment
Sevilla, J. (2021). Persistence: A Critical Review https://docs.google.com/document/d/14ULAaTofWiQbTCP1ekuaenQJ6saXEzjgiKMznIBrXvQ
| Result of replication | Significant effect of potato introduction on population growth. Between ⅙ and ¼ of world population growth from 1700 to 1900 seems to be attributable to potatoes. | ||
| Statistical method of replication | Differences in differences regression | ||
Standardised β ≈ 0.051 (0.018) [0.024] * | Adjusted p-value ≈ 1.1% | n=1552 | |
Expected β ≈ 0.047[6] | # hypothesis = 2[9] | Critical number of hypothesis = 10 | |
Power ≈ 57%[10] | Type S error rate ≈ 5e-9 | Exaggeration ratio ≈ 1.2 | |
Moran’s Z ≈ 4.04[11] | Moran’s p ≈ 2e-5 | Persistence span = 1700 to 1900 | |
| Short commentary | Based on the expected effect size, we find the study is adequately powered to detect an effect, and even estimate the effect size with some accuracy.
While the degree of spatial autocorrelation is very high, (Kelly, 2020) finds the nature of the regression (panel data, fixed effects) prevents this correlation from exaggerating the results.
The main regression likely overestimates the effect due to Europe having both high growth and high potato suitability. Adding continental controls reduces the effect size by ⅓, still enough to explain ⅙ of the total growth in that period. | ||
| Reproduction details | We replicate the regression in column (3) of table IV, as well as those in the first 3 columns of table VIII. | ||
Our procedure is similar to the one in (Sevilla, 2021): In addition to reproducing the main results, we test for spatial autocorrelation[12], multiple hypotheses testing[13], and the possibility that the analysis is underpowered[14].
We reproduce the regressions on the first three columns of tables IV and VII. In the summary table we report the result of column (3) of table IV. The estimate of the effect size is 0.032, which when standardised is 0.051.
To give an intuitive understanding, this means that increasing the amount of suitable land for potato cultivation by 1 percent increases the population by 0.032 percent. To estimate the total impact of population in the whole 1700-1900 period, we compute the total population growth and the growth under the counterfactual where potatoes are not present (the potato variable is 0).
Total population growth in that period was 247%, which in log form is 0.9. The counterfactual growth is 195%, which in log form is 0.67. So the difference in logs is 0.23, or approximately 0.9/4, which is the total impact of potatoes.
The estimate of the effect size on column (3) of table VII, which takes into account only within-continent effects, is 0.020. This similarly translates to a total impact of 1/6 of the total growth.
We compute Moran’s statistic following the procedure in (Kelly, 2020): taking the average of its value for each time period, calculated with a spatial kernel of 1 for the 5 closest points, and 0 otherwise[15]. We did not compute the correlated standard errors from (Kelly, 2020), instead we take his word that they are smaller than the clustered errors[16].
We use design analysis as in Gelman (2014) to compute the power of the study and its type S and M error rates. To find an estimate of the true effect size, we look at the effect found by (Mokyr, 1981). He found an increase of 0.15% in the annual population growth rate, which over 200 years constitutes a total growth of 36%, for a logarithmic change of about 0.3. We also use a simple theoretical model which predicts a similar effect[6].
To account for multiple hypotheses, we make the same corrections as Sevilla (2021)[17]. First we compute the critical number of hypotheses for the given significance threshold, which in this case is 10, and then we compare it with the actual number of hypotheses tested. In this case the authors test 2 hypotheses (effect of potatoes on population and urbanisation rate), which results in a small increase in the p-value of the study. Note that in this case the result of the analysis was positive for both hypotheses, which gives us further confidence that there are no statistical artefacts
All the code used for the replication can be found here.
Using a 2SLS analysis.
The regression coefficient is 0.7, dependent variable is yearly pop. growth rate and independent variable is percentage of total land devoted to potato cultivation. The counties with highest potato cultivation had 29% of the land devoted to potatoes, whereas for the lowest ones it was 7%. 0.007 * (0.29 - 0.07) = 0.00154 ≈ 0.15%. Over 200 years, this corresponds to an extra growth of 36%, 0.3 in log scale.
They use a variant of the differences-in-differences (DD) method, where the difference in population growth between countries with varying potato suitability is compared before and after the introduction of potatoes. What makes this analysis slightly different from standard DD is that instead of collapsing all data into ‘pre’ and ‘post’ adoption periods, the study keeps the temporal structure of the data.
The effect size is 0.02 for within-continent comparisons and between 0.029 and 0.05 for within country comparisons.
Note: the empirical effects found in this study could be due to the introduction of the potato having a permanent effect on the growth rates of the countries, but it could also be due to it having a one-time effect on the long term population level. In this last case, since potato adoption was gradual, the level change would be spread over centuries. This means we can’t distinguish these two hypotheses with the existing data.
Based on the ~0.3 effect over 200 years obtained by (Mokyr, 1981) and on theoretical calculations: if ⅕ of the land is suitable for potatoes, their caloric yield is 3x that of Old World crops, and all the extra yield is absorbed by population growth, then we should expect a log increase of log(⅘ + 3*⅕) ≈ 0.3, broadly consistent with the effect found by the paper.
See the appendix for the details on analysing multiple hypothesis testing, spatial autocorrelation, and the power of the analysis.
Note: Kelly expressed in correspondence that he no longer trusts the approach in his paper. For now we stand by our conclusion, and await his forthcoming publication with improved methodology.
They test for population growth and urbanisation rate.
Even if the expected effect size was 10x lower, the type S error rate would still be ~13%, and the effect would still explain around 3% of the total growth over that period.
Kelly (2020) finds a Z value of 6.44 for the regression in column (1) of table IV, which we were able to replicate. The same methodology yields this value for the baseline regression.
The phenomenon where spatially close places tend to be more similar to each other than would be expected if they were truly independent. The presence of spatial autocorrelation distorts estimates of standard errors and inflates t-statistics.
If the authors test the effect of potatoes on several different outcomes (multiple hypotheses), this increases the probability of spurious results.
The power is the probability of correctly rejecting the null hypotheses. If the true effect size is real but too small compared to the standard error, then the analysis will be underpowered and won’t be able to detect an effect. This is mitigated by reducing the standard error, which usually means increasing the sample size.
Other kernels, like inverse distance and inverse exponential distance, found lower levels of spatial autocorrelation.
Kelly finds an effect size of 4.11 with a clustered standard error of 1.05, which is reduced to 0.44 after taking spatial correlation into account. These numbers are very different from the ones in the original paper and we are not sure how they are being computed. This is why we chose not to use them. In any case if Kelly is right, using his correction would only strengthen the conclusion.
That is, we adjust the p-value of the main regression using the Šidák correction padj = 1-(1-p)n, where n is the number of hypotheses tested. In addition, we have to adjust the standard error σ so that it still represents a confidence interval of confidence level ɑ ≃ erf(1/√2). To do this, we set σadj = σ√2erf-1(ɑ1/n).


I'll use this post to add some other potato related thoughts I had some time ago, as this chance might never come up again in the EA Forum:
Are the potato famine and the revolutions of 1848 an example for the fragility of the modern world?
Recently I came across the potato famine and how it contributed or even caused the revolutions of 1848. I wondered if this is an good example to show how cascading failures lead from an natural event to an agricultural crisis, to an economic crisis, to an financial crisis and finally resulting in a political crisis.
So what happened?
In the 19th century potatoes became a staple crop in Europe, because they were easy to plant and harvest, cheap and filled you up quite nicely. However, there were very few varieties at that time and this made them vulnerable to disease. In 1845 a new potato disease spread all over Europe and destroyed much of the yearly harvest. This was especially a problem in Ireland (because they almost exclusively used potatoes), but most parts of Central Europe were at least a bit affected. This basically left Europe without potatoes until new varieties could be developed.
In 1846 bad weather also affected the wheat and rye harvest. This lead to rising prices all over Central Europe, as now all major food crops had considerably lower yields. These food shortages forced people to kill most of their livestock, as they did not have any feed for it. But as many people slaughtered their animals at the same time, prices for meat plummeted (though they were still way to high for poor people).
This agricultural crisis lead to an economic crisis, as everybody had to use most of their money for food. Therefore, there wasn't anything left to buy other consumer goods. This in turn increased unemployment considerably, as many people in the consumer goods industry lost their jobs. Especially in cities this was a problem, as many people had moved their in the last decades and could not find any jobs to sustain themselves.
So, after the agricultural crisis in 1845 and 1846 were followed with an economic crisis in 1846 and 1847, next came an financial crisis in 1847. The financial crisis was mainly driven by the bursting of a bubble around building railroads. In the 1830s and 1840s many railroad projects were started, but most were crap. The bubble burst in 1847 after states started to rise interest rates to consolidate their finances in the economic crisis. In addition, the food crisis diverted funds away from the railroads and this showed that most of the projects could only continue if they got more money continuously. When this did not happen they crashed and with them everyone who had invested their money. This again led to more unemployment as all the railroad companies closed and due to a lack of available loans many smaller businesses went bankrupt, making even more people lose their job.
So in 1848 you had a crashed economy, a debt crisis, still some famine and massive unemployment. Many people all over Europe faces several years of fear, hardship and poverty. They looked for someone to blame. This brought many people to politics. And finally in 1848 we can see revolutions in most states of Central Europe. Some being successful (France), while others failed (Germany). Still, it seems like an new potato disease basically started a chain of events that led to a drastic change of the political landscape in Central Europe.
This is wonderful the way it is, but perhaps it could be developed into an amazing top post. Allfed would like it.
Suggestion of a catchy title: "Blame the Springtime of Nations on the Incas"
Thank you. I'll probably won't have the time to make a full post out of this, but this was strongly inspired by the series about 1848 in the Revolutions Podcast and especially this episode: https://thehistoryofrome.typepad.com/revolutions_podcast/2017/08/707-the-hungry-forties-.html
So, if you are looking for additional information, you'll likely find it there.
Thanks.
I wonder if there's anything similar for the Great Famine of 1876 (I don't think so; it looks like it didn't affect the global North very much, and governments remained stable).