I work at Our World in Data, where we try to make research and data on the world's largest problems more accessible and understandable.
I attended EA Global this past weekend, where I received very interesting input from many lovely people on potential improvements. But I thought it'd also be worth asking here to get wider feedback. I'm interested in all the following:
-
Low-hanging 'data fruits': simple datasets or charts that you know to be readily available somewhere and that would add significant value, but that aren't already listed here.
-
High-hanging fruits: things we could add to the website in the medium term with a lot more work (new subjects, larger datasets, data that needs a lot of cleaning, etc.)
-
Imaginary fruits: what you'd like to see on OWID in your wildest dreams (e.g. global population projections to the year 10,000 under various scenarios).
Thank you!
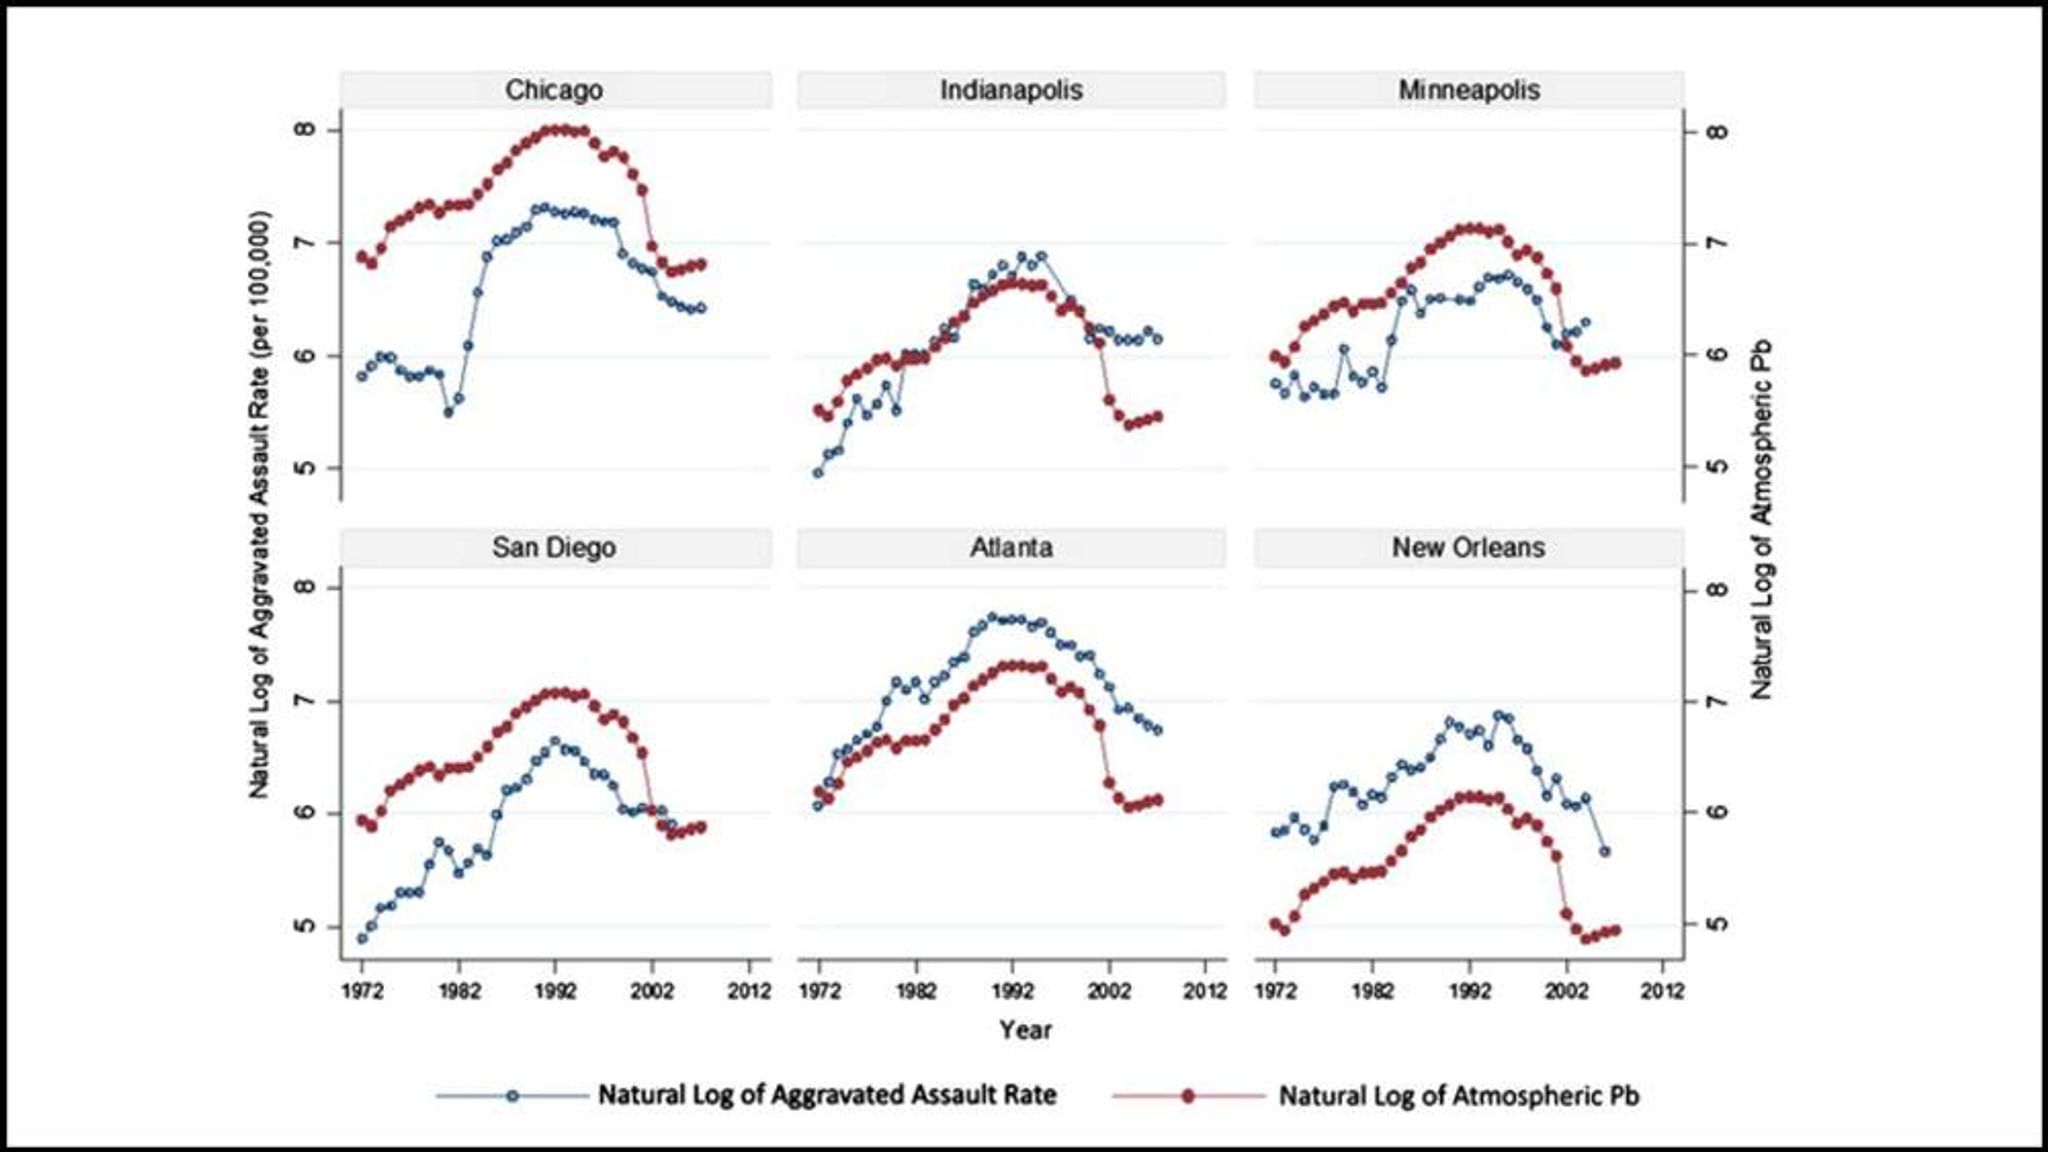
I'm not sure if you're still actively monitoring this post, but the Wikipedia page on the Lead-crime hypothesis (https://en.wikipedia.org/wiki/Lead%E2%80%93crime_hypothesis) could badly use some infographics!! My favorite graph on the subject is this one (from https://news.sky.com/story/violent-crime-linked-to-levels-of-lead-in-air-10458451; I like it because it shows this isn't just localized to one area), but I'm pretty sure it's under copyright unfortunately.